


Description
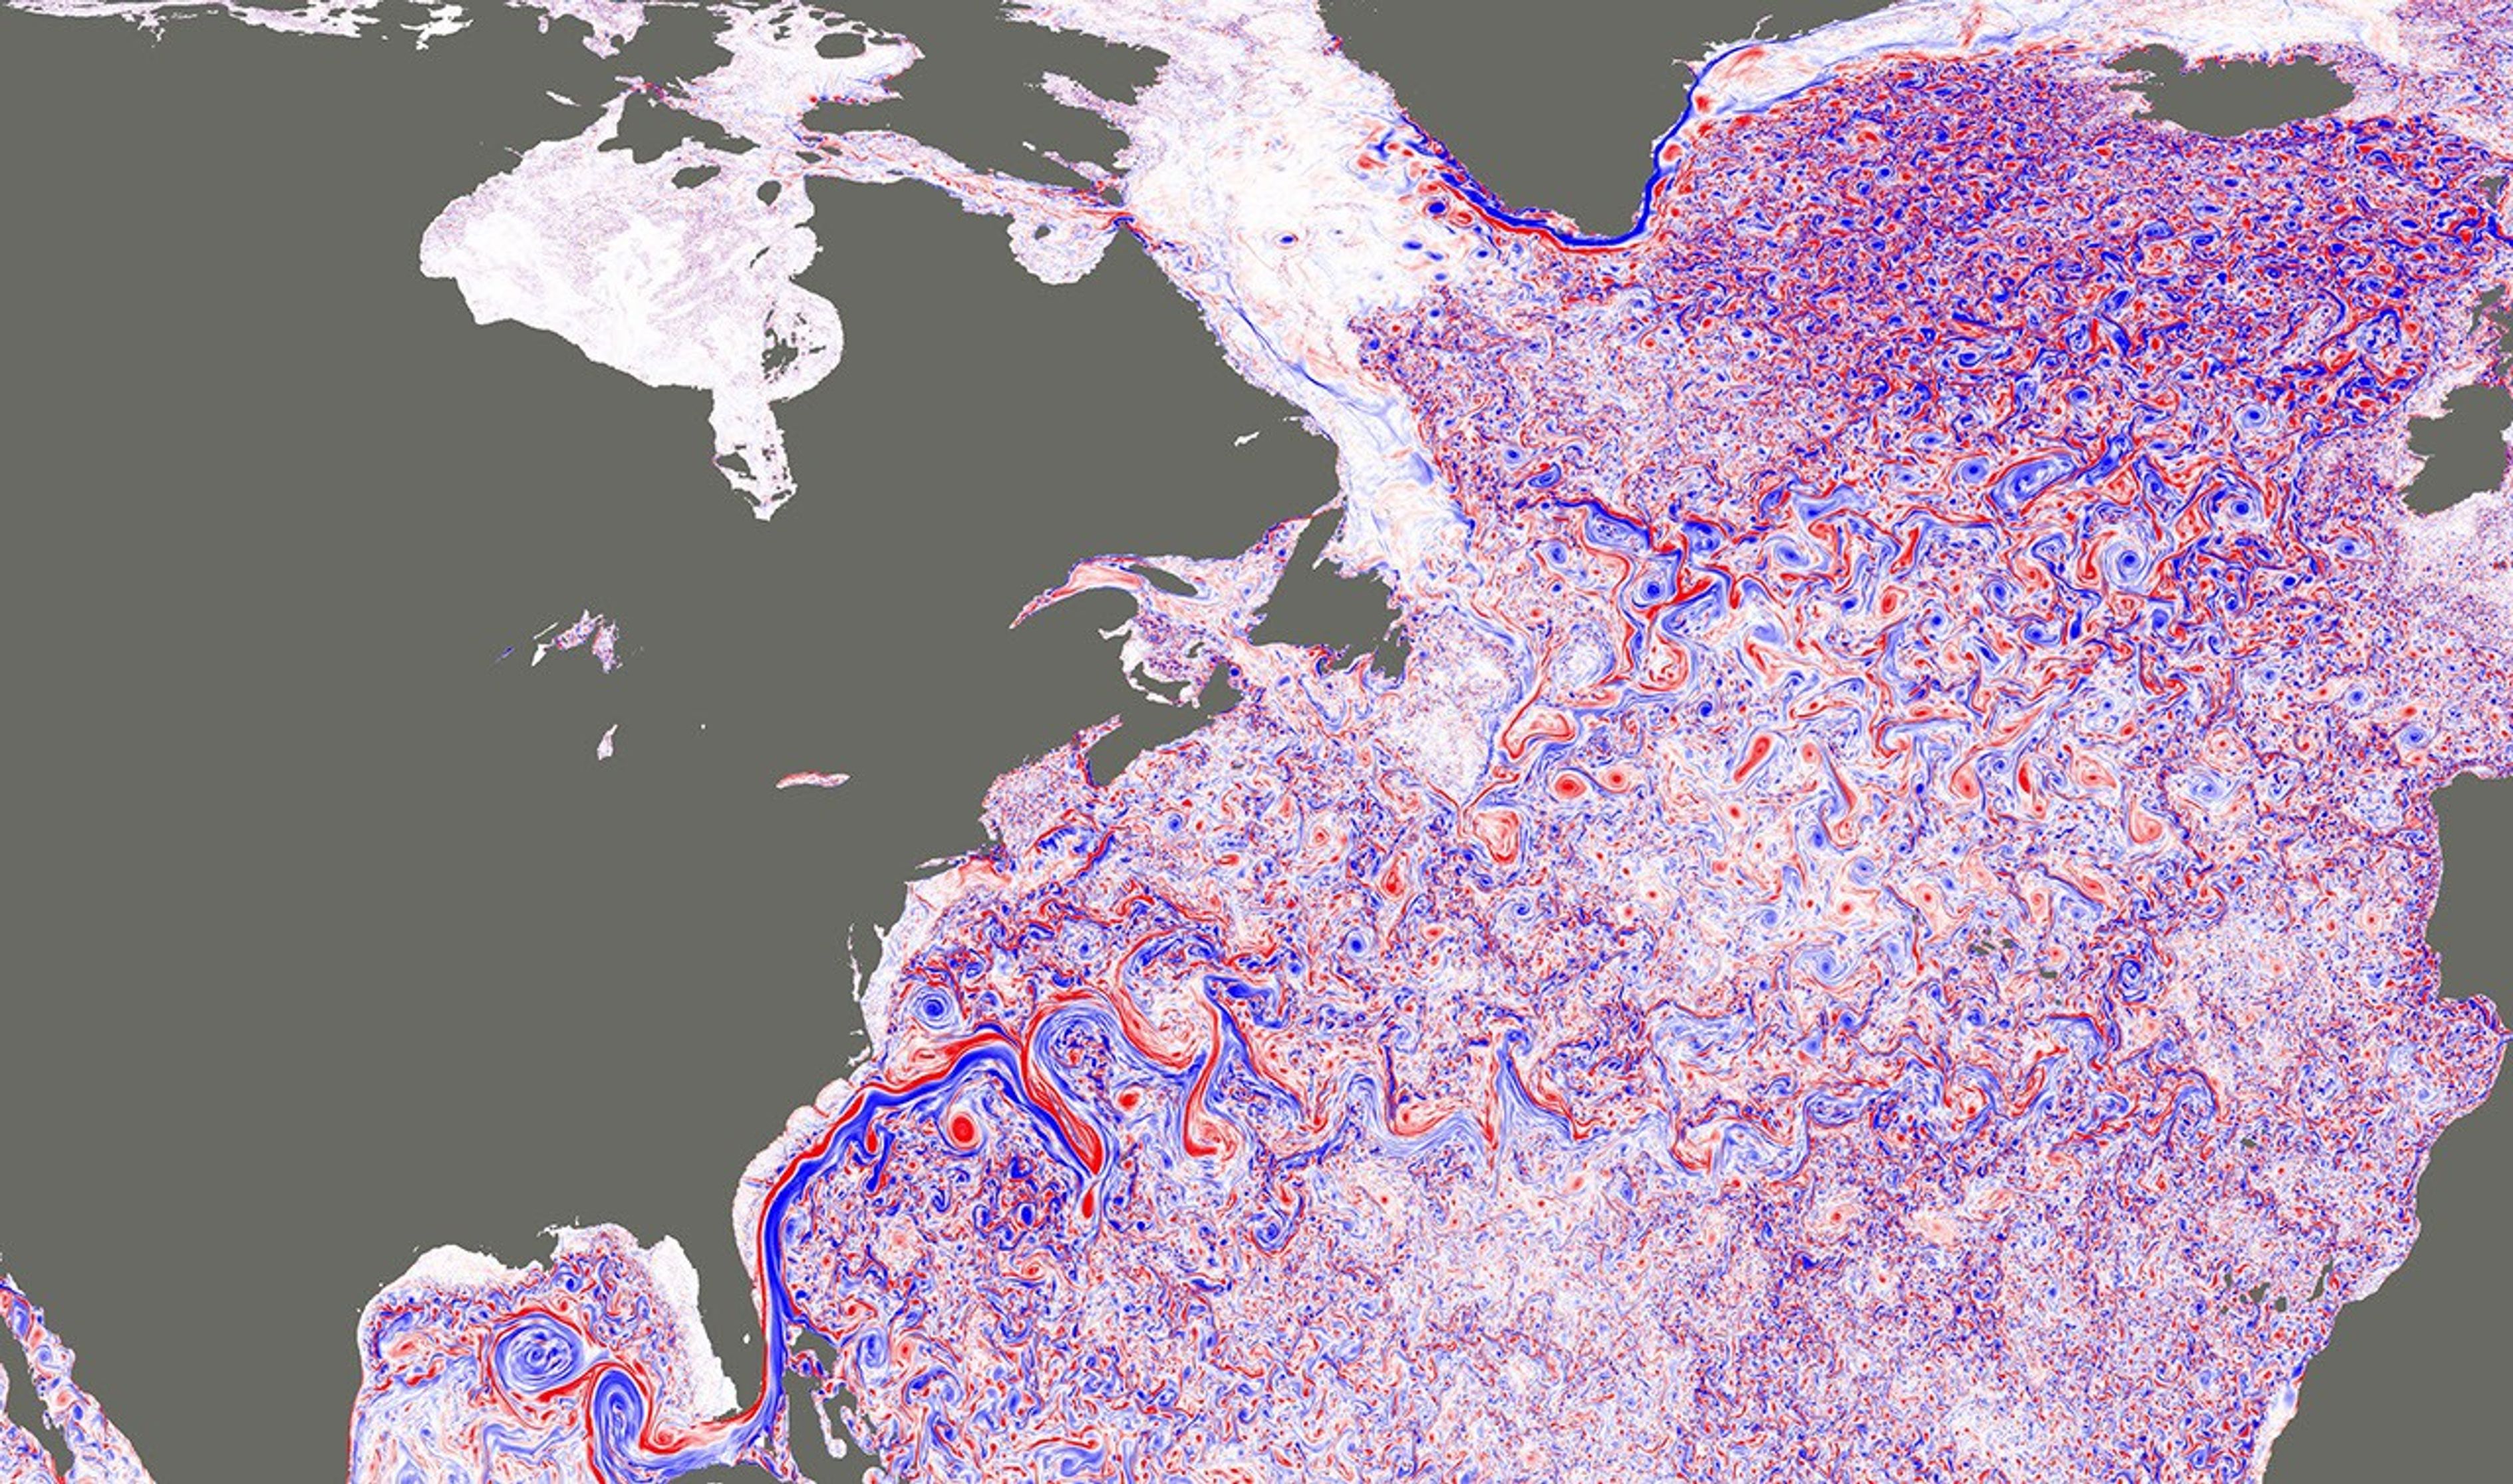
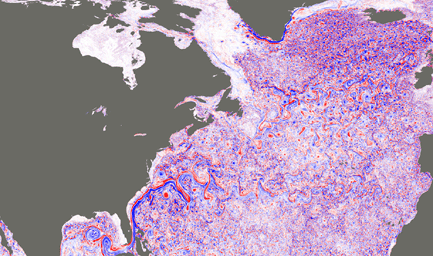
This image shows a simulated snapshot of ocean turbulence in the North Atlantic Ocean in March 2012, from a groundbreaking super-high-resolution global ocean simulation (approximately 1.2 miles, or 2 kilometers, horizontal resolution) developed at JPL (http://wwwcvs.mitgcm.org/viewvc/MITgcm/MITgcm_contrib/llc_hires/llc_4320/). The colors represent the magnitude of surface relative vorticity, a measure of the spin of fluid parcels. The image emphasizes fast-rotating, small-scale (defined here as 6.2 to 31-mile, or 10 to 50 kilometer, range) turbulence, especially during the winter. High levels of relative vorticity caused by small-scale turbulence are believed to strongly transport heat and carbon vertically in the ocean.
The image appears in a study (Su et al. 2018), entitled "Ocean submesoscales as a key component of the global heat budget," published recently in Nature Communications. The study suggests that upper-ocean small-scale turbulence transports heat upward in the ocean at a level five times larger than larger-scale heat transport by ocean eddies, significantly affecting the exchange of heat between the ocean interior and atmosphere. Such interactions have a crucial impact on the Earth's climate.