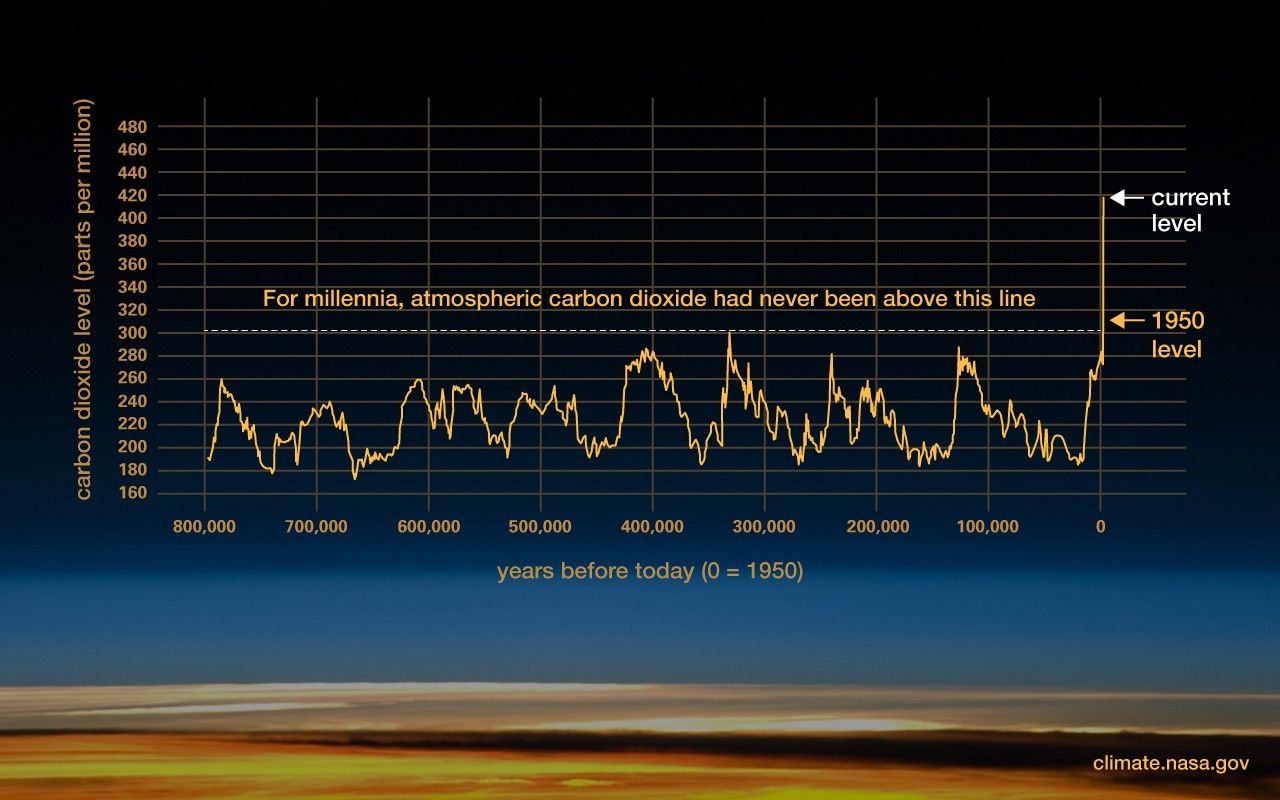
Graphic: The relentless rise of carbon dioxide
| Credit | Data: Luthi, D., et al.. 2008; Etheridge, D.M., et al. 2010; Vostok ice core data/J.R. Petit et al.; NOAA Mauna Loa CO2 record. Some description adapted from the Scripps CO2 Program website, "Keeling Curve Lessons." |
|---|---|
| Language |
|
Ancient air bubbles trapped in ice enable us to step back in time and see what Earth's atmosphere, and climate, were like in the distant past. They tell us that levels of carbon dioxide (CO2) in the atmosphere are higher than they have been at any time in the past 400,000 years. During ice ages, CO2 levels were around 200 parts per million (ppm), and during the warmer interglacial periods, they hovered around 280 ppm (see fluctuations in the graph). In 2013, CO2 levels surpassed 400 ppm for the first time in recorded history. This recent relentless rise in CO2 shows a remarkably constant relationship with fossil-fuel burning, and can be well accounted for based on the simple premise that about 60 percent of fossil-fuel emissions stay in the air.
Today, we stand on the threshold of a new geologic era, which some term the "Anthropocene", one where the climate is very different to the one our ancestors knew.
If fossil-fuel burning continues at a business-as-usual rate, such that humanity exhausts the reserves over the next few centuries, CO2 will continue to rise to levels of order of 1500 ppm. The atmosphere would then not return to pre-industrial levels even tens of thousands of years into the future. This graph not only conveys the scientific measurements, but it also underscores the fact that humans have a great capacity to change the climate and planet.
You can also find this graphic on our “Evidence” page.


