In the pantheon of natural disasters, floods are among the worst. By any metric—from financial ruin to human toll—floods rank alongside earthquakes, hurricanes, and tsunamis. In fact, the most deadly disaster of the 20th century was the China floods of 1931, which may have resulted in more than a million deaths.
Predicting floods is notoriously tricky. They depend on a complex mixture of rainfall, soil moisture, the recent history of precipitation, and much more. Snowmelt and storm surges can also contribute to unexpected flooding.
Thanks to NASA, however, the predictions are improving.
Predicting floods is notoriously tricky. Sponsored by NASA, a new computer tool known as the "Global Flood Monitoring System" is improving forecasts.
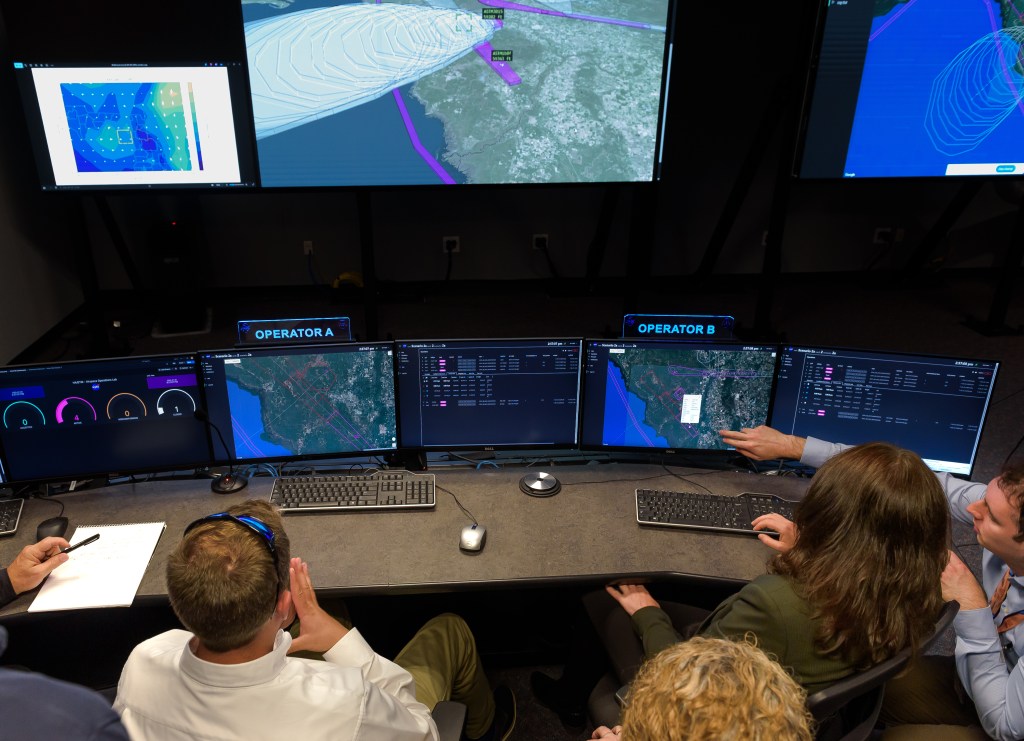
A computer tool known as the Global Flood Monitoring System, or “GFMS,” which maps flood conditions worldwide, is now available online. Users anywhere in the world can use the system to determine when flood water might engulf their communities.
“On our global interactive map, you can zoom into a location of interest to see whether the water is at flood stage, receding, or rising,” explains the University of Maryland’s Robert Adler, who developed the system with colleague Huan Wu. “You can also look around to see whether there is a rain event upstream, whether the rain is over, and how the water is moving downstream.”
GFMS works 24/7, even when there is cloud cover or other interference.
“At times, our system might be the only way people can get information,” says Adler.
Here’s how it works.
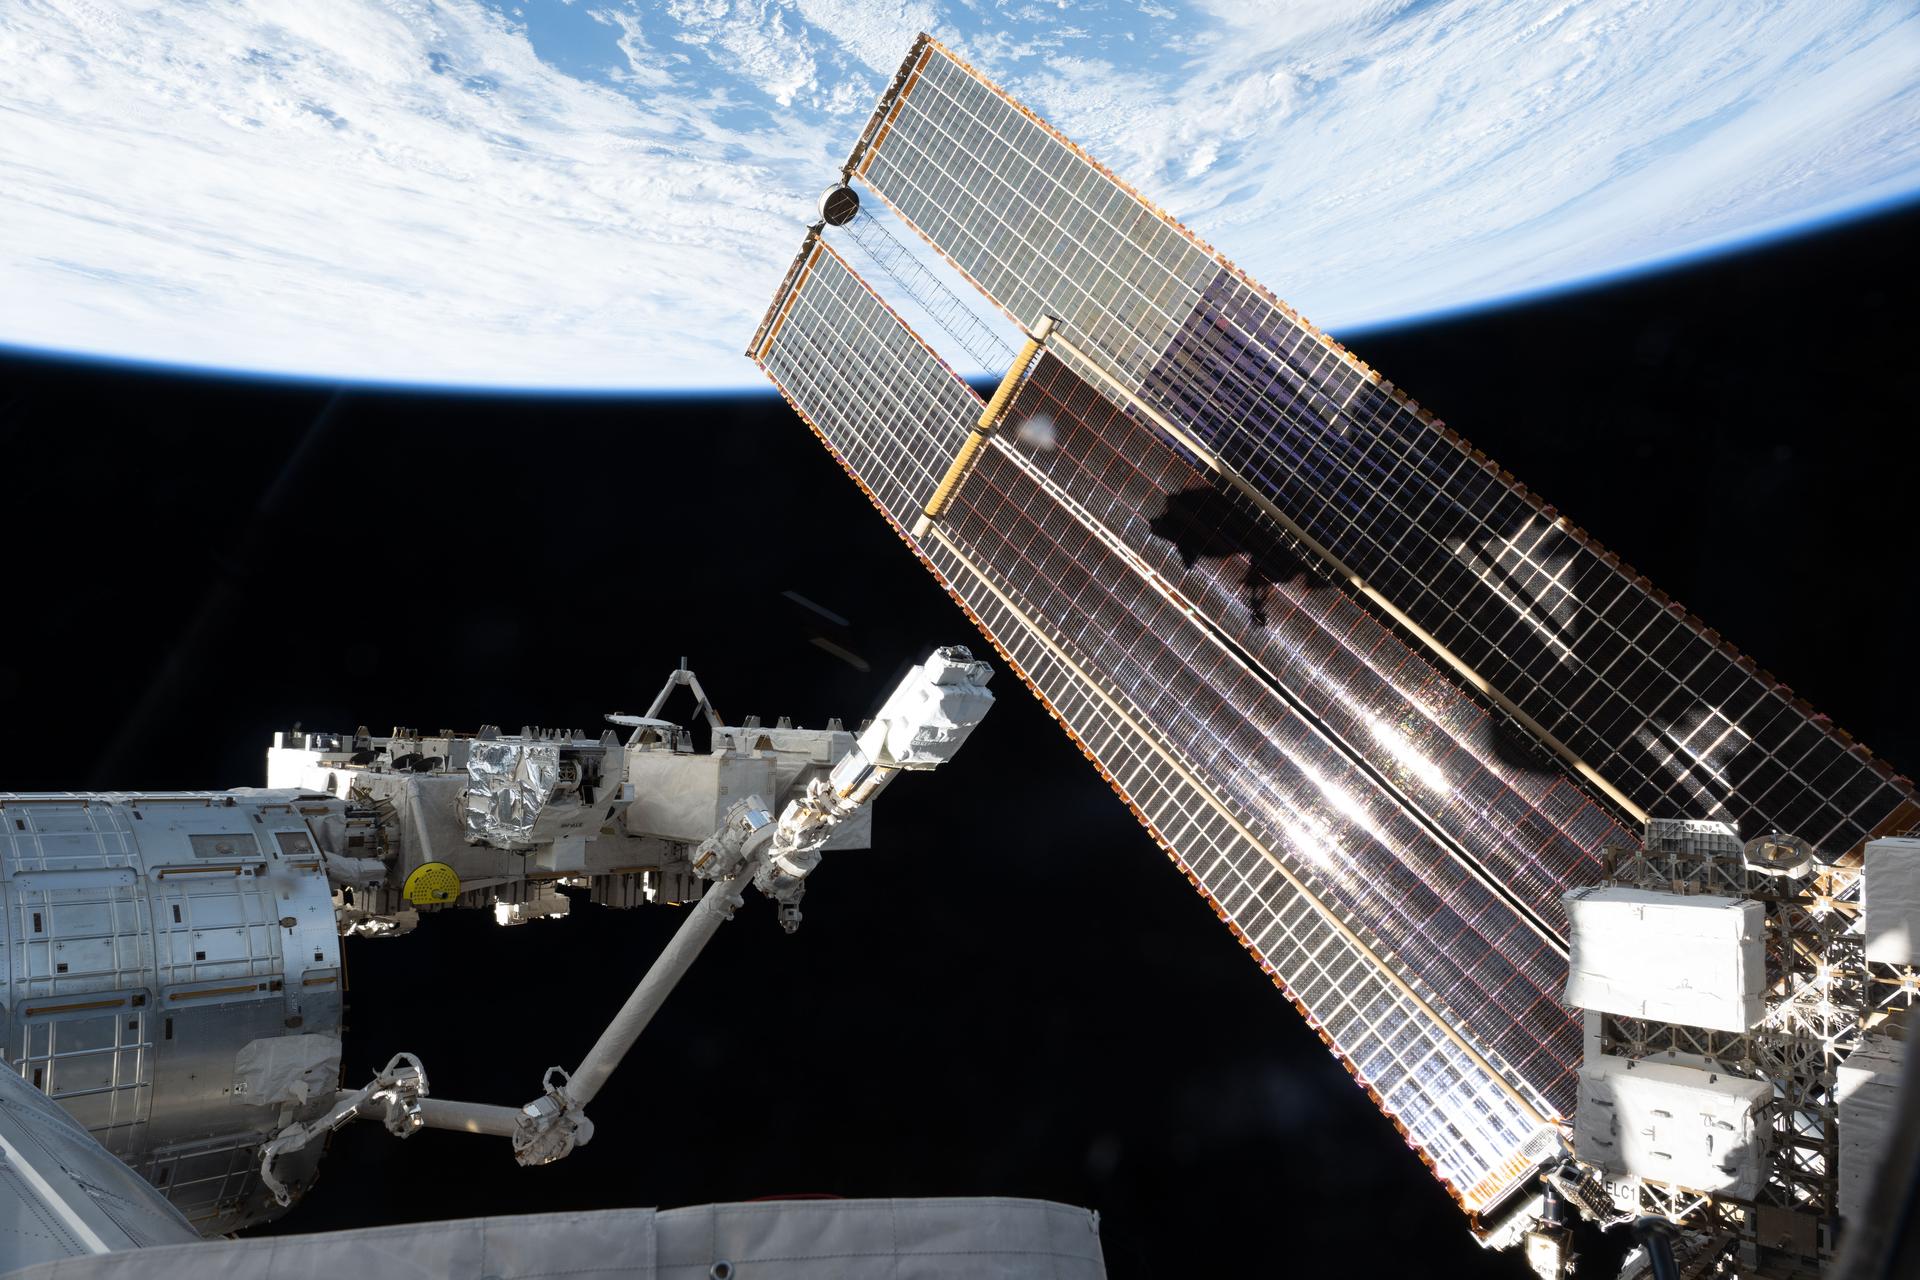
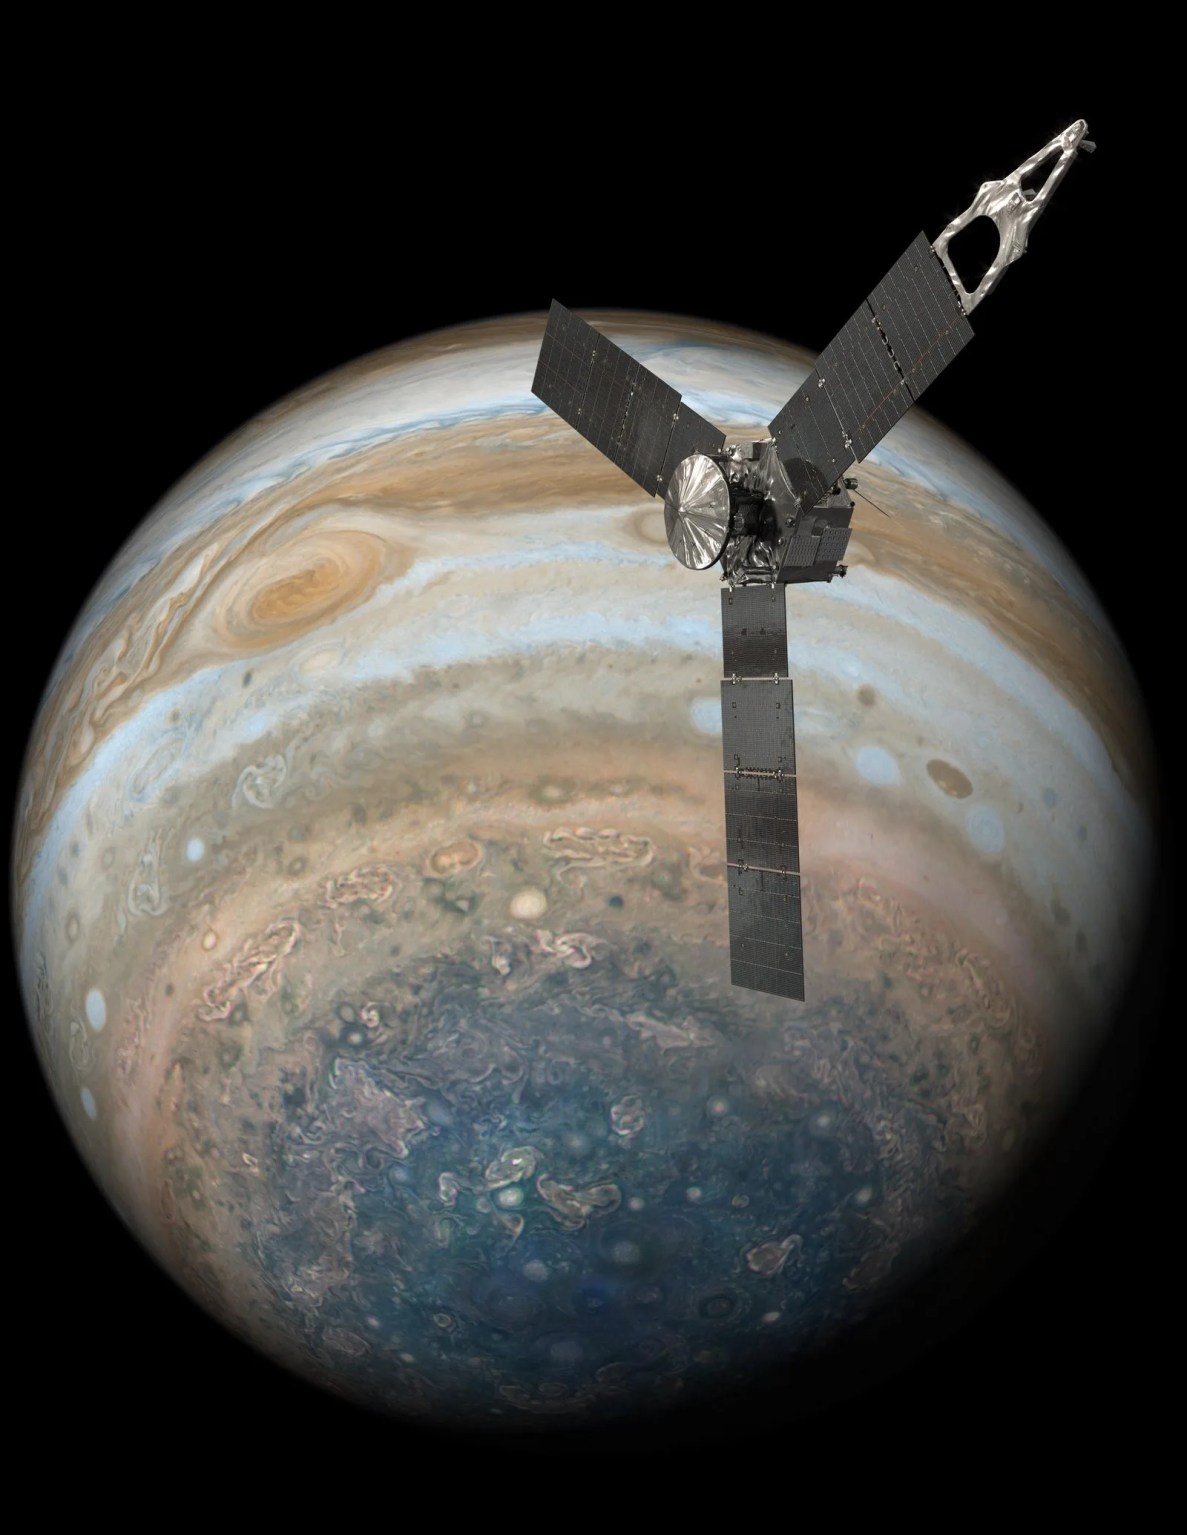
GFMS relies on precipitation data from NASA’s Earth observing satellites. Originally, the system relied on the Tropical Rainfall Measuring Mission satellite. Earlier this year, GFMS transitioned to the new Global Precipitation Measurement satellite, or “GPM.” Rainfall data from GPM is combined with a land surface model that incorporates vegetation cover, soil type, and terrain to determine how much water is soaking in--and how much is feeding the streamflow.
Users can view statistics for rainfall, streamflow, water depth, and flooding every 3 hours at each 12 km gridpoint on a global map. Forecasts for these parameters go out to 5 days. Users can also zoom in further to see inundation maps (areas estimated to be covered with water) as fine as 1 km resolution.
Organizations like the Red Cross and the UN World Food Program are already using GFMS before, during, and after floods when ground information is lacking – which is often the case.
“They use it to figure out when and where a flood has occurred and to estimate how big it is. They use that information in tandem with population maps to target relief efforts.”
Adler is already looking forward to major improvements to the system, courtesy of the new GPM satellite.
“Advances by GPM will allow us to estimate floods and landslides across the globe more accurately. Also, GPM’s global coverage, as compared to TRMM’s tropical latitude focus, will allow more accurate [forecasts] at middle and high latitudes.”
Adler plans to work with international groups like the Global Flood Partnership to help spread the word.
More information about the system is available at http://flood.umd.edu/


