


By Alex Gurvich
NASA's Goddard Space Flight Center
Have you ever wondered how to track an eclipse down to the exact second? NASA has you covered! As the countdown to the highly anticipated Oct. 14, 2023, annular solar eclipse continues, NASA is proud to unveil the Eclipse Explorer – an interactive map designed to enhance your eclipse-viewing experience. Crafted to complement our existing static eclipse maps, this tool enables users to dive into this amazing celestial event like never before.
What Is the 2023 Eclipse Explorer?
The 2023 Eclipse Explorer demonstrates that celestial events are predictable down to the second. Unlike traditional static maps, this interactive version is feature-rich, offering layers upon layers of details that space enthusiasts can toggle on or off to explore each facet at their own pace.
Key features:
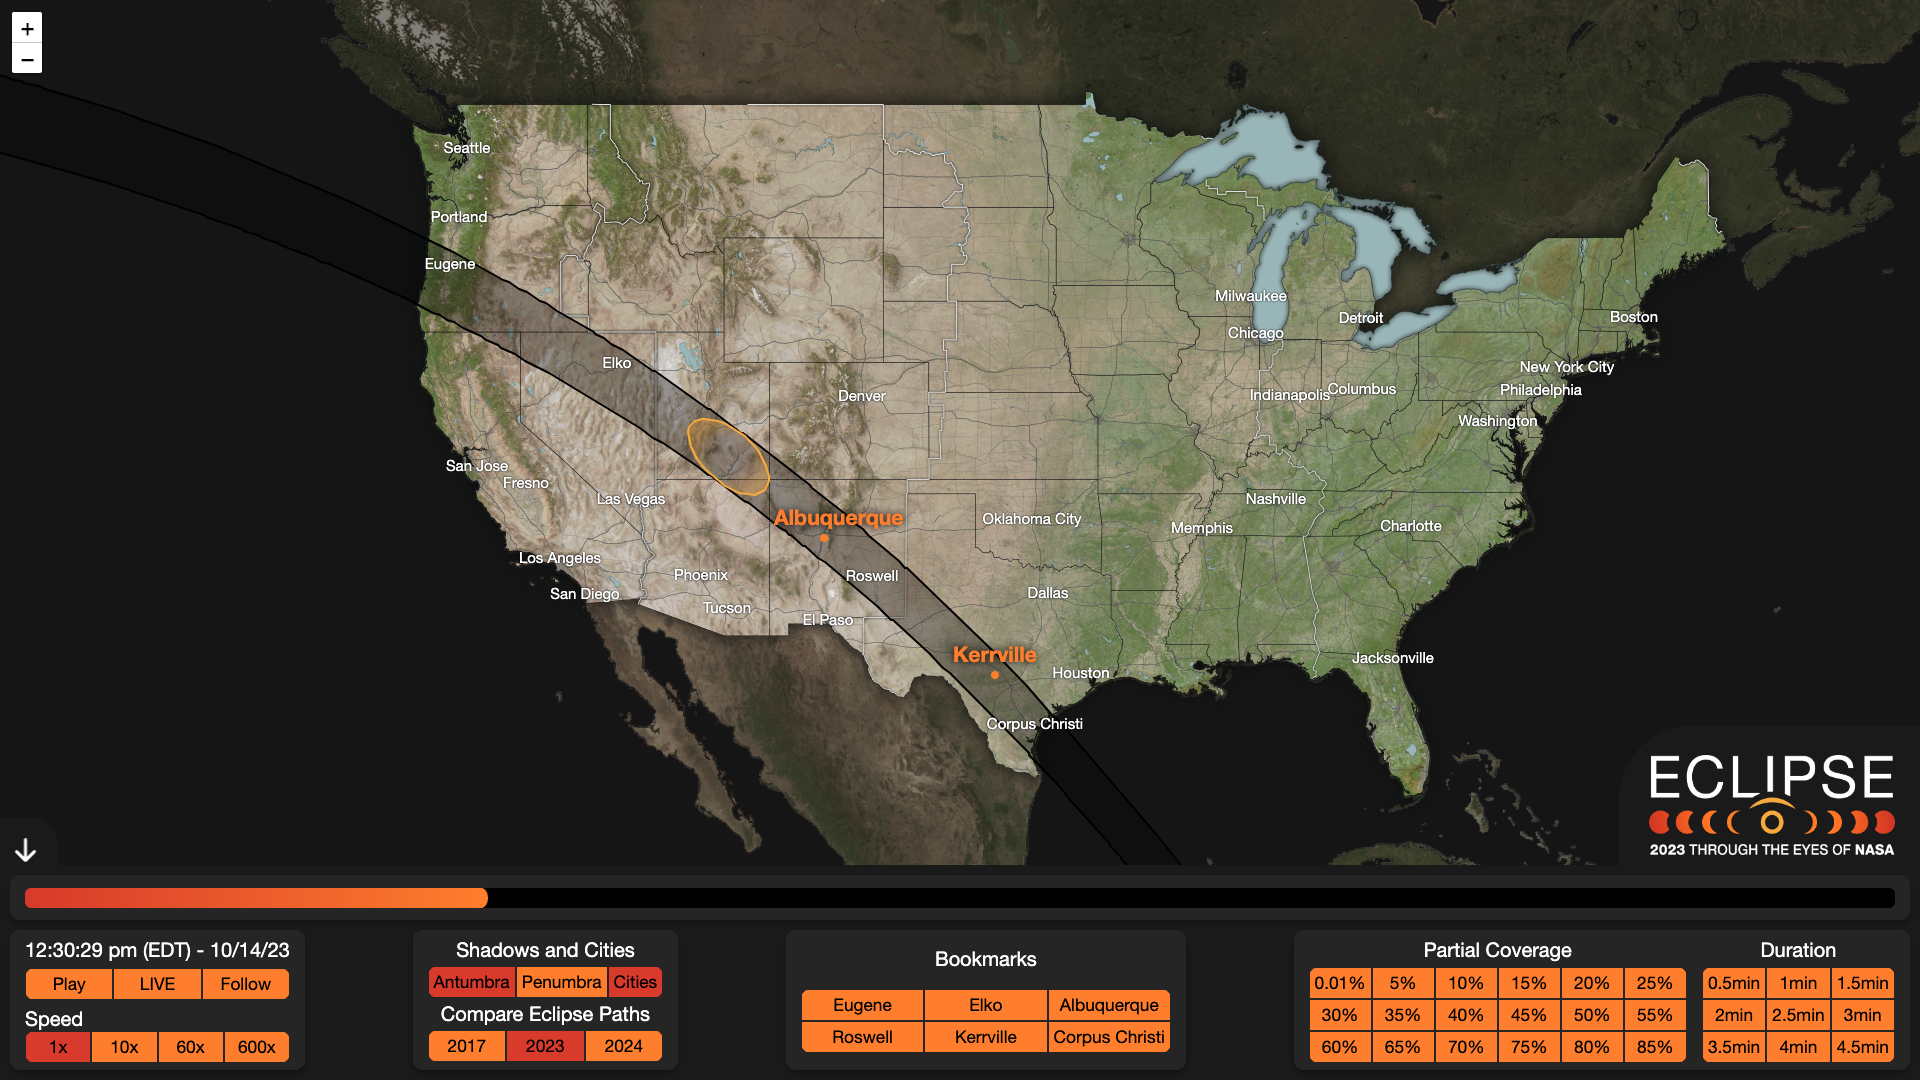
- Dynamic Layers: Toggle lines showing what percentage of the Sun will be covered at the peak of the eclipse, outlines of areas where the duration of annularity (when the Moon is entirely in front of the Sun) is highest, and the path and shapes of the antumbra (the darkest part of the shadow and where annularity occurs) and penumbra (the brighter parts of the shadow, where only a partial eclipse is visible).
- Time Slider: Scrub through time to see the motion of the eclipse shadows across the U.S. on the day of the eclipse.
- City Information: Click city labels to access detailed local data including current weather conditions and a simulated image of the eclipse for that particular location. For each city, buttons for different phases of the eclipse automatically skip to the time on the map when each of those events happen in that city.
- Countdown Widget: Count down to the moment of maximum coverage for each city.
- Auto-Play: Automatically play the eclipse forward in time at varying speeds. Clicking the "follow" toggle button will move the map to track the shadow as it moves across the landscape during the eclipse.

How to Use Eclipse Explorer
Using the 2023 Eclipse Explorer is as easy as moving a slider! The interface comes with a grid of toggle buttons at the bottom, divided into different categories: shadow components, city labels (or bookmarks), eclipse paths, coverage percentages, and duration intervals. Clicking any of the buttons will make that data appear (or disappear) on the map. Additionally, clicking any of the city labels on the map brings up a pop-up filled with additional information about the eclipse at that location.
Pro Tip: Click the phase icons on the city pop-up to show the map at that moment. For example, if you have the penumbra layer activated and click the first and last eclipse icons, you’ll be able to see the penumbra crossing the selected city.
Making the Map
The 2023 Eclipse Explorer is a web application developed by NASA's Scientific Visualization Studio (SVS). The application is written in Javascript and uses React, a powerful user-interface framework, and Leaflet, an open-source map plugin, to display map data and eclipse shapes. The eclipse shapes were calculated by SVS visualizer Ernie Wright and account for the individual craters along the edge of the Moon as mapped by the Lunar Reconnaissance Orbiter. This data is so precise that it takes a long time to load in all at once! Handling all this data in Eclipse Explorer was a task all by itself. To avoid having users wait while the data downloads, the app only loads the necessary eclipse data on demand.
Call to Action
The NASA annular eclipse broadcast team plans to use the 2023 Eclipse Explorer in the live broadcast, so make sure to tune in and see the map in action on Oct. 14!
As we gear up for the April 2024 total solar eclipse, we welcome any feedback on the application via the "get in touch!" button at the bottom of the SVS homepage.
For more resources about the 2023 solar eclipse, visit NASA's eclipse page.
Whether you're a casual skywatcher or an avid eclipse chaser, the 2023 Eclipse Explorer promises an exciting and educational interactive experience. So go ahead, toggle and slide your way into the next annular solar eclipse!