


Multispectral Scanner System (MSS)
The Multispectral Scanner System (MSS) was the first digital remote sensing instrument, revolutionizing Earth observation from space.
Overview
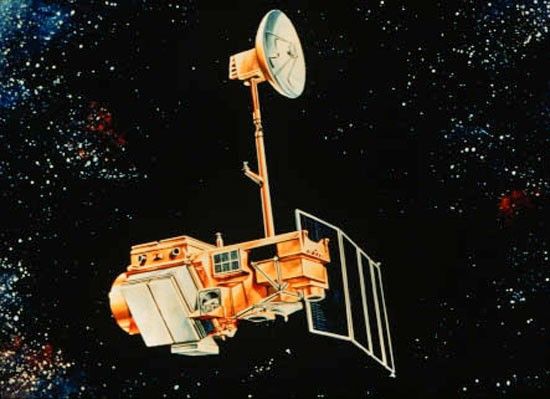
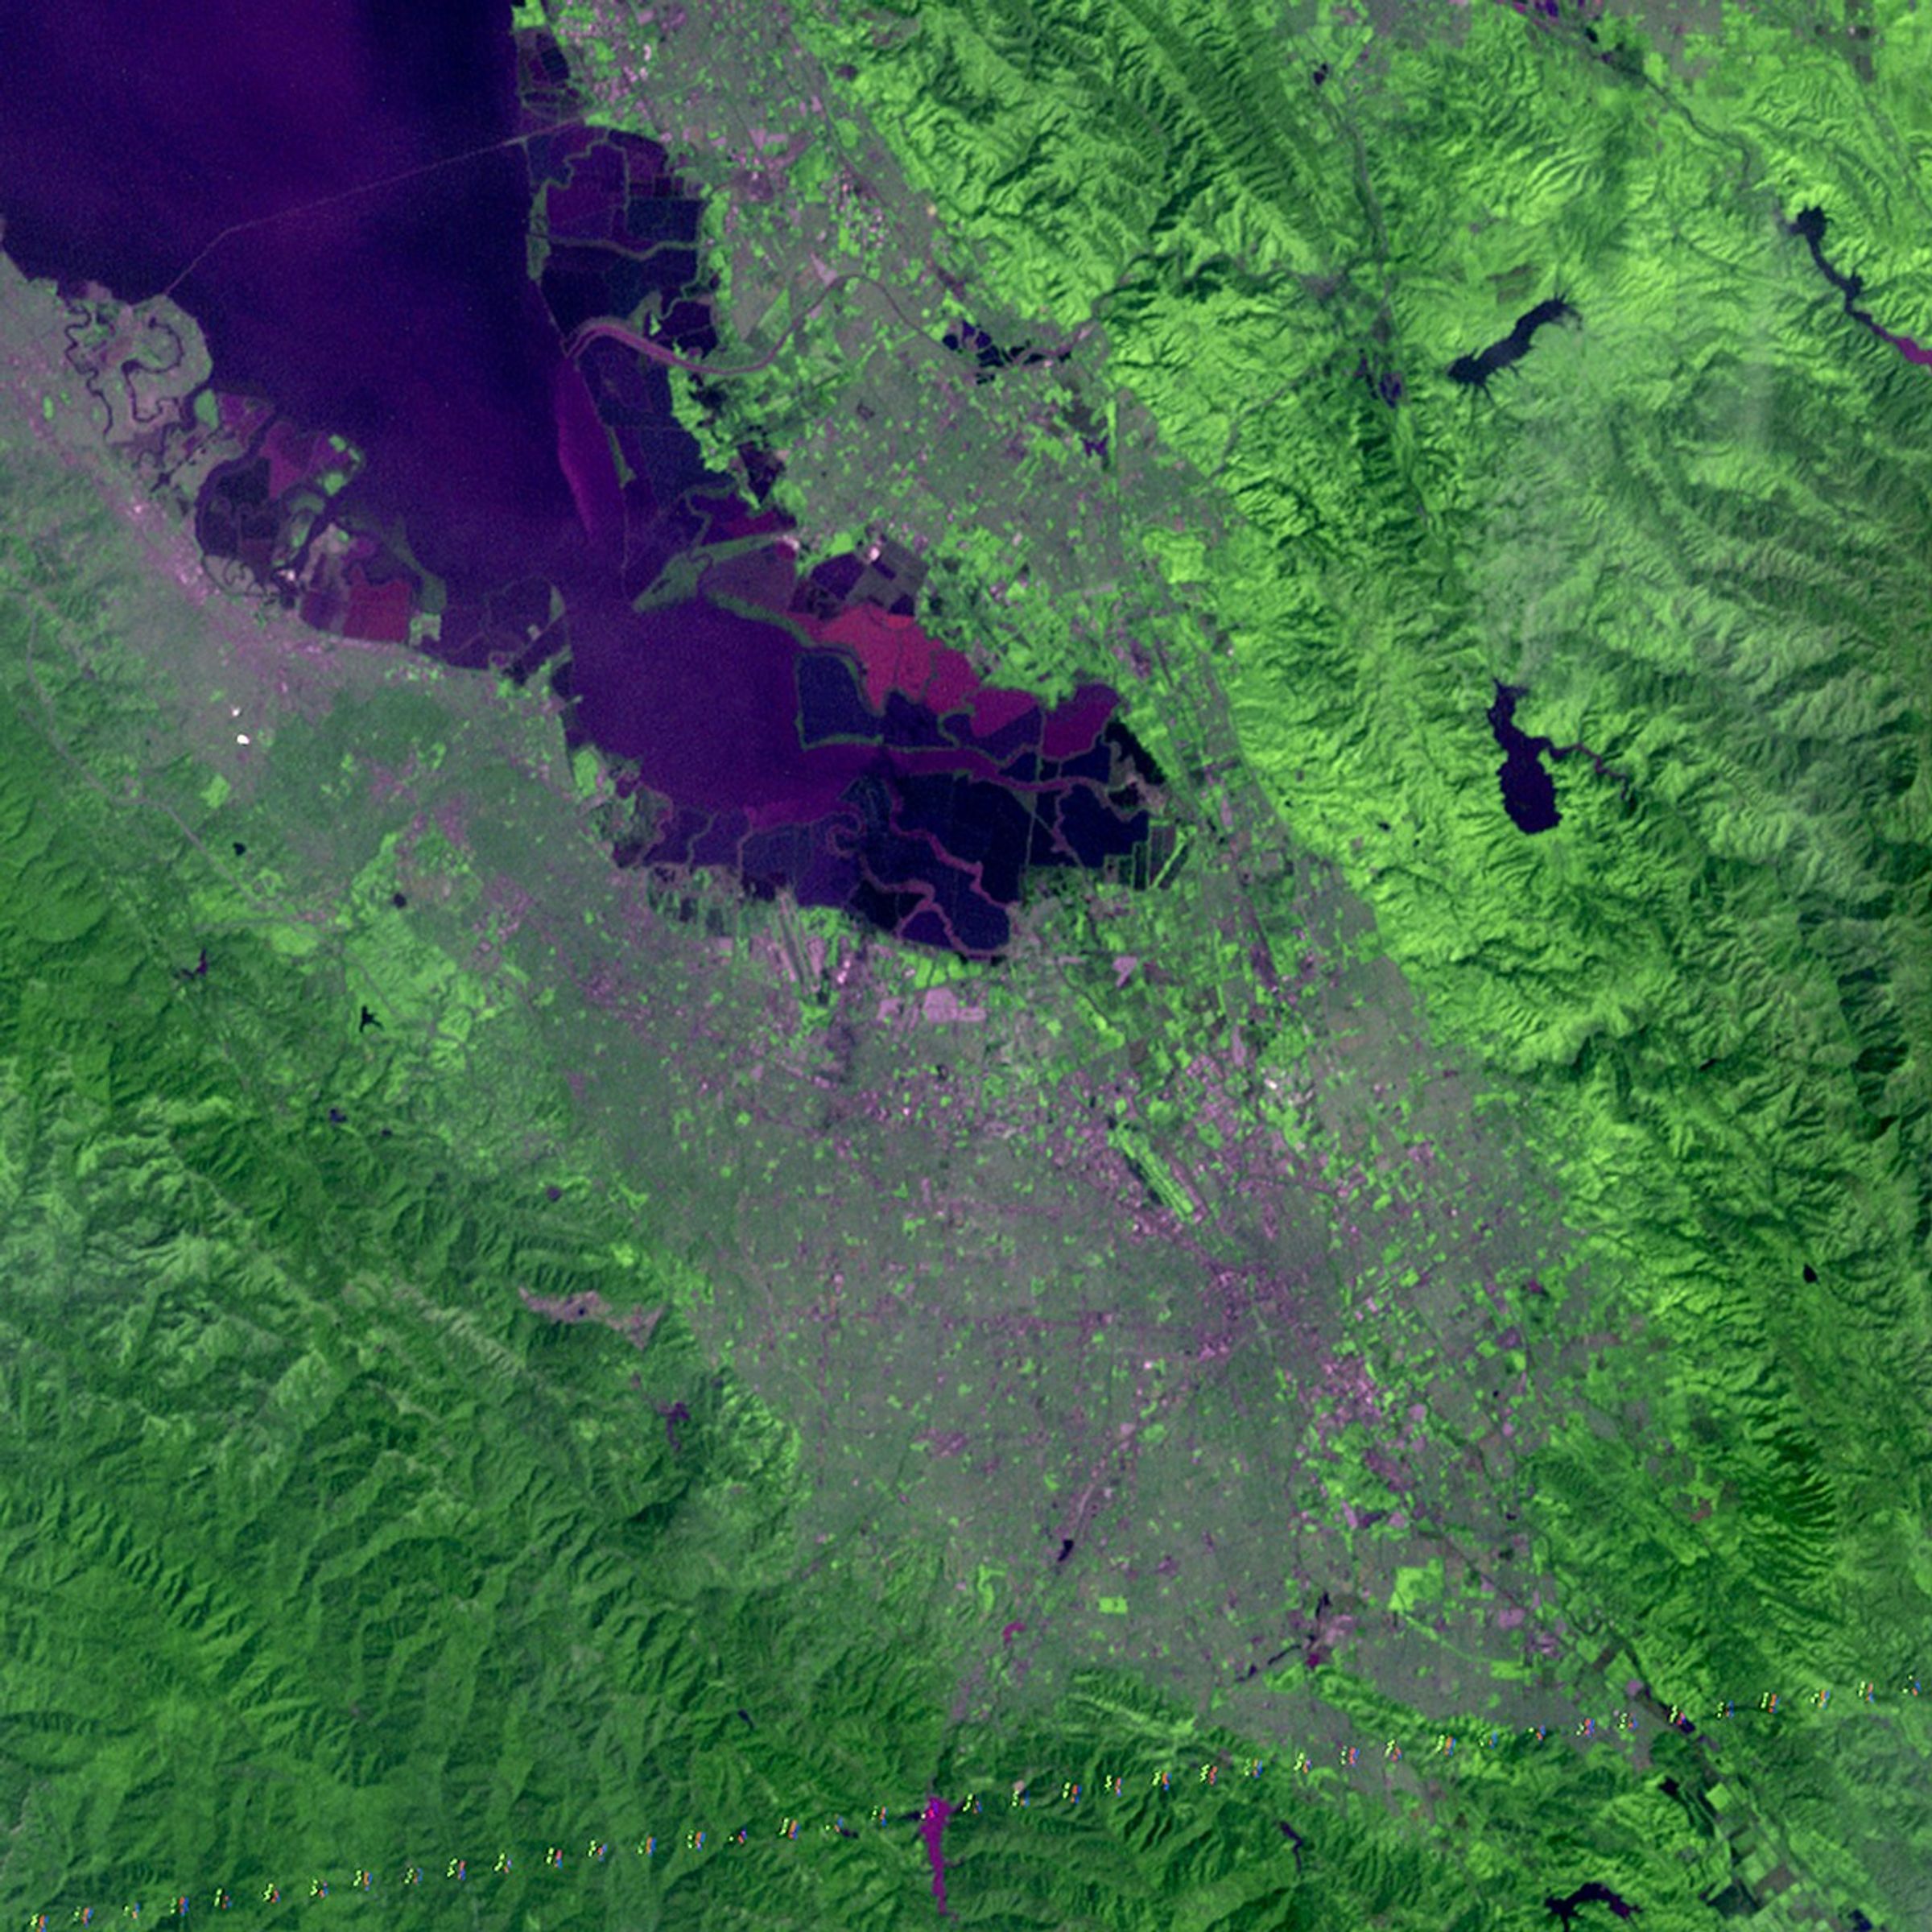
The Multispectral Scanner System (MSS) was a line scanning sensor carried on the first five Landsat satellites. It sensed sunlight reflected off the Earth’s surface in four spectral bands: two in the visible and two in the near-infrared portions of the spectrum. Landsat 3 carried an MSS with an additional band that measured thermal-infrared radiation (heat) emitted from the Earth’s surface.
The primary function of the MSS was to provide repetitive daylight observations of the Earth's surface on a global basis to support various disciplines such as agriculture, forestry, geology, and hydrology. After launch, data from the MSS was proven useful for additional applications: mapping sea-ice fields, locating and tracking major ocean currents, monitoring both air and water pollution, determining snow cover, investigating severe storm environments, and more.
The MSS revolutionized Earth observations by introducing digital imaging technology that enabled pixel-level measurements to study land dynamics from space. This groundbreaking sensor served as the foundation for modern digital imaging technologies, including today's digital cameras and high-definition televisions.
Requirements
- return images in four spectral bands: the green, red and two near-infrared bands
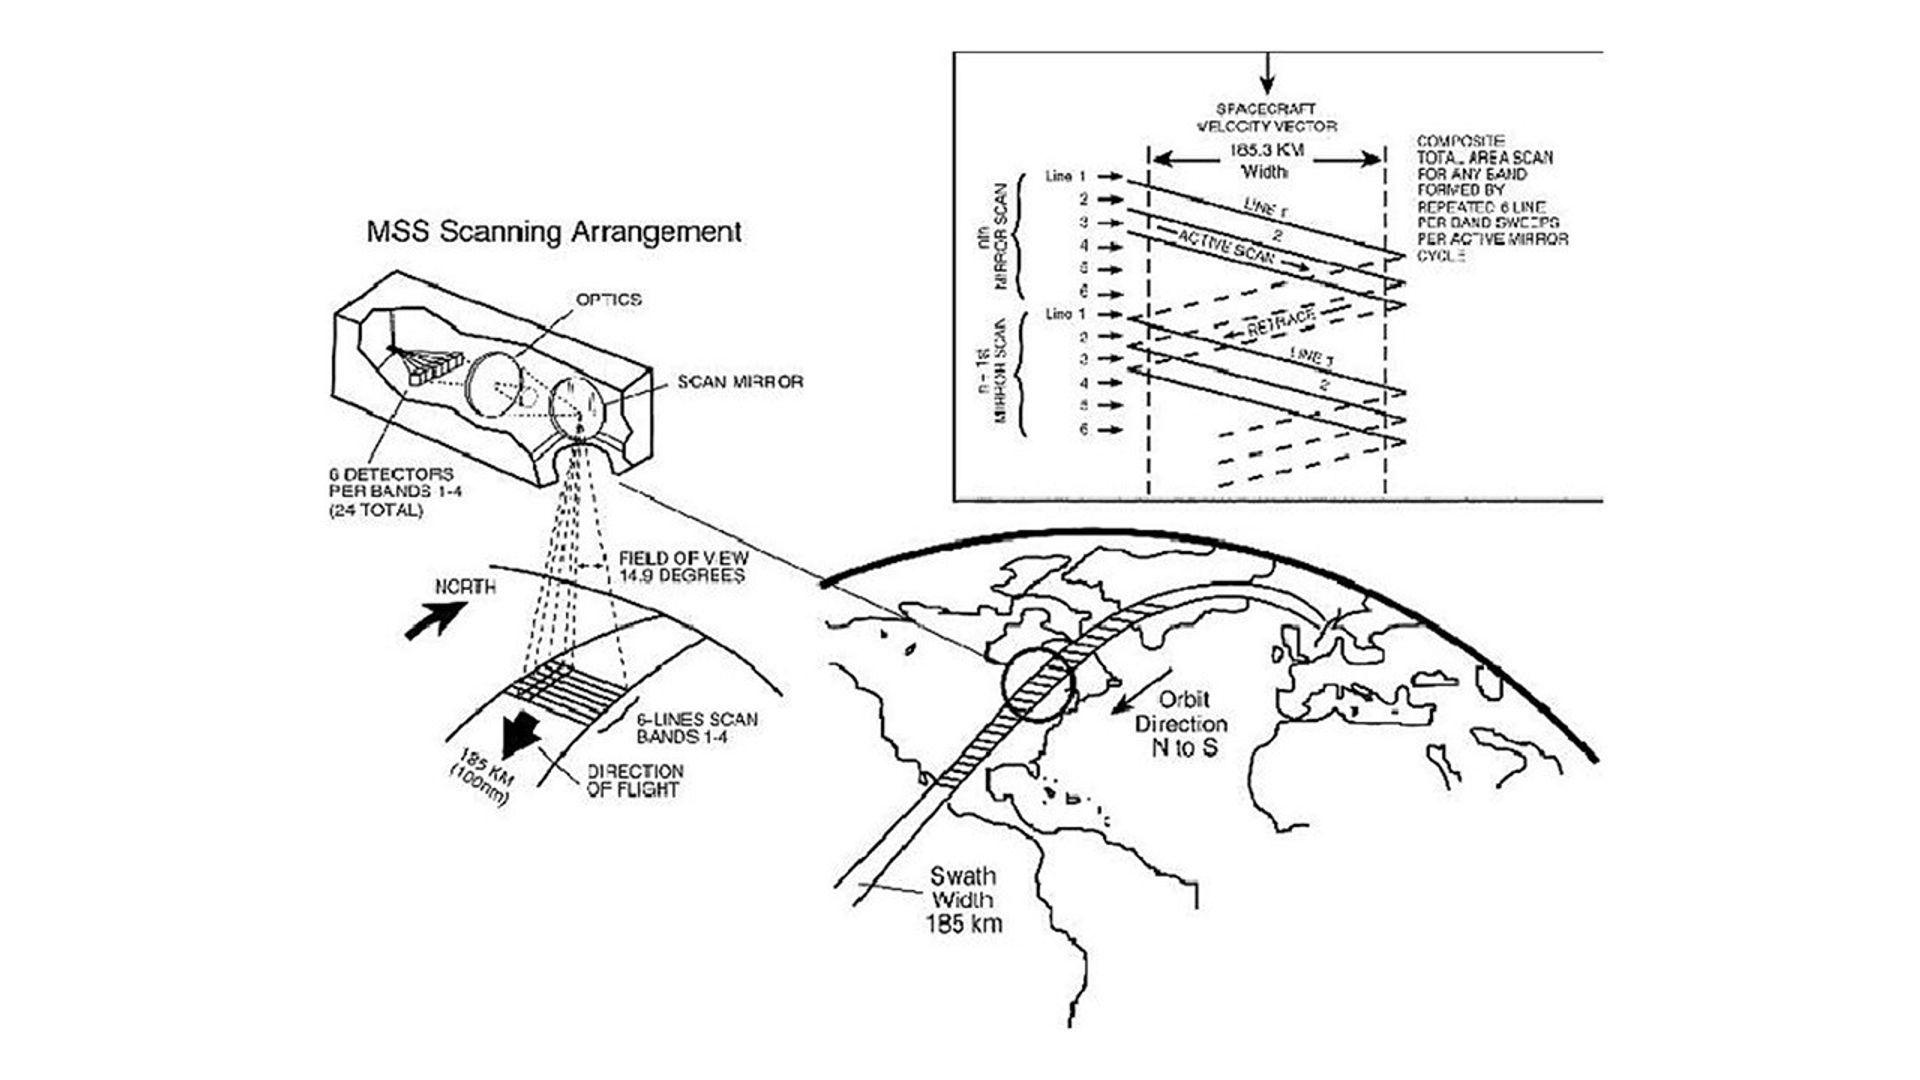
- cover a continuous video strip corresponding to the RBV coverage with a swath width of 185 km (115 miles)
- imaging swath width of 100 nautical miles
- ability to resolve details of 80 meters across
- no gaps in sampling from the edge of one orbit to the next at the equator
- acquisition of full Earth surface coverage in less than a month
The mission's coverage needs determined the spacecraft's orbital parameters—an altitude of 917 kilometers and an inclination of 99.2 degrees—which created an 18-day repeat pattern.
Rigorous radiometric and geometric calibration were required to ensure consistency between subsequent scenes collected over the same location. This requirement was essential for analyzing change over time.
Design
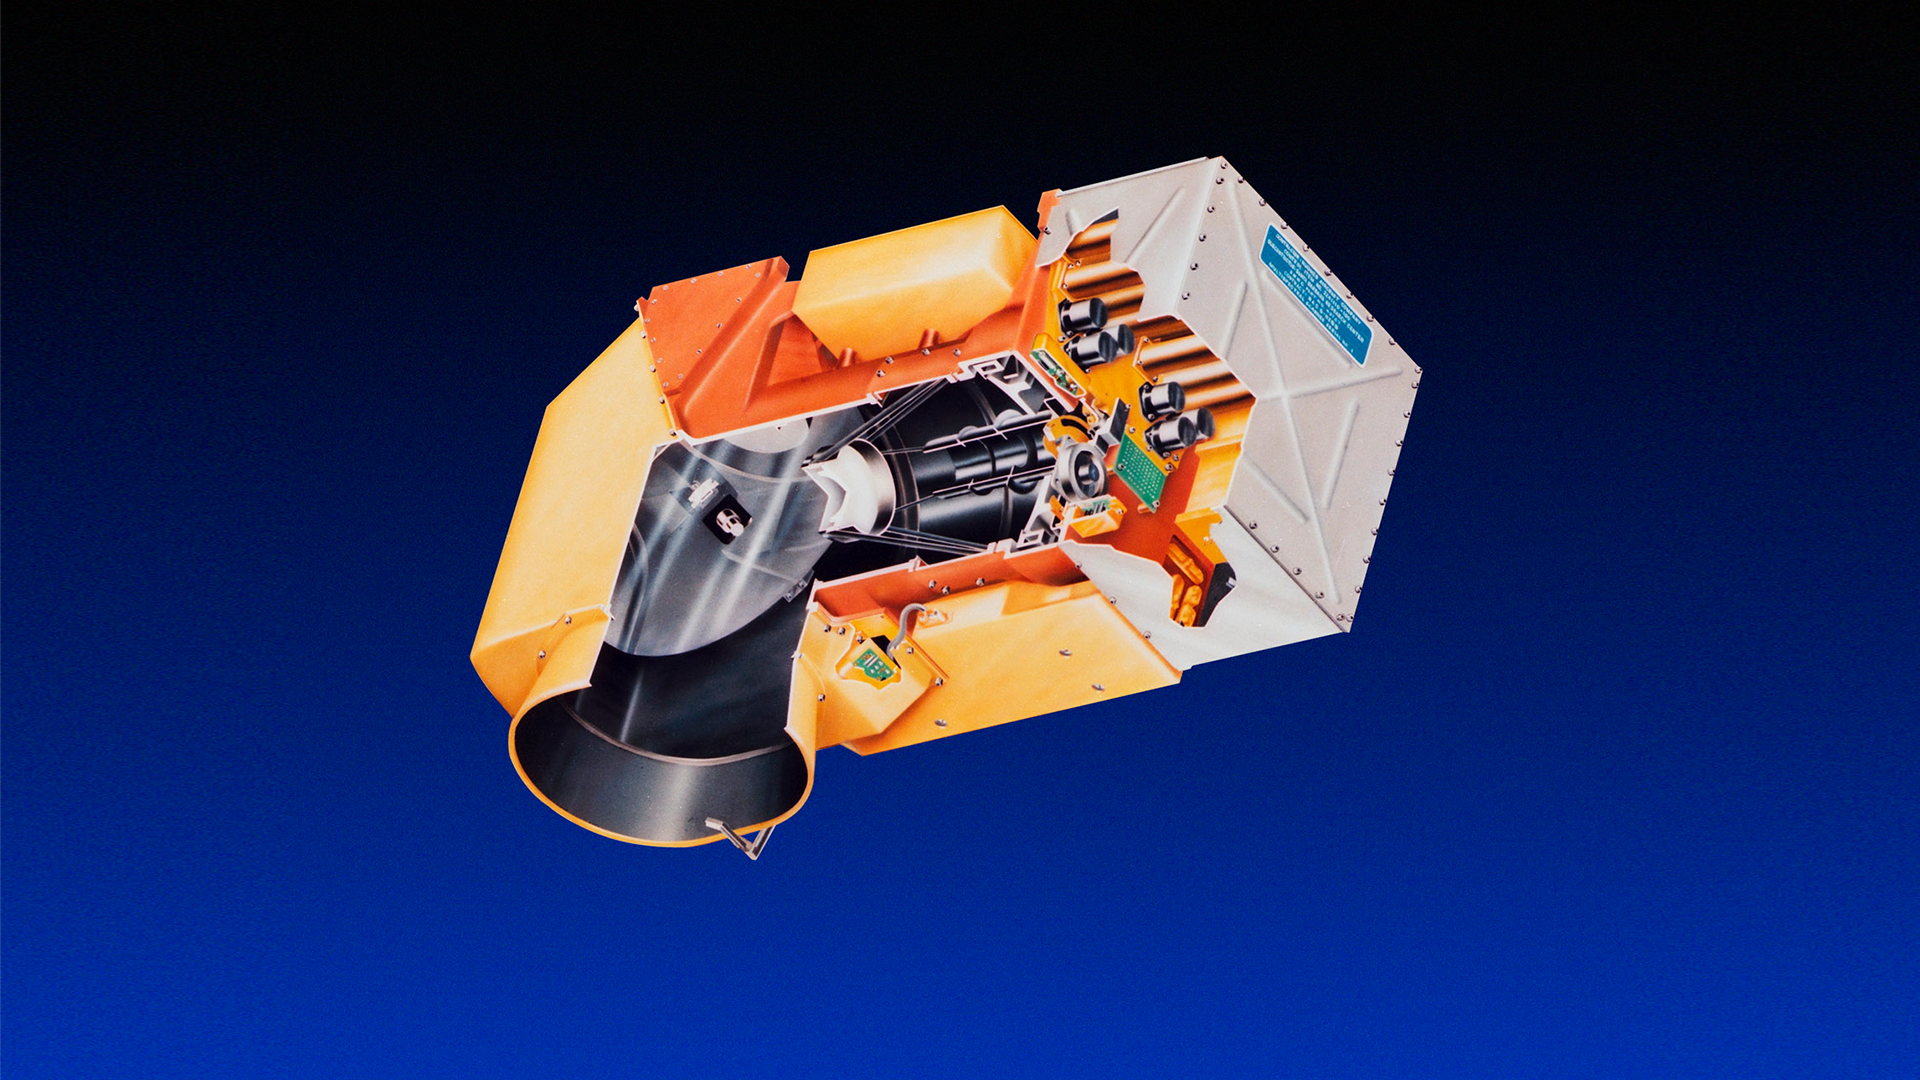
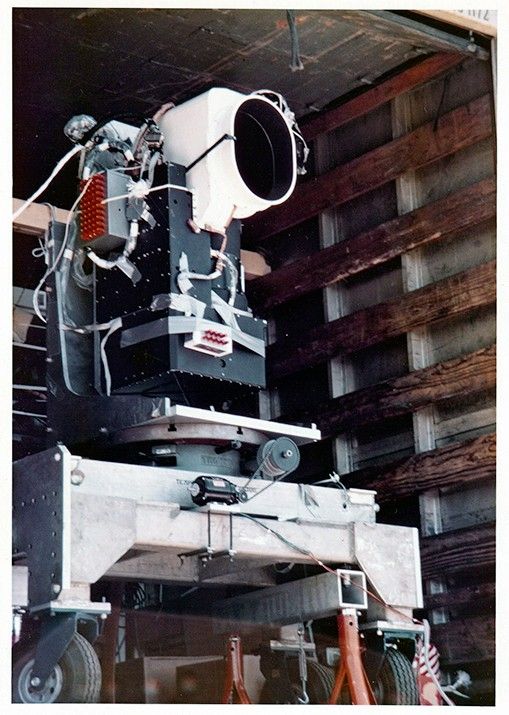
The Multispectral Scanner System (MSS) sensors were line scanning devices observing the Earth perpendicular to the orbital track. The cross-track scanning was accomplished by an oscillating mirror; six lines were scanned simultaneously in each of the four spectral bands for each mirror sweep. The forward motion of the satellite provided the along-track scan line progression.
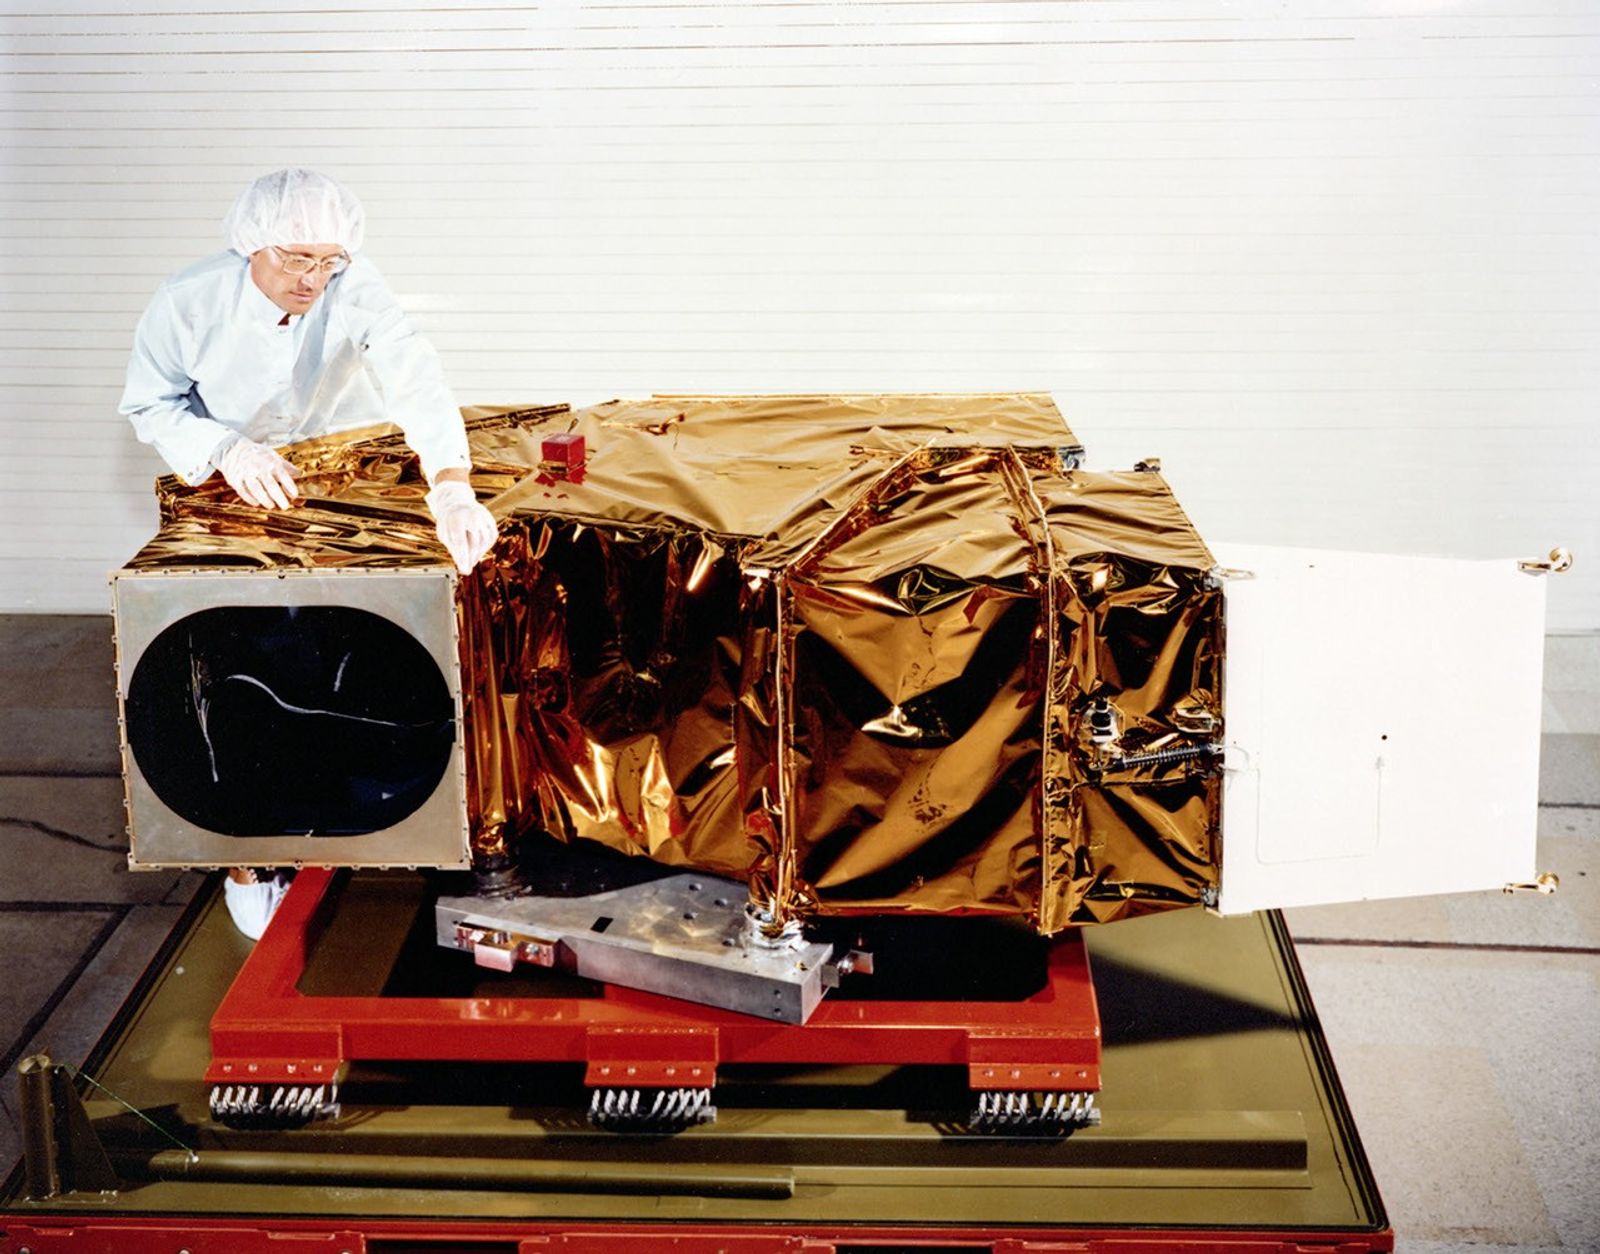
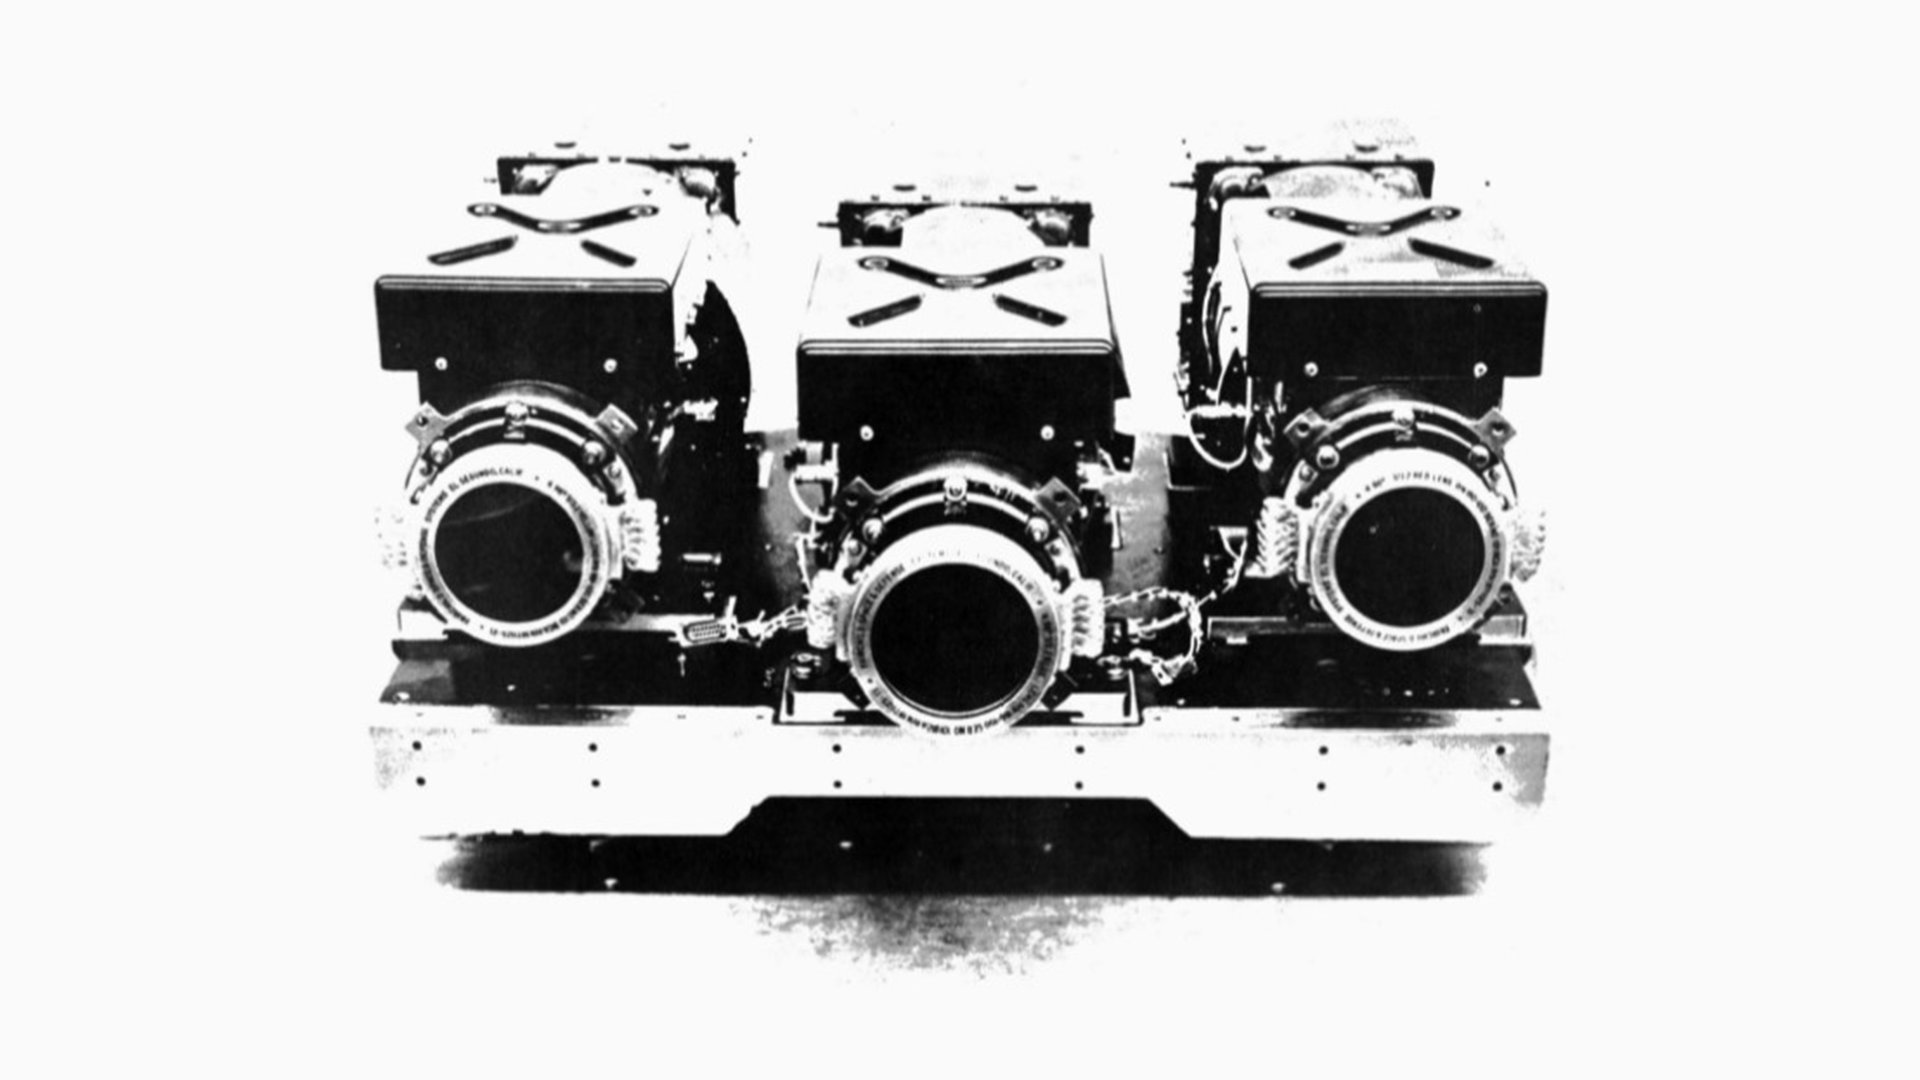
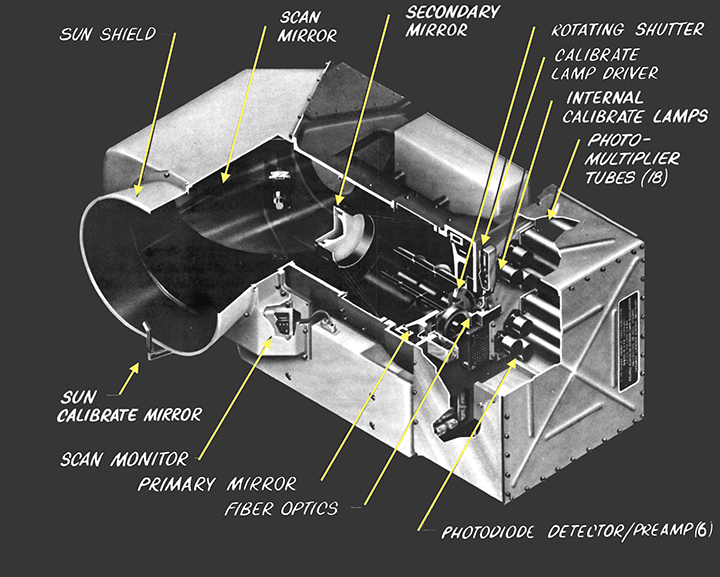
The MSS consisted of a 22.86-centimeter double reflector-type telescope, scanning mirror, filters, detectors, and associated electronics. Incoming radiation was collected by the scanning mirror and separated into four spectral bands using optical filters and sensed by an array of detectors. The detectors for bands 4 through 6 used photomultiplier tubes, while band 7 detectors used silicon photodiodes.
MSS Enhancements on Landsat 3
Following the recommendation of the National Research Council, Landsat engineers added a thermal band on Landsat 3 and future missions. Landsat 3’s thermal-infrared band was sensitive to temperatures from 260–340 K (-13º–67º C) and represented a major leap forward. It was used for measuring land surface temperature, better monitoring agriculture, detecting fires, and studying urban heat islands.
Data Handling
The MSS used a multiplexer to process the scanner's 24 channels of data. These data were then transmitted (at 2229.5 MHz) directly to an acquisition station or stored on magnetic tape for subsequent playback the next time the spacecraft came within communication range of a ground station.
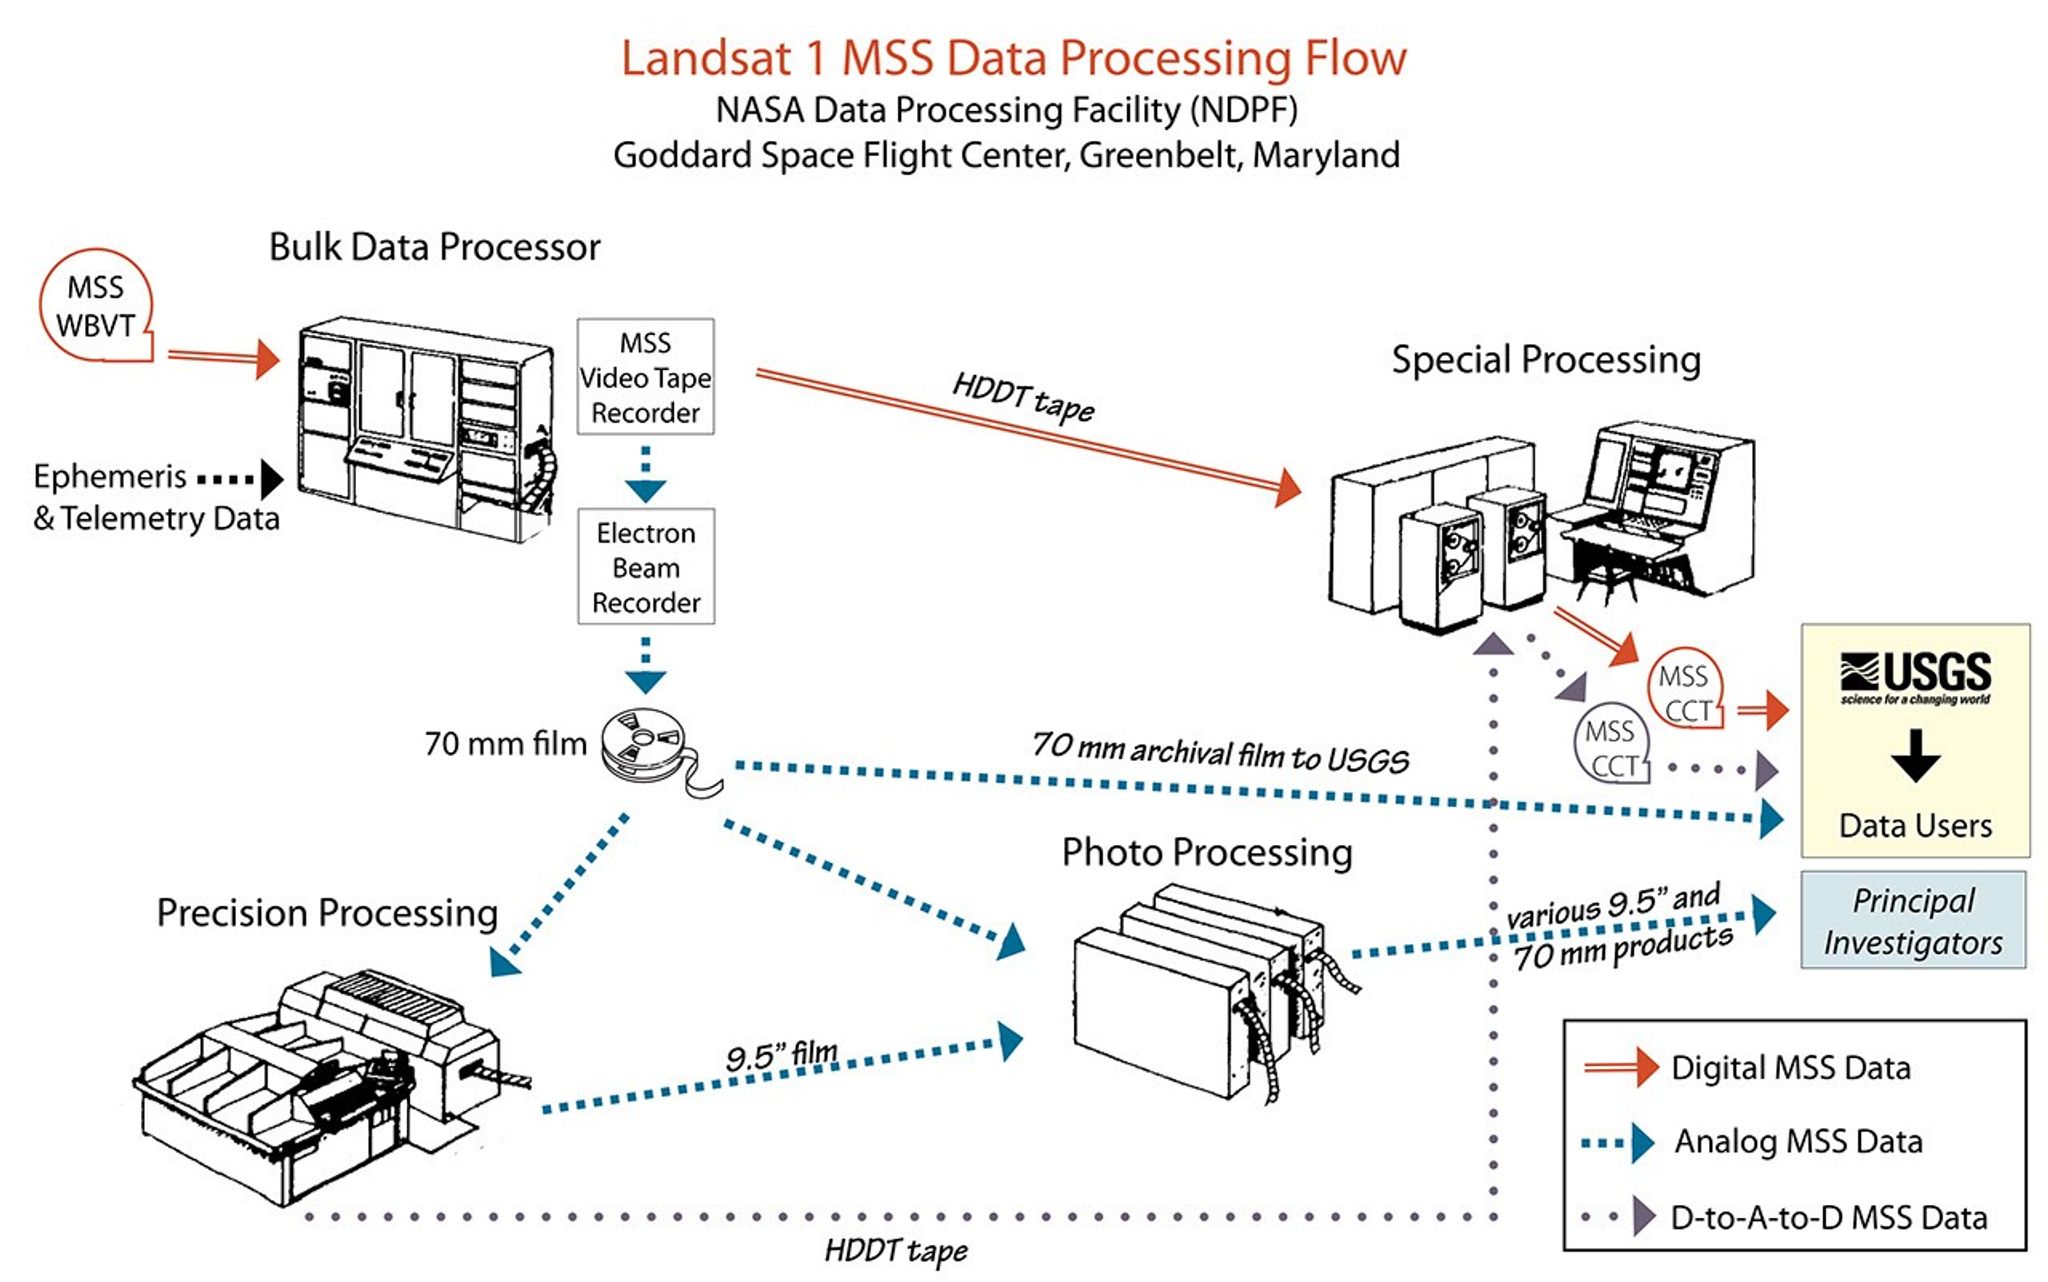
The NASA Data Processing Facility, at NASA Goddard Space Flight Center (GSFC) converted image data from the magnetic tape to photographic prints and color transparencies. The facility also duplicated and distributed data tapes in addition to transmitting image data to the U.S. Geological Survey’s EROS Data Center.
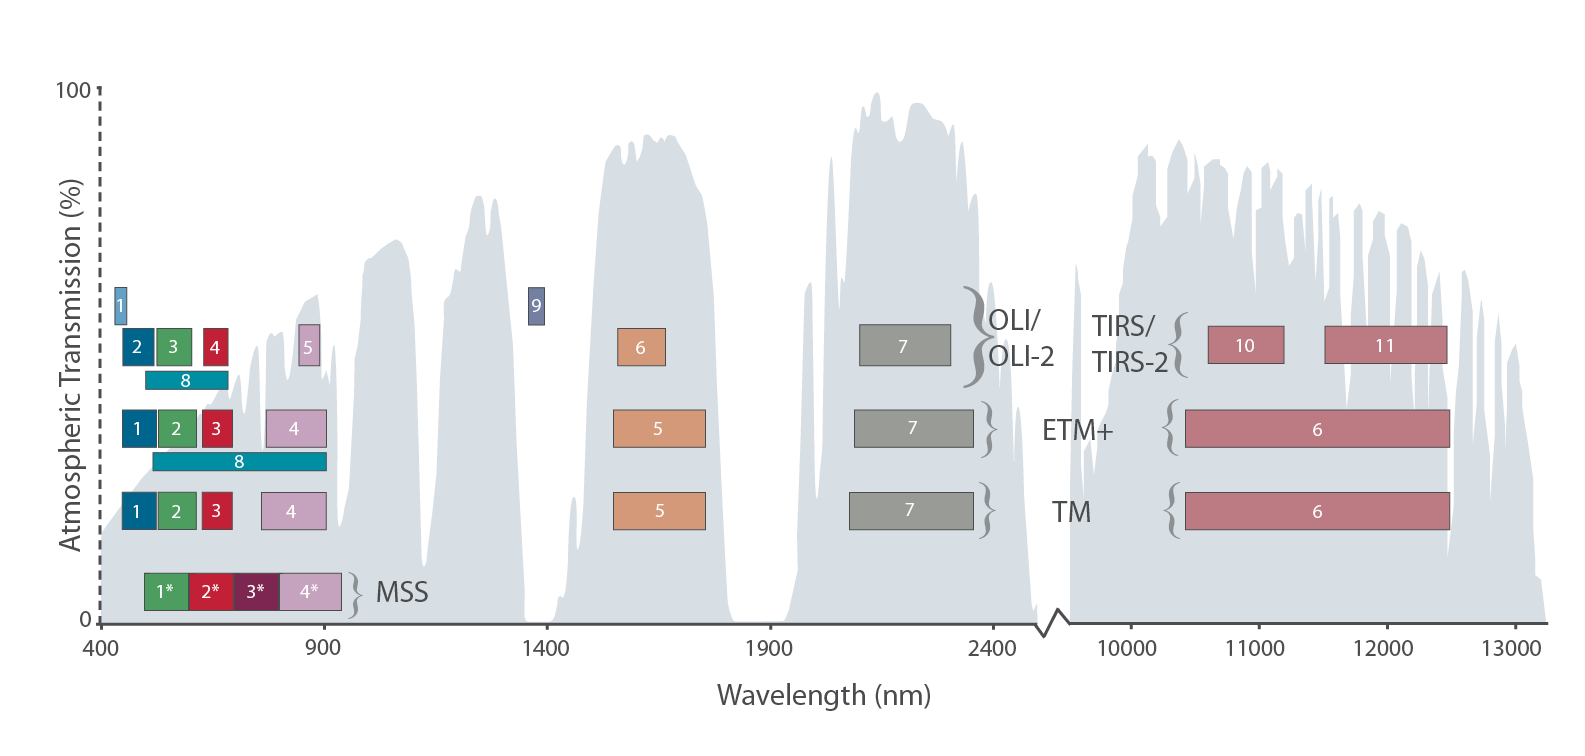
Spectral Bands
| Landsat 1-2 Band | Landsat 3 Band | Landsat 4-5 Band* | Band width (µm) | GSD (m) |
|---|---|---|---|---|
| 4 - Green | 4 - Green | 1 - Green | 0.5-0.6 | 80 |
| 5 - Red | 5 - Red | 2 - Red | 0.6-0.7 | 80 |
| 6 - Near-infrared (NIR) | 6 - Near-infrared (NIR) | 3 - Near-infrared (NIR) | 0.7-0.8 | 80 |
| 7 - Near-infrared (NIR) | 6 - Near-infrared (NIR) | 4 - Near-infrared (NIR) | 0.8-1.1 | 80 |
| N/A | 8 - Thermal-infrared (TIR) | N/A | 10.4-12.6 | 240 |
Related Resources

Virginia Norwood & the Little Scanner that Could
The MSS was the first instrument that allowed scientists to conduct onboard radiometric calibration, enabling reliable comparisons of images from different places on Earth.
This innovation fundamentally transformed remote sensing, establishing the foundation for modern digital image processing techniques and making possible the detailed, pixel-level measurements that enable today's sophisticated space-based studies of Earth's land dynamics.