


![Request for Information – Potential [Placeholder for Prize]](https://assets.science.nasa.gov/dynamicimage/assets/science/psd/solar/2023/09/s/solarsystem_0.jpg?w=1024)


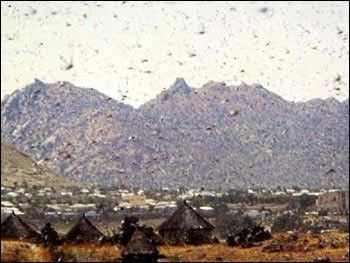
It’s hard not to have at least a grudging respect for the desert locust. It has survived on Earth for millions of years, thriving in the heat and aridity of the world’s most inhospitable deserts. For the most part, the insect known as Schistocerca gregaria goes quietly about its inscrutable insect business, a solitary and inconspicuous brown speck concealed in clumps of widely scattered desert vegetation, subsisting on even the most noxious weeds when necessary.
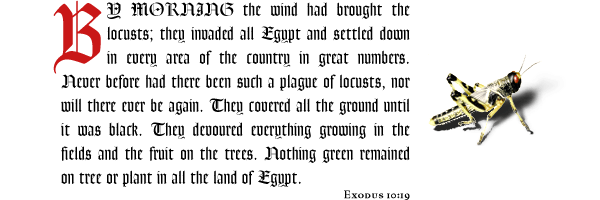
Our admiration can only be carried so far, though, when this seemingly shy and inconspicuous insect reveals its surprising dark side. Throughout recorded human history, and surely long before, locust plagues have periodically poured forth from their arid confines and invaded areas where people live, farm, and graze their livestock. Their impact on human lives has often been so crippling that records of plagues have taken on religious significance and made their way into sacred and historical texts.
The Reach of the Desert Locust
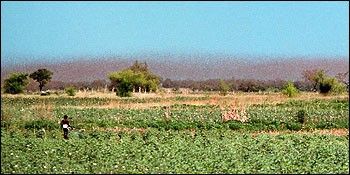
Tens of millions of square kilometers of crops and rangeland in northern Africa, the Middle East, and Asia are within the reach of the desert locust. The livelihood of at least one-tenth of the world’s population can be affected by the small insect with its voracious appetite. A single swarm can cover 1200 square kilometers (460 square miles) and can contain between 40 and 80 million locusts per square kilometer. With each insect capable of eating its own body weight (about 2 grams, or .07 ounces) in vegetation each day, a swarm that size could consume 192 million kilograms of vegetation each day, or more than 423 million pounds. Now consider that in the last century alone, there were seven periods of numerous plagues, the longest of which lasted intermittently for 13 years.
Crop and rangeland damage due to locusts is a great threat to regional and global food security, and efforts have been underway for decades to control the formation of desert locust swarms. Over the years since World War II, the United Nations Food and Agriculture Organization (FAO) has emerged as the leader in the effort to predict, prevent, and control locust plagues. Along the way, they have had help from remote sensing ecologist Jim Tucker at NASA’s Goddard Space Flight Center. In the early 1980s, Tucker’s long-time interest in desert ecology led him to collaborate with FAO scientists on using satellite data to predict where and when locust plagues were likely to break out.
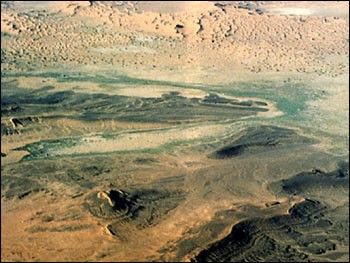
During quiet periods, called recessions, locusts are confined to a 16-million-square-kilometer (6.2-million-square-mile) belt that extends through the Sahara Desert in northern Africa, across the Arabian Peninsula, and into northwest India. But when conditions are right (or perhaps ‘wrong’ would be the better word), swarms invade countries on all sides of the recession area, as far north as Spain and Russia and as far east as India and southwest Asia. As many as 60 countries can be affected. Swarms regularly cross the Red Sea between Africa and the Arabian Peninsula and are even reported to have crossed the Atlantic Ocean from Africa to the Caribbean. Monitoring locust habitat during recessions means monitoring a large, forbidding expanse of arid and semi-arid terrain, often in conflict-ridden, developing countries with little infrastructure or technology.
An Insect’s Alter Ego
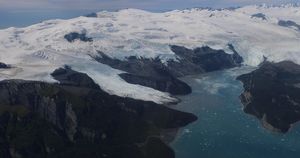
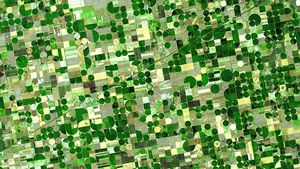
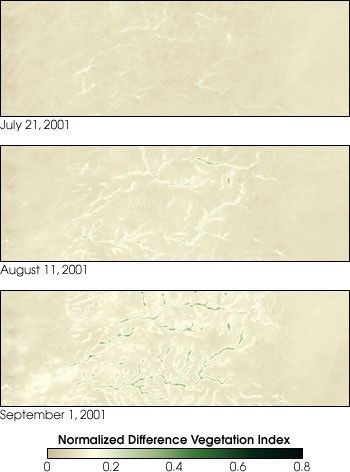
Given the vast area and the less-than-optimal field conditions, satellite sensors provided a good alternative to canvassing this sometimes dangerous terrain on the ground. “Obviously,” says Tucker, “you can’t see locusts from satellites. But swarm development is closely tied to rainfall and green vegetation, which we can detect from space. Detecting a patch of green vegetation on a satellite image where there was previously only bare soil is a straightforward way to monitor the locust habitat,” explains Tucker. “When we see vegetation springing up in the desert, we know where conditions are right for an outbreak, and we can direct ground survey crews to exactly the right spot to investigate.”
Field biologists exploring potential hot spots located by satellites are looking for more than just a large number of locusts. They are also looking for evidence of something akin to a split personality. Says Tucker, “The desert locust has two phases. In one phase, it’s reclusive and solitary, going out of its way to avoid coming into contact with another of its kind and migrating only at night. But the locust also has this sort of alter ego where it undergoes explosive population growth, changes color and shape, and becomes more tolerant of others, more social, or gregarious.”
So what causes harmless desert locusts to break all the bounds of normal social restraint and form a swarming, marauding mob? In a word: water. That most precious of desert resources, rainfall can transform a barren desert landscape with a blush of ephemeral green vegetation. It also moistens the sandy soils where the desert locust lays its eggs. The moisture initiates the hatching of the eggs and causes vegetation to grow. The newly grown vegetation increases the food supply and provides shelter for the newly hatched “hoppers,” as the young, wingless insects are called. At roughly weekly intervals, depending on temperature, the hoppers molt, finally achieving adult, winged status after five cycles.
The default state of the desert locust is to be solitary—to have a strong aversion to others of its kind. But when rains spur egg development and vegetation, the population of locusts grows rapidly. Given enough vegetation and a big enough area, the locusts might be expected to spread out. But when vegetation is distributed on the landscape in such a way that the locusts have to congregate in order to feed or if conditions are so good in a particular area that great numbers of locusts are hatched, the locusts abandon their solitary instincts.
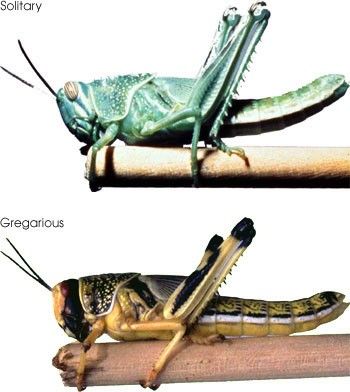
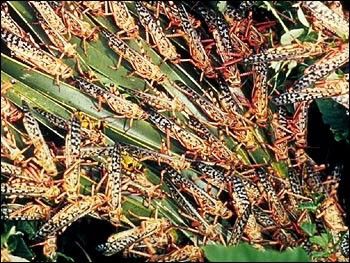
The forced physical contact brought about when numerous locusts descend on a dwindling food supply causes the animals’ hind legs to bump up against one another. This jostling triggers a cascade of metabolic and behavioral changes that signal the insect’s transformation from “go it alone” to “one of the crowd.” They develop a yellow and black warning coloration—most pronounced in the juveniles—that notifies potential predators that they have been munching on poisonous plants. Their bodies become shorter, and they give off a perfume of hormones that causes them all to be attracted to the same location, which enhances swarm formation.
A dramatic increase in a localized population often signals an outbreak, which can die out or persist, depending on the continuation of favorable conditions. When outbreaks persist in the same or nearby area, the event has progressed to an “upsurge.” If the upsurge fails to die out quickly, it can rapidly increase in size, and then a plague, or swarm, is underway. The swarm advances far outside its natural habitat, called the recession area, and migrates en masse, sometimes thousands of kilometers.
The changes in appearance and behavior are so profound that despite humans’ long relationship with the insect, it wasn’t until 1921 that scientists even became aware that the standoffish locust of the recession years was the same species of insect that exploded out of the desert, devouring crops and native vegetation and leaving devastation and famine it its wake.
Finding the Hot Spots
It was with these ideas in mind that Tucker and his colleague Jelle Hielkama, at the FAO in Rome, pioneered a satellite-based approach to monitoring the desert locust habitat in the early 1980s. The approach was based on a common satellite indicator of vegetation called NDVI, for Normalized Difference Vegetation Index. (The article Measuring Vegetation, NDVI & EVI contains a thorough explanation of the remote sensing of vegetation.) Vegetation has two key spectral characteristics: it absorbs light from the red part of the electromagnetic spectrum for photosynthesis, and it reflects electromagnetic energy from the near infrared (IR) part of the spectrum in order to keep itself cool. If the satellite passes over an area that is heavily vegetated, it should receive a reflected signal that is low in red light and high in infrared light. If it passes over bare soil, the amount of red light that is reflected increases significantly.
These relationships are calculated using a simple equation: the amount of red light received by the satellite subtracted from the amount of infrared light, divided by the combined signal received for both wavelengths. Values range from -1 to +1.
NDVI= (IR - red)/ (IR + red)
If the reflected infrared signal is high and red is low, then NDVI will be positive, signaling green vegetation. If no green vegetation is present, the amount of infrared light and red light reflected from the Earth’s surface will be comparable, and the NDVI will be near zero, signaling bare ground.
Among the first things Tucker and Hielkama needed to find out was how much spatial detail they would need in their satellite images to track significant changes in NDVI. With satellite data, there is always a trade off between how much spatial detail is contained in the data, called spatial resolution, and the area that can be seen at one time, called spatial coverage. The greater the resolution, the smaller the spatial coverage, and the more time it takes to obtain information on a big area like the desert locust recession area. In the desert, rainfall is unpredictable, and the impacts can be fleeting. If you had to wait two or three weeks to see the same area twice, you might miss an important change.
“Given the technology available in the 80s—before worldwide digital networks and before everybody had powerful computers for data processing—we knew that to create something operationally useful, it would have to be simple, both conceptually and technically. It also needed to be low-cost,” says Tucker. Since a higher amount of detail leads to bigger data file sizes, the researchers would want to pick the lowest, or coarsest, spatial resolution data they could while still capturing the important information.
At that time, scientists were already using Landsat data to map ecological conditions throughout the world, and on first glance that might have seemed a natural choice. But Tucker knew that to cover the entire recession area using 30-m-resolution data from the Landsat Thematic Mapper would require acquisition of at least 700 separate scenes. At $2800 a scene, that option was well outside practical operating costs. Not to mention, Landsat typically only imaged the exact same area once every 16 days (under favorable, cloud-free conditions), which is not frequently enough to detect the more fleeting changes in desert vegetation. To make the project work, Tucker and Hielkama’s first task was to demonstrate that adequate monitoring could be done with coarser, 1-km-resolution data available from the National Oceanic and Atmospheric Administration’s Advanced Very High Resolution Radiometer (AVHRR).
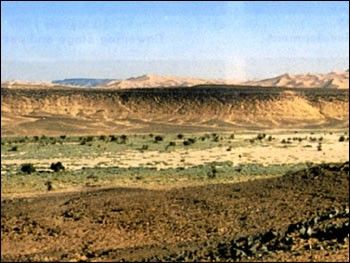
First, they selected numerous test sites throughout desert regions in Mali and Algeria in Africa and the Thar Desert in India and Pakistan that were known to be high-frequency breeding sites for the desert locust. Then they put on their safari hats and took to the desert, collecting ground-based observations of vegetation cover at the sites, some of which were wadis, or water channels. It was these sites that represented the greatest challenge for coarse resolution data. Having vegetation clumped together in a wadi is a perfect way to bring sufficient numbers of locusts close enough together for them to begin rubbing each other the wrong way. Their field work showed that wadis were anywhere from 30 meters to 1000 meters wide (98 to 3281 ft). Would 1 kilometer AVHRR data be sufficient to track changes there, or would it be like looking for a needle in a haystack?
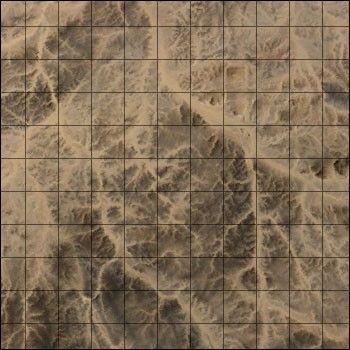
To demonstrate that their idea would work, Tucker and colleagues created a map of the test sites using 30-meter-resolution data from Landsat. With the wadi channels well identified on the satellite imagery and confirmed by field work, the scientists created a grid overlay simulating the data that would come from AVHRR. The map revealed that although in many cases the green vegetation took up so little of an AVHRR-sized grid box (or pixel of data) that it might be missed by the sensor, a sufficient number of grid boxes were at least 40 percent filled with vegetation, which would be enough to detect significant change in the amount of vegetation in the desert locust habitat.
“There was opposition initially to the use of coarse resolution data. The important point we were trying to make was that with the frequent satellite coverage of the area, there was a lot of remotely sensed information over time. It matters less if conditions are changing at lower resolution, and more that conditions are changing over time.” Tucker showed that if they used high-resolution data initially to map out the terrain and locate wadis or other small patches of vegetation, then they could recognize the changes in vegetation that appear over time in the coarse resolution data, even if they were somewhat subtle.
Signs of Good Breeding
Now that they had proven that coarse-resolution data could be used for routine monitoring, the next step was to streamline the process even further to make it useful to ground survey crews and resource managers in remote and low-tech sites. Hielkama decided to come up with a way to combine the daily NDVI values in any given area into a single locust indicator.
“In the beginning,” says Tucker, “we were processing the data here at Goddard every ten days. Because there was no digital network, we created the vegetation maps here and took photos of them. Then I got in my car and drove into downtown D.C. to the FAO office where the photos would go into the FAO diplomatic pouch to be transmitted overnight to Rome and FAO. This went on for almost seven years.” The results would be interpreted by Tucker’s colleagues in Rome, who sent the information out via teletype machines. They needed to simplify the information as much as possible.
One approach to combining NDVI data is simply to average all the NDVI values within a certain area. The trouble with that is that when the changes you are looking for occur on a small scale, such as in a narrow wadi surrounded by desert, averaging might cause your vegetation to “disappear.” Instead, Hielkama developed what he called the Potential Breeding Activity Factor. This breeding factor considered the NDVI value of each pixel in a given area and placed it into one of four categories from high NDVI to low. Then he created a weighted score for all the pixels in the area by multiplying the total number of pixels in each category by a different number. The highest NDVI category was multiplied by 1000, the next by 100, the next by 10, and the lowest category by 1. All these scores were added up and divided by the total number of pixels in the area. By assigning progressively more importance to areas with higher amounts of vegetation (higher NDVI), the calculation produced a measure of how likely a particular area was to become a hot spot for plague formation. The key advantage was that it reduced the volume of data that needed to be transmitted operationally.
To demonstrate that their streamlined approach worked, the researchers applied their remote-sensing techniques to a retrospective analysis of a locust plague that had occurred in West Africa between 1980 and 1981. Using even coarser, 4-km-resolution data from the NOAA-6 AVHRR instrument, they calculated the potential breeding factor for numerous areas in the southern Sahara Desert in West Africa where locust upsurges were known to have begun.
Comparing their results to rainfall observations and ground surveys of locust populations conducted during the upsurge, the scientists found that not only did the breeding factor calculated using the coarse-resolution data correlate with the documented field locations of upsurge populations, but they also discovered that the initial upsurge was quite likely localized to a small area. Controlling the upsurge in this 600-square-kilometer (230-square-mile) area with spraying would likely have been very successful at preventing a plague that lasted several months and ultimately affected 600,000 square kilometers (230,000 square miles)!
Locust Recon Today
Since the early 1980s, the collaboration between Goddard and the FAO has continued. Satellite data combined with weather information, aerial surveys, and ground truth information have been used operationally by the FAO’s Global Information and Early Warning System and more recently by the Desert Locust Information Service, operated by the FAO Plant Protection Service. The Desert Locust Information Service provides the data on their web site and uses them in creating their weekly bulletins on the latest locust situation in the desert locust recession area. Over the 20 years since the project was first initiated, the collaborators have made use of routine data from several generations of satellites: the Landsat series, the AVHRR series, France’s SPOT satellites, and the Sea-viewing Wide Field-of-View Sensor (SeaWiFS). In 1999, the FAO signed an agreement with NASA headquarters to receive data from the Moderate Resolution Imaging Spectroradiometer (MODIS) flying aboard NASA’s Terra satellite as part of its ongoing environmental monitoring in the desert locust recession area.
Says Tucker, “Remote sensing of vegetation in the desert locust habitat is now the fundamental reconnaissance source for monitoring and predicting upsurges and swarms.” Given that most control methods involve chemical pesticides, identifying potential outbreaks early in development decreases the volume of pesticides required and minimizes collateral environmental contamination. The near-daily coverage provided by the most recent generation of satellite sensors, including MODIS, should be advantageous considering that a benign, solitary-phase desert locust can switch to the swarm-forming gregarious phase with as little as four hours of “rubbing elbows” with its neighbors. Getting these locust-fighting tools into the hands of the people who need them still presents some challenges in the face of civil unrest throughout the desert locust recession area, but Tucker is confident in the ability of satellite data to prevent future devastation. “With modern remote sensing capabilities and today’s advanced communication networks,” he says, “desert locust plagues should be a thing of past.”
Selected References
- Tucker, C.J., Hielkema, J.U., and Roffey, J. (1985). The potential of satellite remote sensing of ecological conditions for desert locust survey and forecasting. International Journal of Remote Sensing, 6:127-138.
- Hielkama, J.U., Roffey, J., Tucker, C.J. (1986). Assessment of ecological conditions associated with the 1980/81 desert locust plague upsurge in West Africa using environmental satellite data. International Journal of Remote Sensing, 7 (11): 1609-1622.
- Sword, G.A., Simpson, S.J., 1,.El Hadi, O.T.M., and Wilps, H. (2002) Density dependent aposematism in the desert locust. Proceedings of the Royal Society of London B, 267:63-68.
- United Nations Food and Agriculture Organization Locusts and Migratory Pests Group Web Site. Accessed online August 2002.
- Britain’s Biotechnology and Biological Science Research Council. One of the crowd: The amazing biology of the desert locust. Accessed online August 2002.
NASA Earth Observatory story by Rebecca Lindsey; design by Robert Simmon