


![Request for Information – Potential [Placeholder for Prize]](https://assets.science.nasa.gov/dynamicimage/assets/science/psd/solar/2023/09/s/solarsystem_0.jpg?w=1024)


As a part of the European Union's ongoing research project entitledLIFECO (Linking hydrographic Frontal activity to ECOsystem dynamics),scientists are using real-time imagery from the Sea-viewing WideField-of-view Sensor (SeaWiFS) to monitor the development of the springphytoplankton bloom in the North Sea and Skagerrak. These data are usedto in conjunction with ship-based measurements of the annual bloom.
In the course of monitoring the spring bloom of diatoms in the region,scientists detected a second, harmful algal bloom (called Chattonella)off the southern coast of Norway on March 19, 2001. This harmful algalbloom appears to have been carried by currents westward from the Swedishcoast of the Kattegat to the Norwegian coast where it has already killedmore than 1,000 tons of salmon in fish farms during the past week.Norway is the world's top producer of Atlantic salmon, yielding about400,000 tons per year.
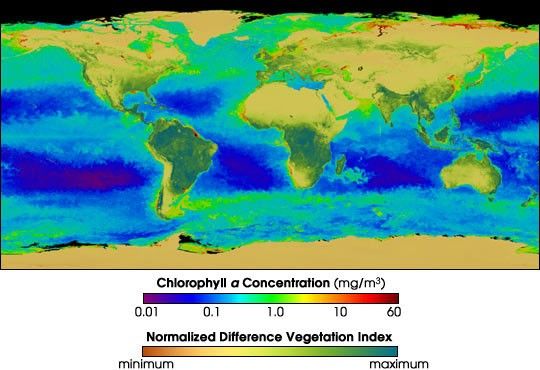
SeaWiFS, which flies aboard the OrbView-2 satellite, precisely measuresocean color (even variations of color so slight our eyes cannot perceivethe difference), which enables scientist to accurately estimate theconcentrations of sediments, organic materials, or even phytoplankton atthe surface. In the latter case, to be more precise, SeaWiFS measuresthe concentration of chlorophyll-a, the green pigment found inphytoplankton.
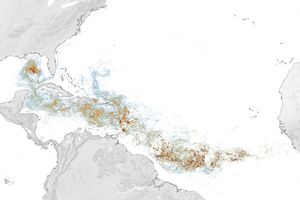
In the false-color image above, red pixels represent the areas with thegreatest concentrations of chlorophyll-a (more than 10 milligrams percubic meter), yellows show high concentrations (about 3 mg/m3), greensand turquoise pixels show intermediate values (0.3 to 1 mg/m3), andblues and purples show where there is little or no abundance ofchlorophyll-a. Note the very high values along the southern coasts ofSweden and Norway, extending westward into the North Sea.
It should also be noted that while SeaWiFS can accurately measurechlorophyll-a concentrations, it cannot yet be used to distinguish between species ofphytoplankton. So, without the aid of surface-based measurements, it isnot possible to pinpoint which parts of the bloom in this image are theharmful algal bloom and which are the benign bloom of diatoms.
References & Resources
Image provided by the SeaWiFS Project, NASA/Goddard Space Flight Center, and ORBIMAGE. Note: All SeaWiFS images and data presented or referred to in this email message are for research and educational use only. All commercial use of SeaWiFS data must be coordinated with ORBIMAGE.