


September 2, 1973-August 20, 2022
A Half-Century of Loss in Northwest Greenland
A pair of satellite images acquired almost 50 years apart reveals striking changes to the glaciers and ice caps in northwest Greenland. Few other satellite comparisons span this much time, especially in such vivid lifelike color.
Observations of Earth from space are now common. But prior to the 1970s, no Earth-observing satellites had been launched with the specific intent of monitoring our planet’s land areas. That changed with the launch of Landsat 1 in 1972. The Landsat mission continues onward through today, with the launch of Landsat 9 in September 2021.
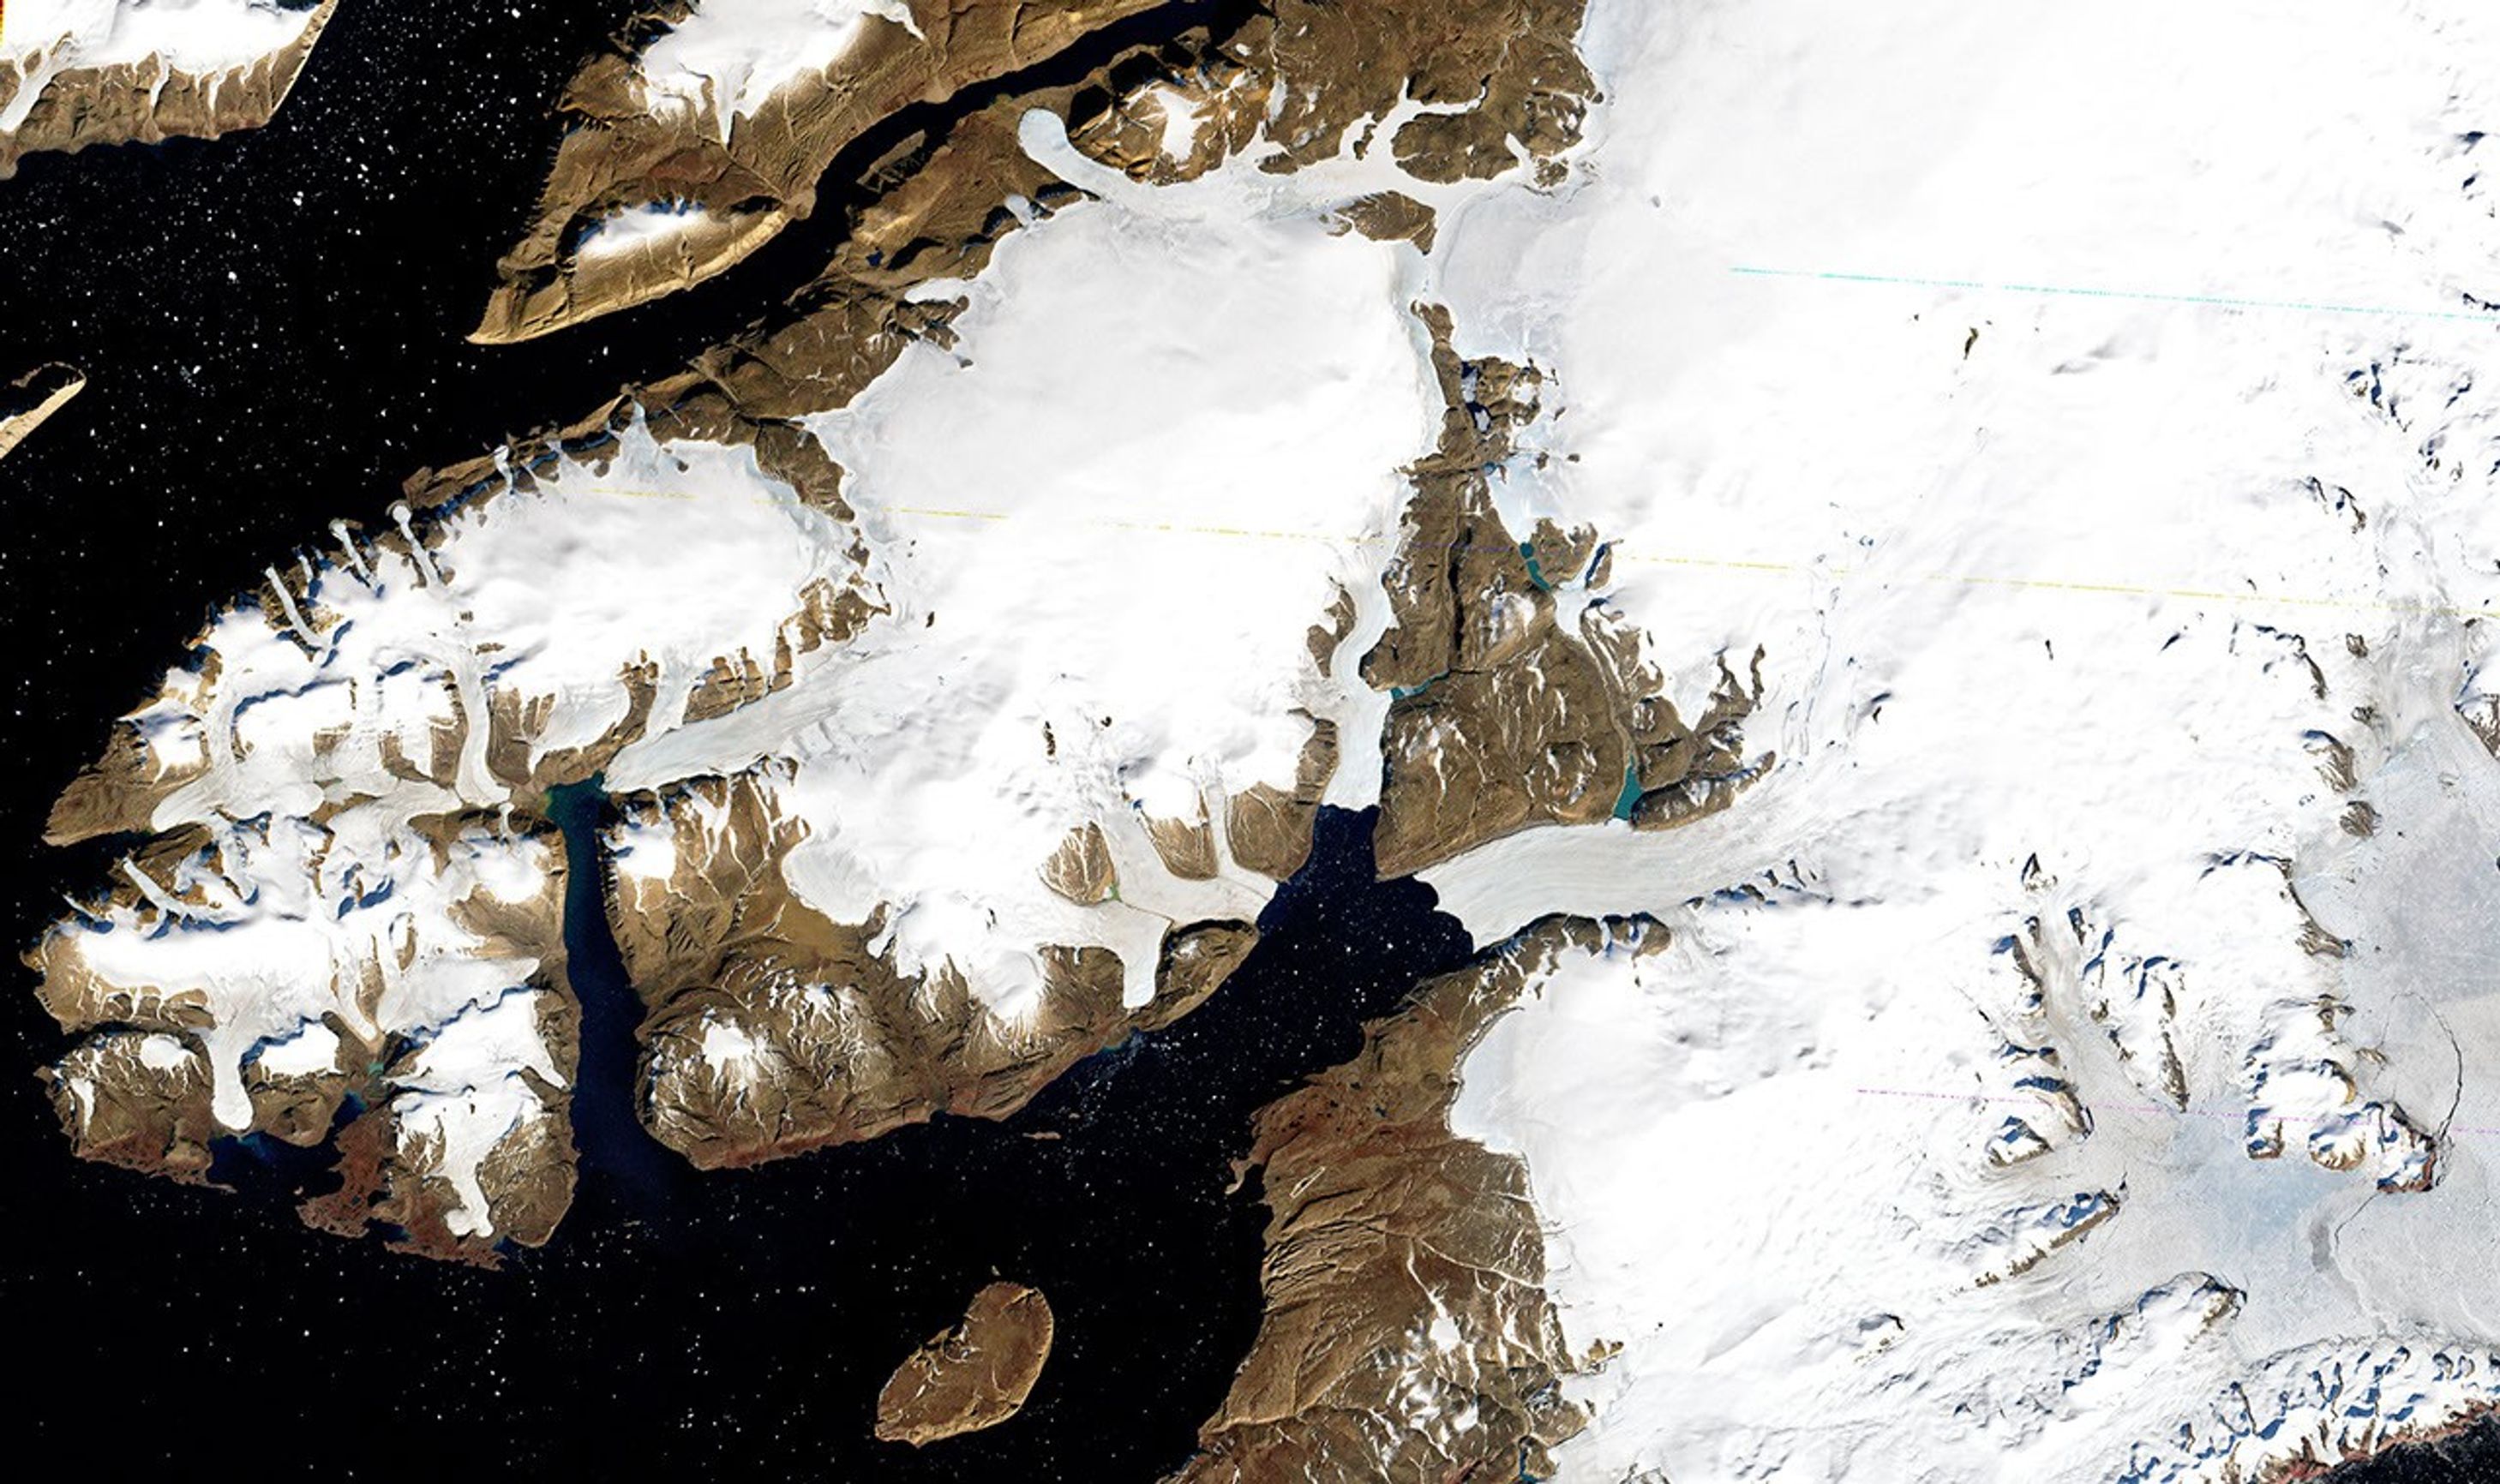
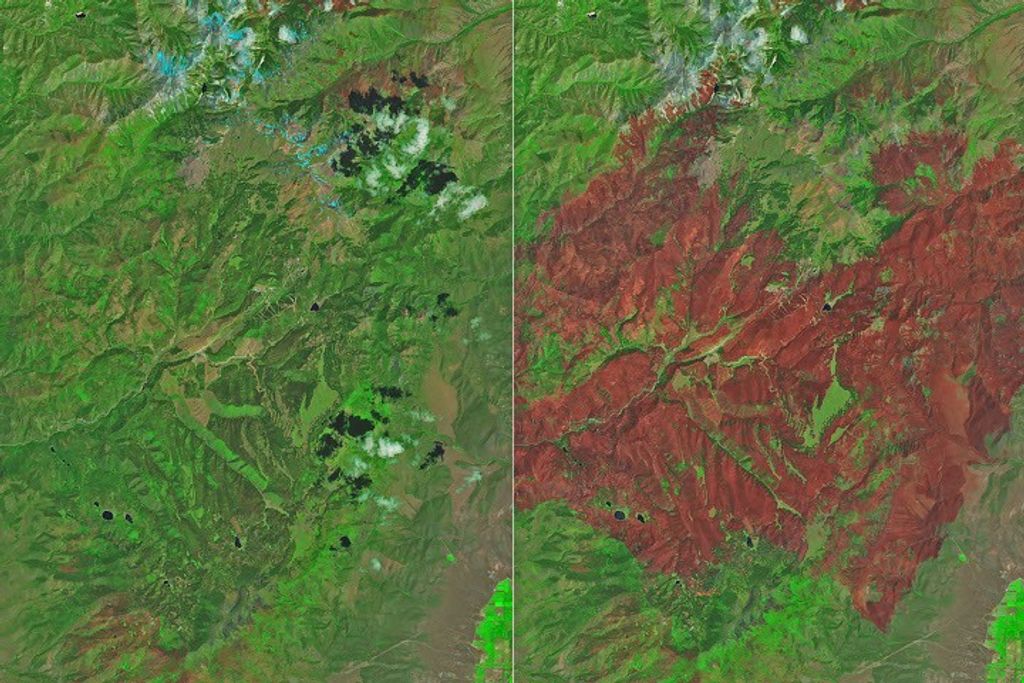
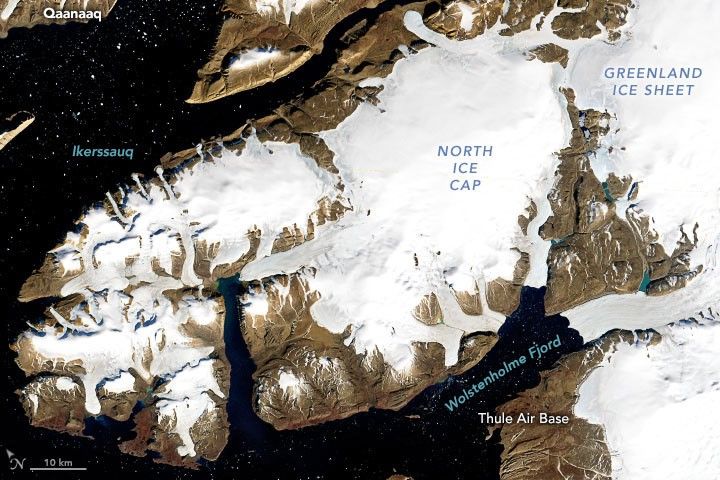
This image pair spans the Landsat era so far, revealing changes across a peninsula north of Thule Air Base (Pituffik). The Multispectral Scanner System (MSS) on Landsat 1 acquired the first image (left) on September 3, 1973. The second image (right), acquired on August 20, 2022, by the Operational Land Imager (OLI) on Landsat 8, shows the same area 49 years later.
The 1973 image resembles natural color, but it is actually false color (MSS bands 6-5-4). This becomes apparent along some of the ice-free areas where vegetation shows up as red. But with very little vegetation in northwest Greenland, the false-color Landsat 1 image appears similar in color to the natural-color Landsat 8 image (OLI bands 4-3-2). Bare land is brown, and snow and ice are white.
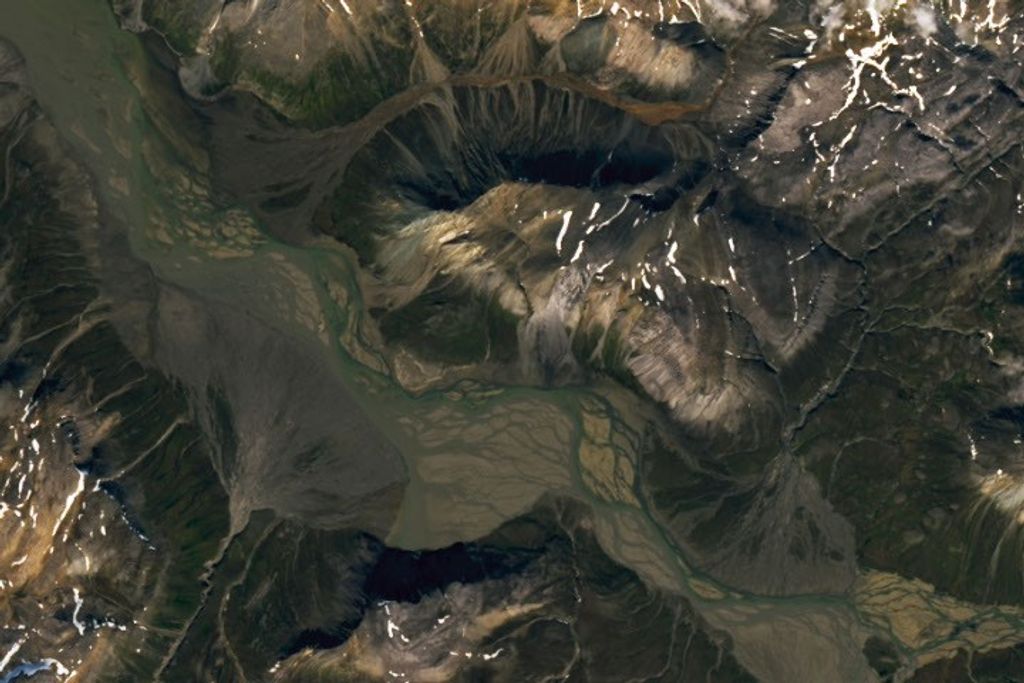
The similarity in color makes it easy to see where glacial ice has retreated, narrowed, and in one case surged. Notice the clear retreat of the large glaciers flowing into the water of Wolstenholme Fjord. Isolated ice caps and smaller glaciers throughout the image all generally shrink, and in some places disconnect from each other. In contrast, the large glacier flowing west from North Ice Cap (Nunatarssuaq Ice Cap) appears to lengthen. Such surging behavior might be caused by ice at higher elevations of the ice cap draining into the glacier.
The images were acquired just two weeks apart in their respective years. Notice that in 2022, the edges of the ice caps and glaciers generally appear much grayer than in 1973. A warm summer in 2022 melted away more of the bright-white snow cover exposing darker, dirtier ice. Fresh snowfall might also be present in the 1973 image, although September is early in the accumulation season, which largely runs from September until May.
Inspired by recent research on changes to Greenland’s peripheral glaciers, Christopher Shuman searched Landsat data records and identified this image pair. “Because this is such a cold, northern area, I figured that the losses over time would be relatively slow, so we needed almost 50 years to show the change,” said Shuman, a glaciologist at University of Maryland, Baltimore County, based at NASA’s Goddard Space Flight Center.
The research showed that peripheral glaciers, which are relatively small and disconnected from the main ice sheet, account for a small proportion of Greenland’s ice-covered area (about 4 percent). But peripheral glaciers account for 11 percent of the island’s ice loss, which makes them outsized contributors to current sea level rise.
Peripheral glaciers in northwest Greenland have been losing about 3.5 to 7 gigatons (4 billion to 8 billion U.S. tons) of ice per year in recent decades amid accelerated warming, according to the research. That’s more than the peripheral glaciers in southeast and southwest Greenland are losing, but less than in north Greenland, where peripheral glaciers have been losing as much as 26 gigatons (29 billion U.S. tons) per year since the early 2000s.
References & Resources
- AGU Press Releases (2022, June 16) Melting Accelerates for Thousands of Greenlandâs Northern Glaciers. Accessed August 29, 2022.
- Khan, S. A. et al. (2022) Accelerating Ice Loss From Peripheral Glaciers in North Greenland. Geophysical Research Letters, 48 (12), e2022GL098915.
- NASA (2022, July 22) Landsat Legacy: NASA-USGS Program Observing Earth from Space Turns 50. Accessed August 29, 2022.
- U.S. Geological Survey (2022, July 22) Fifty Years of Landsat: Observing Earth to Look Forward. Accessed August 29, 2022.
NASA Earth Observatory images by Joshua Stevens , using Landsat data from the U.S. Geological Survey . Story by Kathryn Hansen .