


Peruvian fisherman named El Niño (Spanish for “the boy child”) after the Christ child because the climate phenomenon usually shows up around Christmastime. But its counterpart, La Niña, is the gift giver, bringing cold, nutrient-rich water to the equatorial Pacific off South America. Those nutrients are a boon to marine life, supporting a larger fish population and increasing the fishermen's catch. Fishermen might expect a good year ahead, as a strong La Niña is now dominating the Pacific Ocean.
“This is one of the strongest La Niña events in the past half century, and will likely persist into the northern hemisphere summer, says Bill Patzert, an oceanographer and climatologist at NASA’s Jet Propulsion Laboratory. “Climatic impacts include heavy rains and flooding, which has damaged crops and flooded mines in Australia and Asia. It also has resulted in flooding in northern South America and drought conditions in Argentina. This powerful little lady is spreading her curses and blessings across the planet. She’s the real deal.”
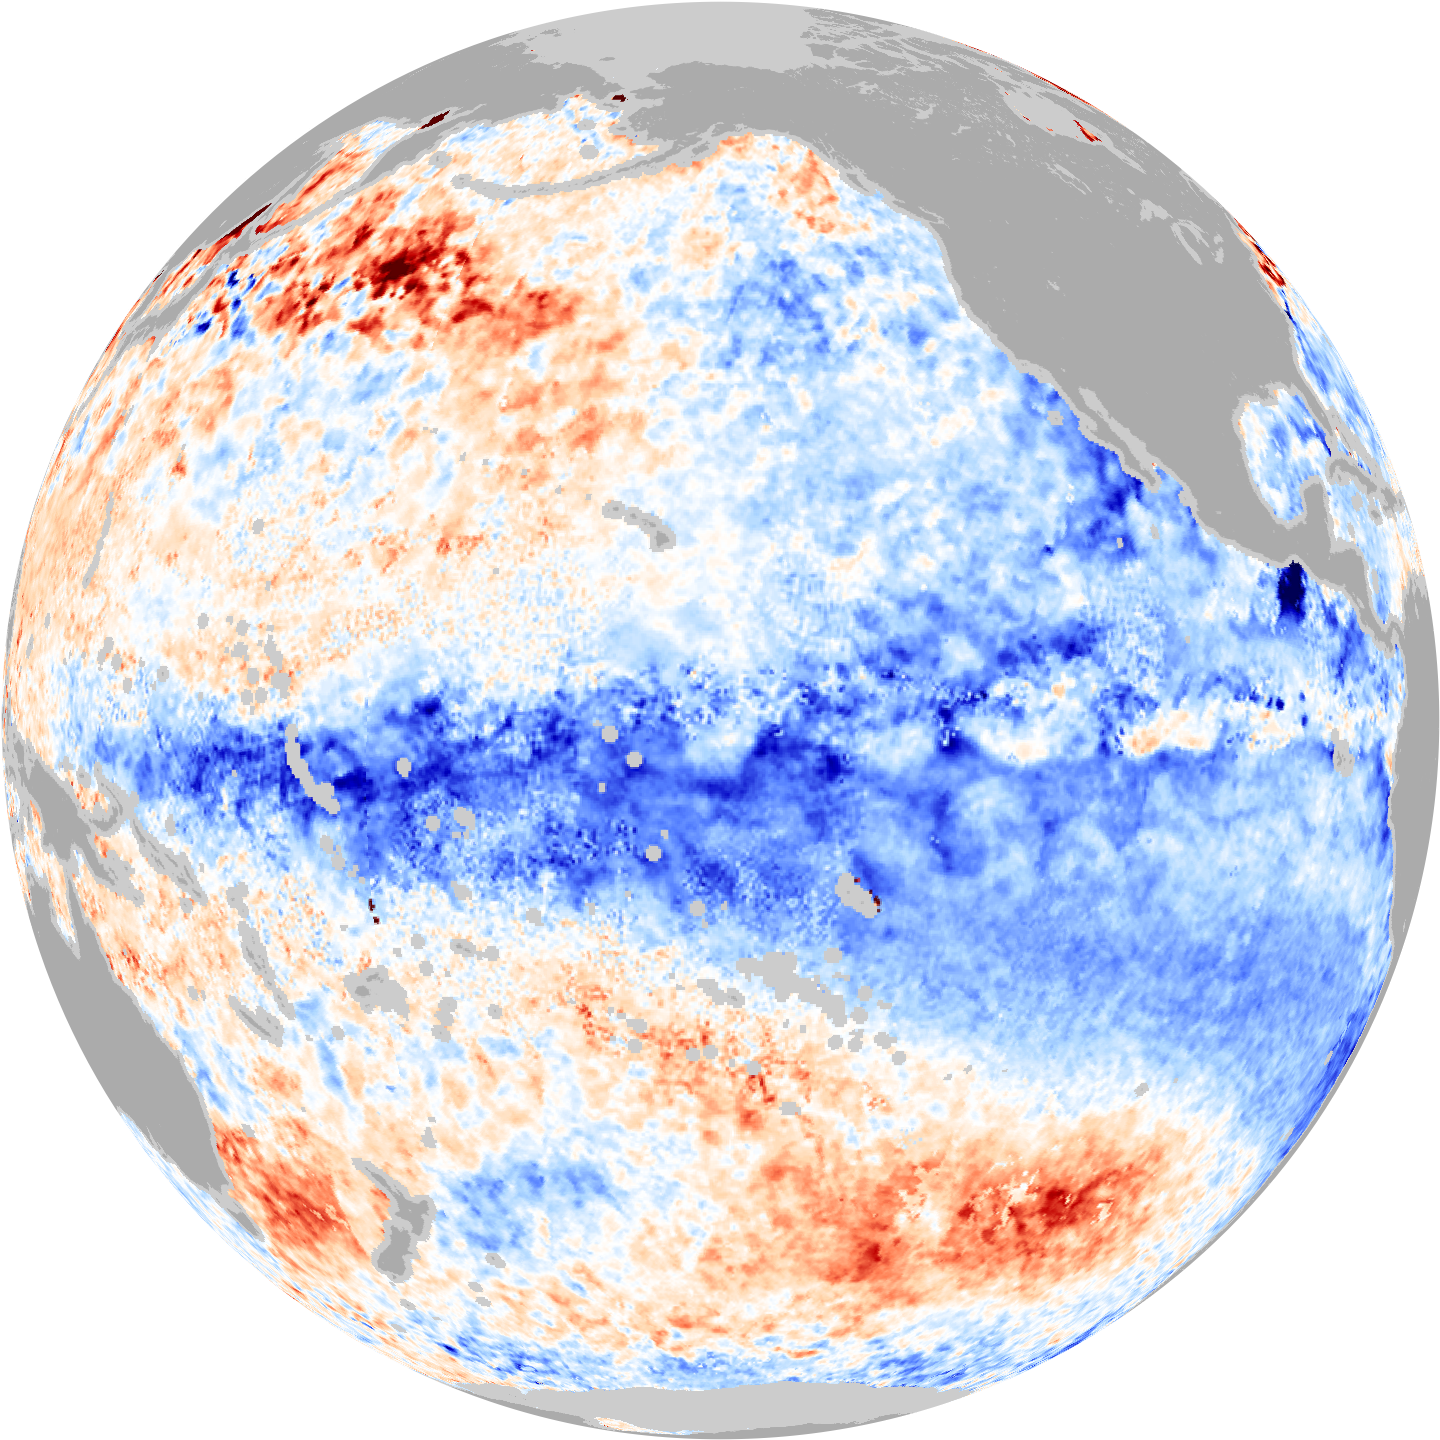
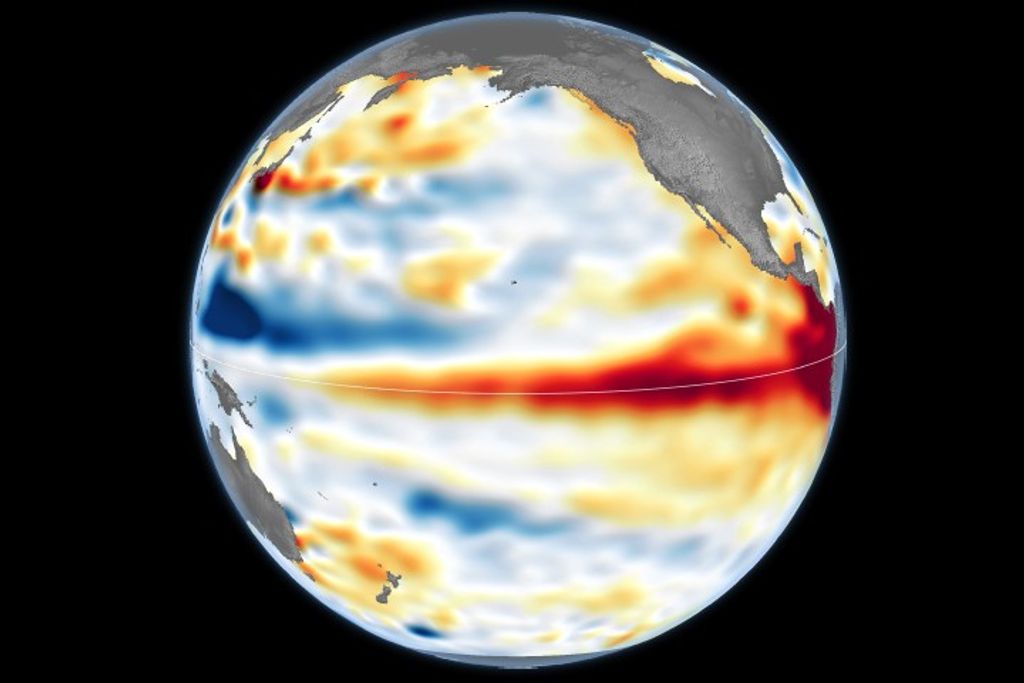
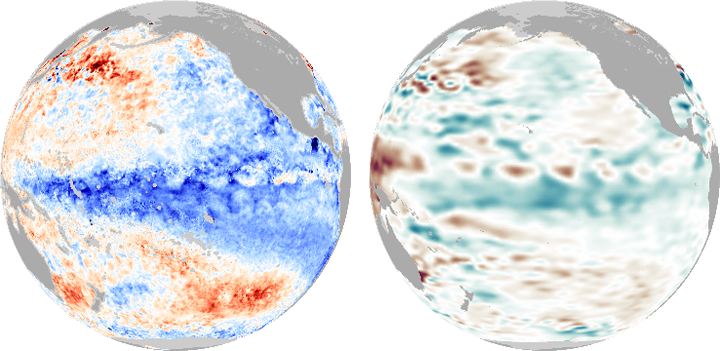
La Niña’s cold water signal is strong in the top two images. The left image shows ocean surface temperatures on December 15, 2010, as measured by the Advanced Microwave Scanning Radiometer for EOS (AMSR-E) on NASA’s Aqua satellite. In December 2010, sea surface temperatures were colder than average across the equatorial Pacific.
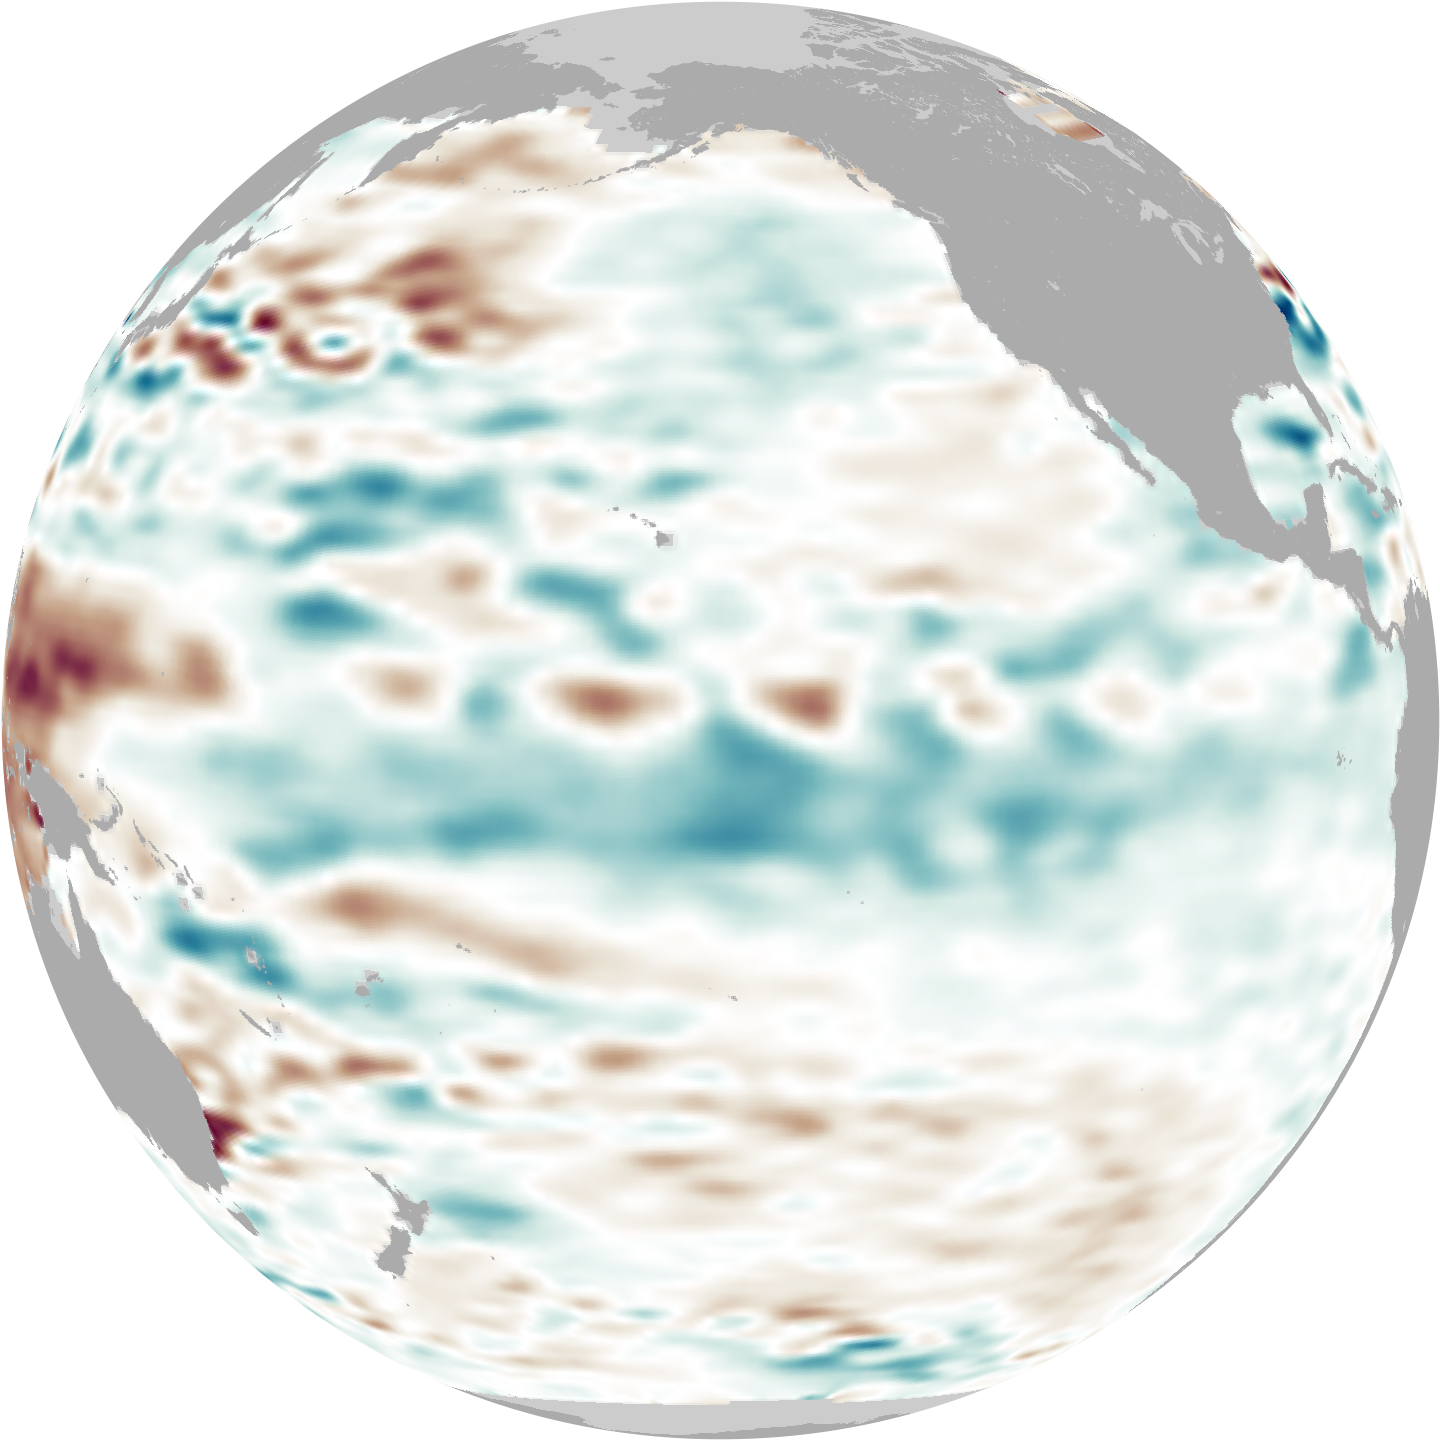
The right image depicts the heat content of the ocean surface between December 14 and 16, 2010, as observed by the U.S.-French Ocean Surface Topography Mission (OSTM)/Jason-2 satellite. Water expands as it warms, so warmer water has a higher surface elevation than cooler water. The blue valley streaking across the middle of the sea surface height image is the signature of La Niña. The intensity of the cold water and the depth and extent of the valley point to an intense event.
Like El Niño, La Niña comes from changes in both the ocean and the atmosphere. High pressure usually dominates the atmosphere over the eastern Pacific, while low pressure tends to reign in the west. The pressure difference creates the trade winds, which blow surface water across the equatorial Pacific to a pool of warm water in the west. Cooler deep water wells up to replace the surface water. During La Niña events, the pressure difference and the resulting trade winds are stronger. The more intense winds push more water west, where it builds up north of Australia. Meanwhile, more cold water wells up in the central and eastern Pacific.
La Niña occurs only when both the ocean and the atmosphere change together, and in 2010, they have, says oceanographer David Adamec of NASA’s Goddard Space Flight Center. The unusual ocean temperatures and imbalance in air pressures alter weather patterns across the world.
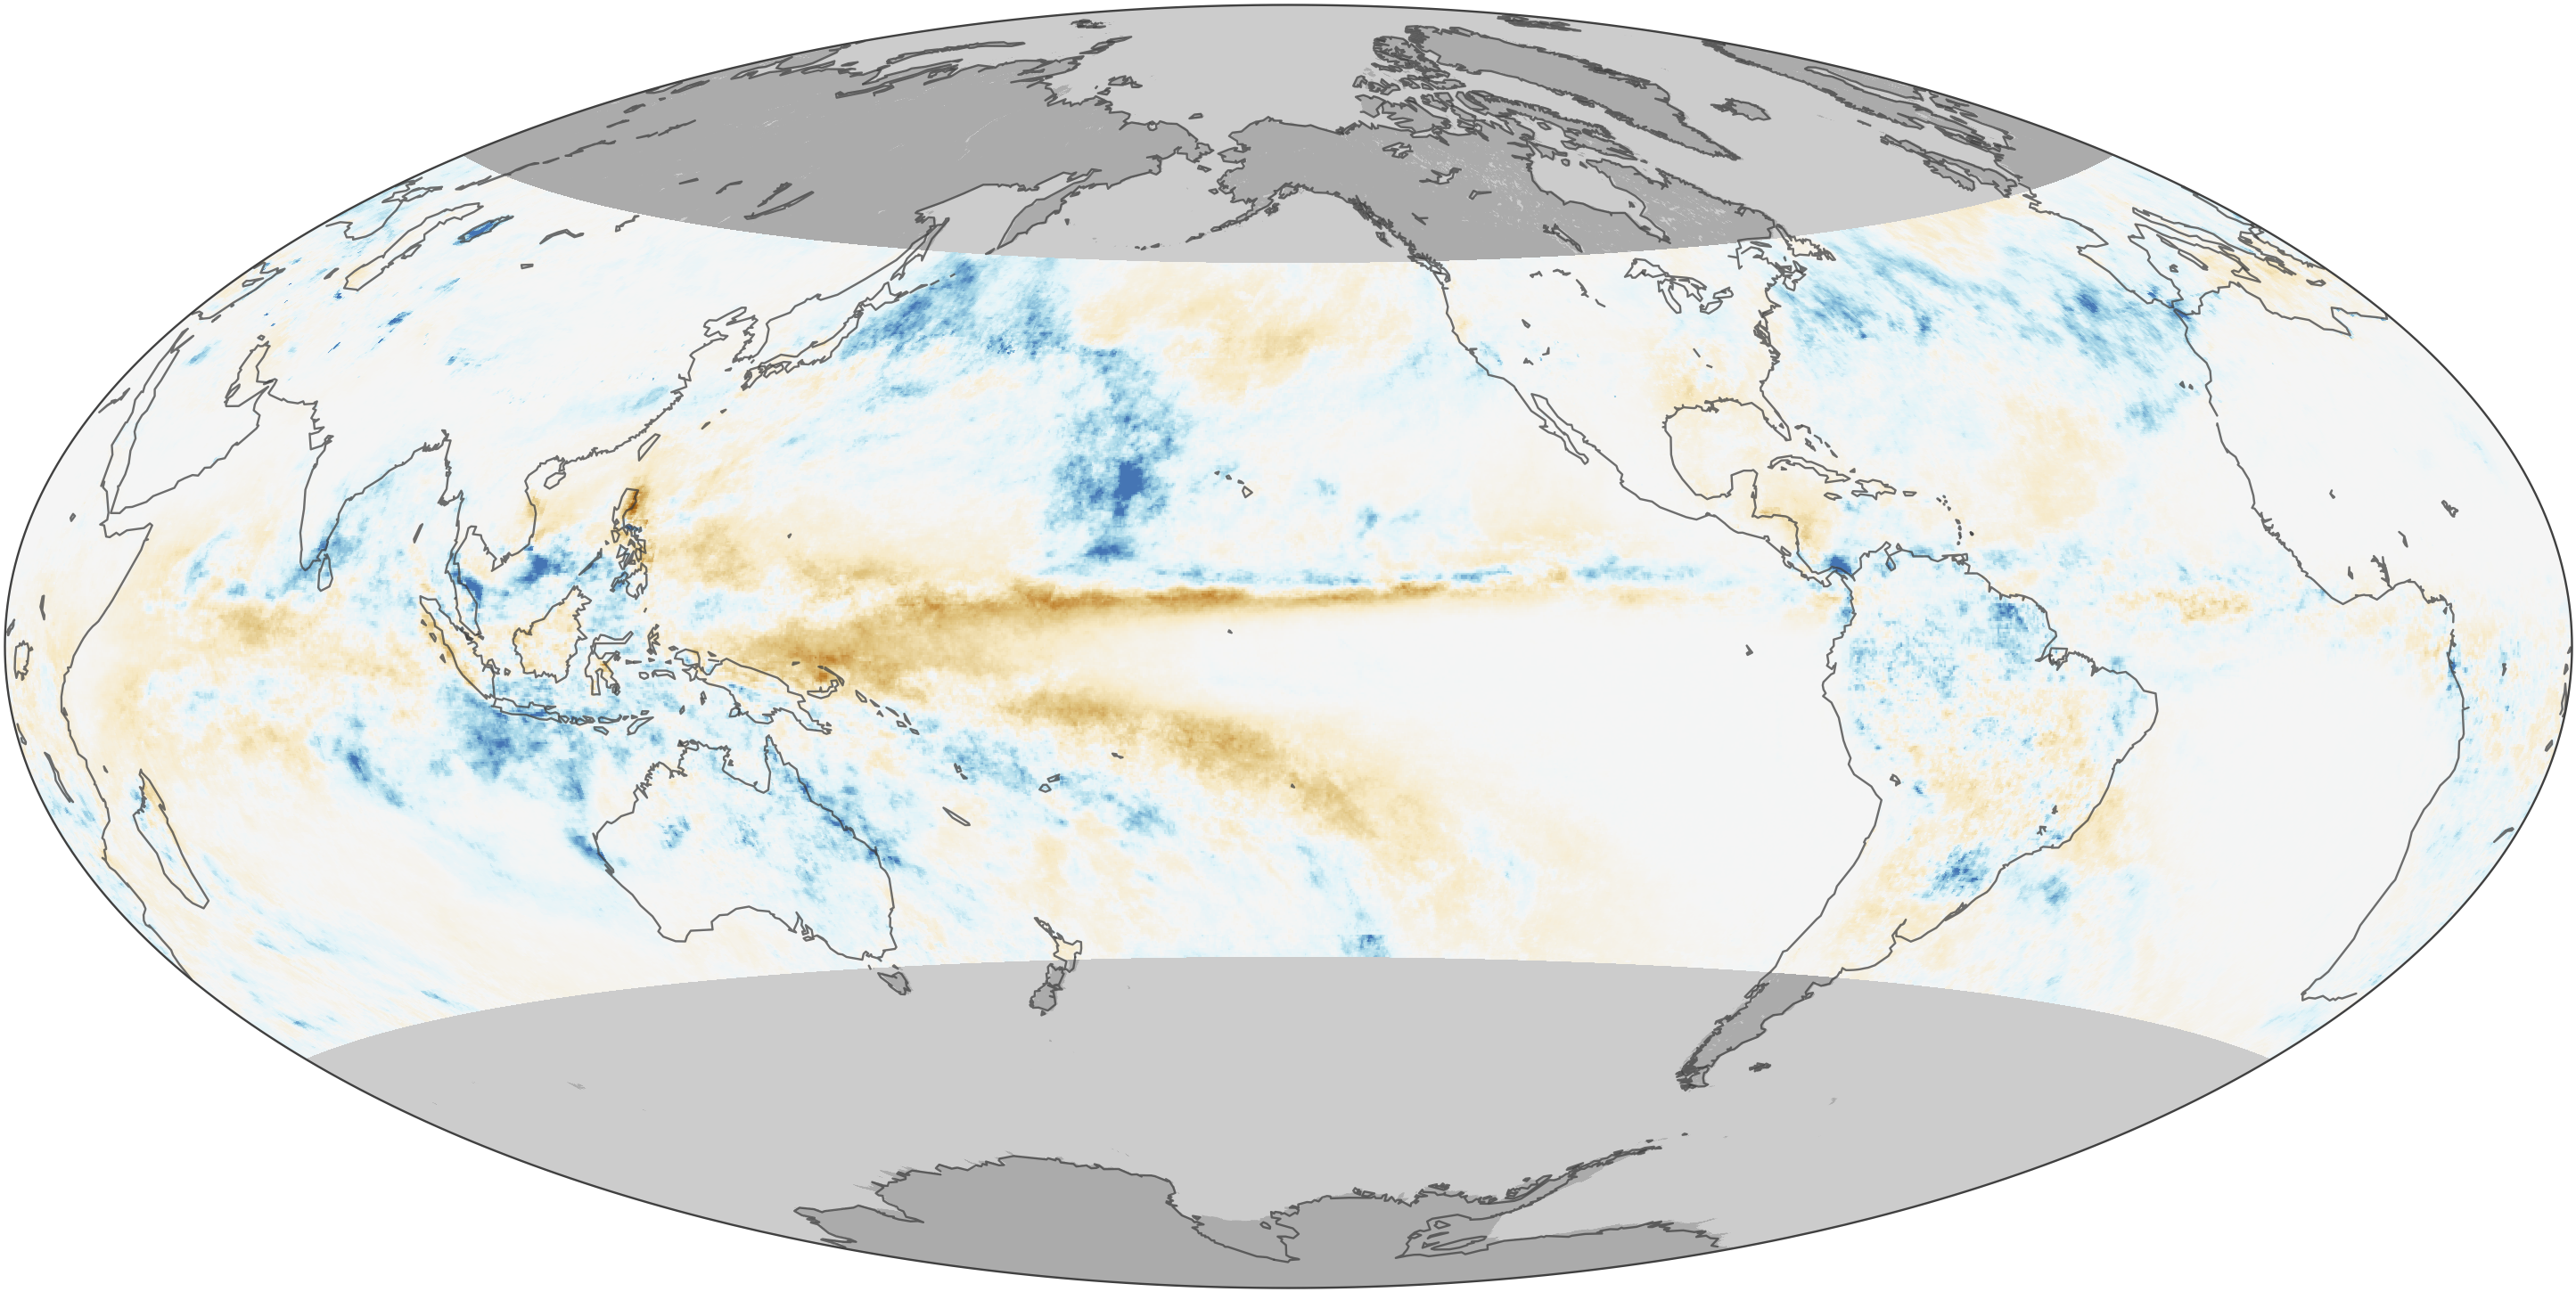
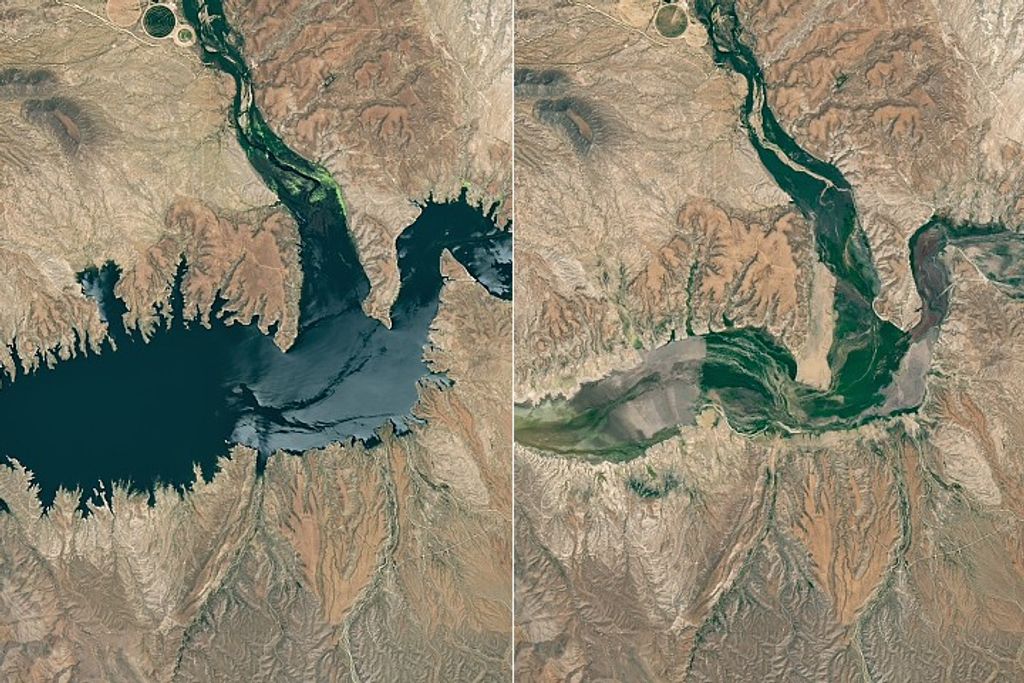
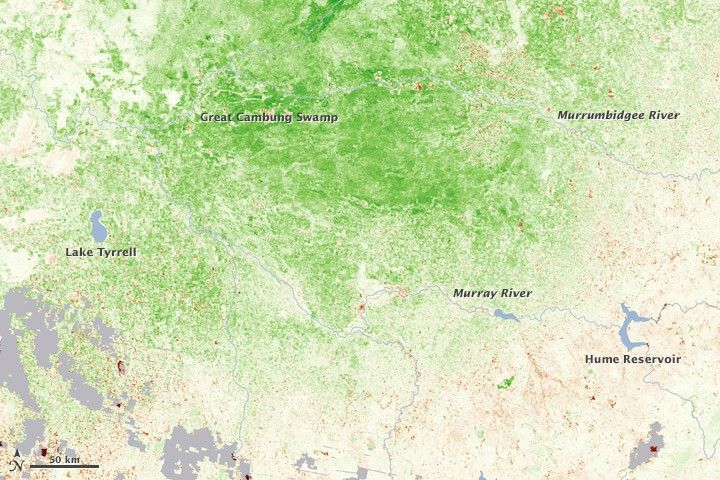
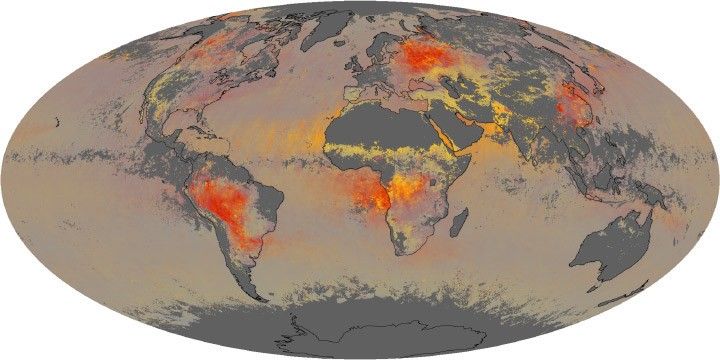
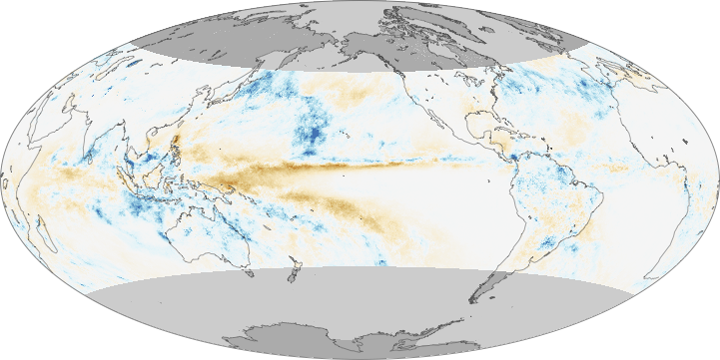
The lower image shows some of the unusual weather La Niña brought in December 2010, as observed by the Tropical Rainfall Measuring Mission (TRMM) between November 23 and December 23, 2010. The image shows rainfall totals compared to average rainfall for the period, with above-average rain in blue and less-than-average rainfall in brown.
“Weather effects are strong in the western Pacific,” says Adamec. “Australia is flooding in many areas.” La Niña rainfall patterns are also evident in the stark horseshoe-shaped region of unusually dry weather in the central Pacific.
La Niña typically affects weather patterns in North America beginning in January. “For ‘normal’ effects in the U.S., look for cold in the Upper Plains, dry and warm weather in California, dry weather in the southeast, especially Florida, and unusually soggy weather in the Northwest,“ says Adamec.
Because such a wide swath of the Pacific is cold, La Niña tends to keep a lid on global temperatures. 2010, however, was still shaping up to be the hottest year on record in spite of La Niña, according to scientists from NASA Goddard Institute for Space Studies.
References & Resources
- Climate Prediction Center/NCEP. (2010, December 20). ENSO cycle: Recent evolution, current status and predictions. National Oceanic and Atmospheric Administration.
- Hansen, J., Ruedy, R. Sato, M., and Lo, K. (2010, December 13). 2010—Global temperature and Europe’s frigid air. NASA Goddard Institute for Space Studies. Accessed December 23, 2010.
- NASA Earth Observatory. (n.d.) La Niña. Accessed December 21, 2010.
NASA Earth Observatory images created by Jesse Allen, using JASON-2 data provided courtesy of Akiko Hayashi (NASA/JPL), AMSR-E data processed and provided by Chelle Gentemann and Frank Wentz, Remote Sensing Systems, and near-real-time data rainfall data provided courtesy of TRMM Science Data and Information System at Goddard Space Flight Center. Caption by Holli Riebeek.