


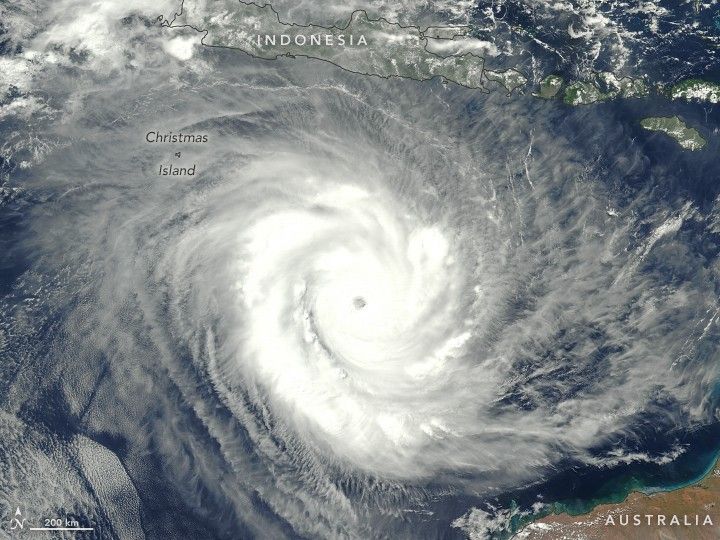
It is the first category 5 cyclone of 2018 and the strongest to hit Darwin, Australia, since 1974. But so far, Cyclone Marcus has directed most of its fury into the Indian Ocean, rather than onto landmasses.
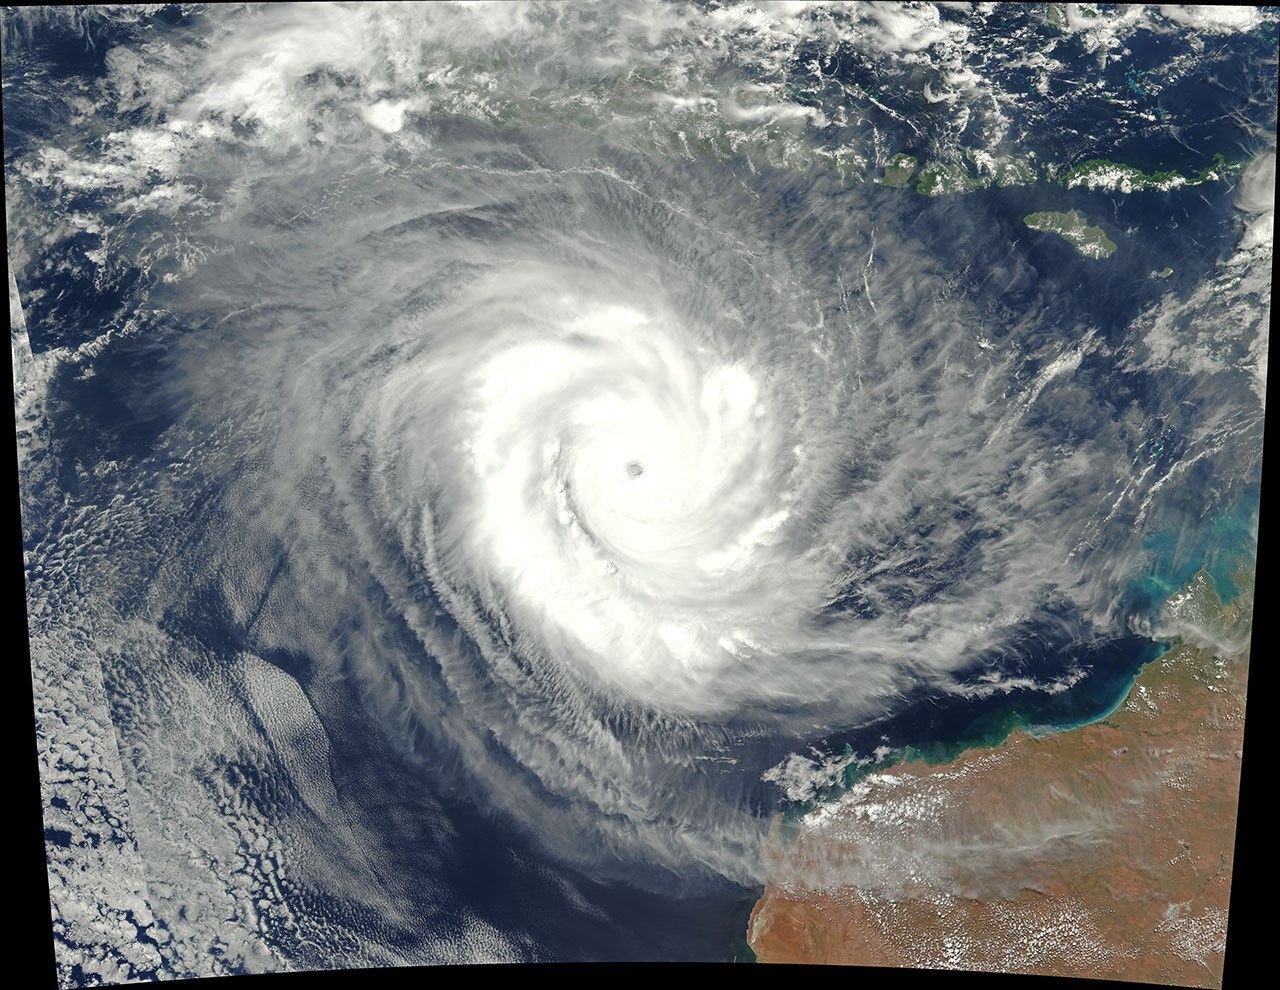
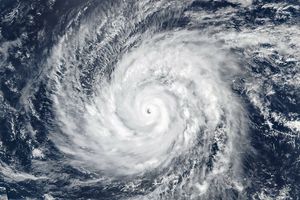
At 2 p.m. local time (06:00 Universal Time) on March 21, 2018, the Visible Infrared Imaging Radiometer Suite (VIIRS) on the Joint Polar Satellite System–1 (JPSS-1) satellite acquired a natural-color image (top) of Cyclone Marcus off the northwest coast of Australia. At the time, the storm had sustained winds of 125 knots (145 miles/230 kilometers per hour) according to estimates from the U.S. Joint Typhoon Warning Center. It was a category 5 storm on the Australian cyclone scale.
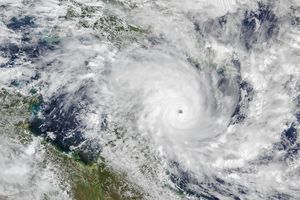
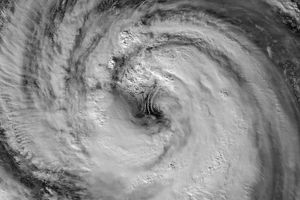
The next day, the VIIRS instrument on Suomi NPP captured another view of the storm. Satellite estimates of wind speed suggested very little change, with the storm still at category 5 strength.
Marcus first developed as a tropical storm on March 15, 2018, and reached category 2 cyclone strength on the Australian scale on March 17 (a strong tropical storm compared to Atlantic hurricanes). The cyclone blew through Darwin with wind gusts as high as 130 kilometers (80 miles) per hour. The storm knocked out electricity for more than 20,000 people, and thousands of trees were destroyed, including many that were planted in the wake of Cyclone Tracy of 1974.
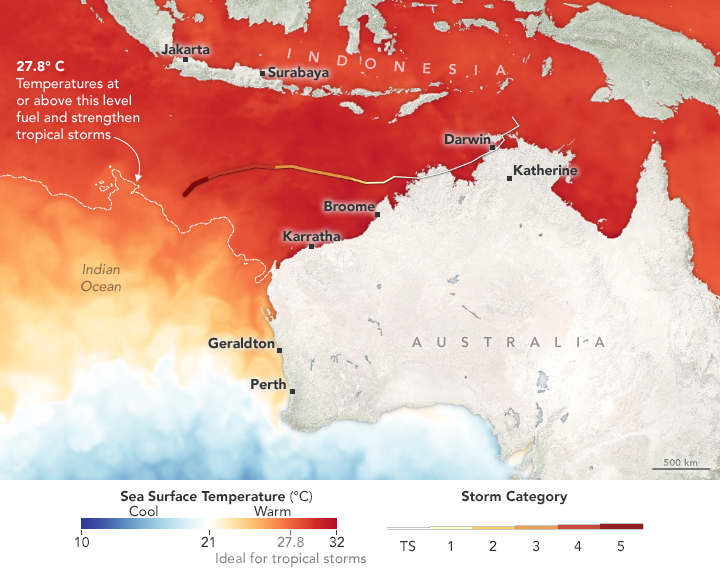
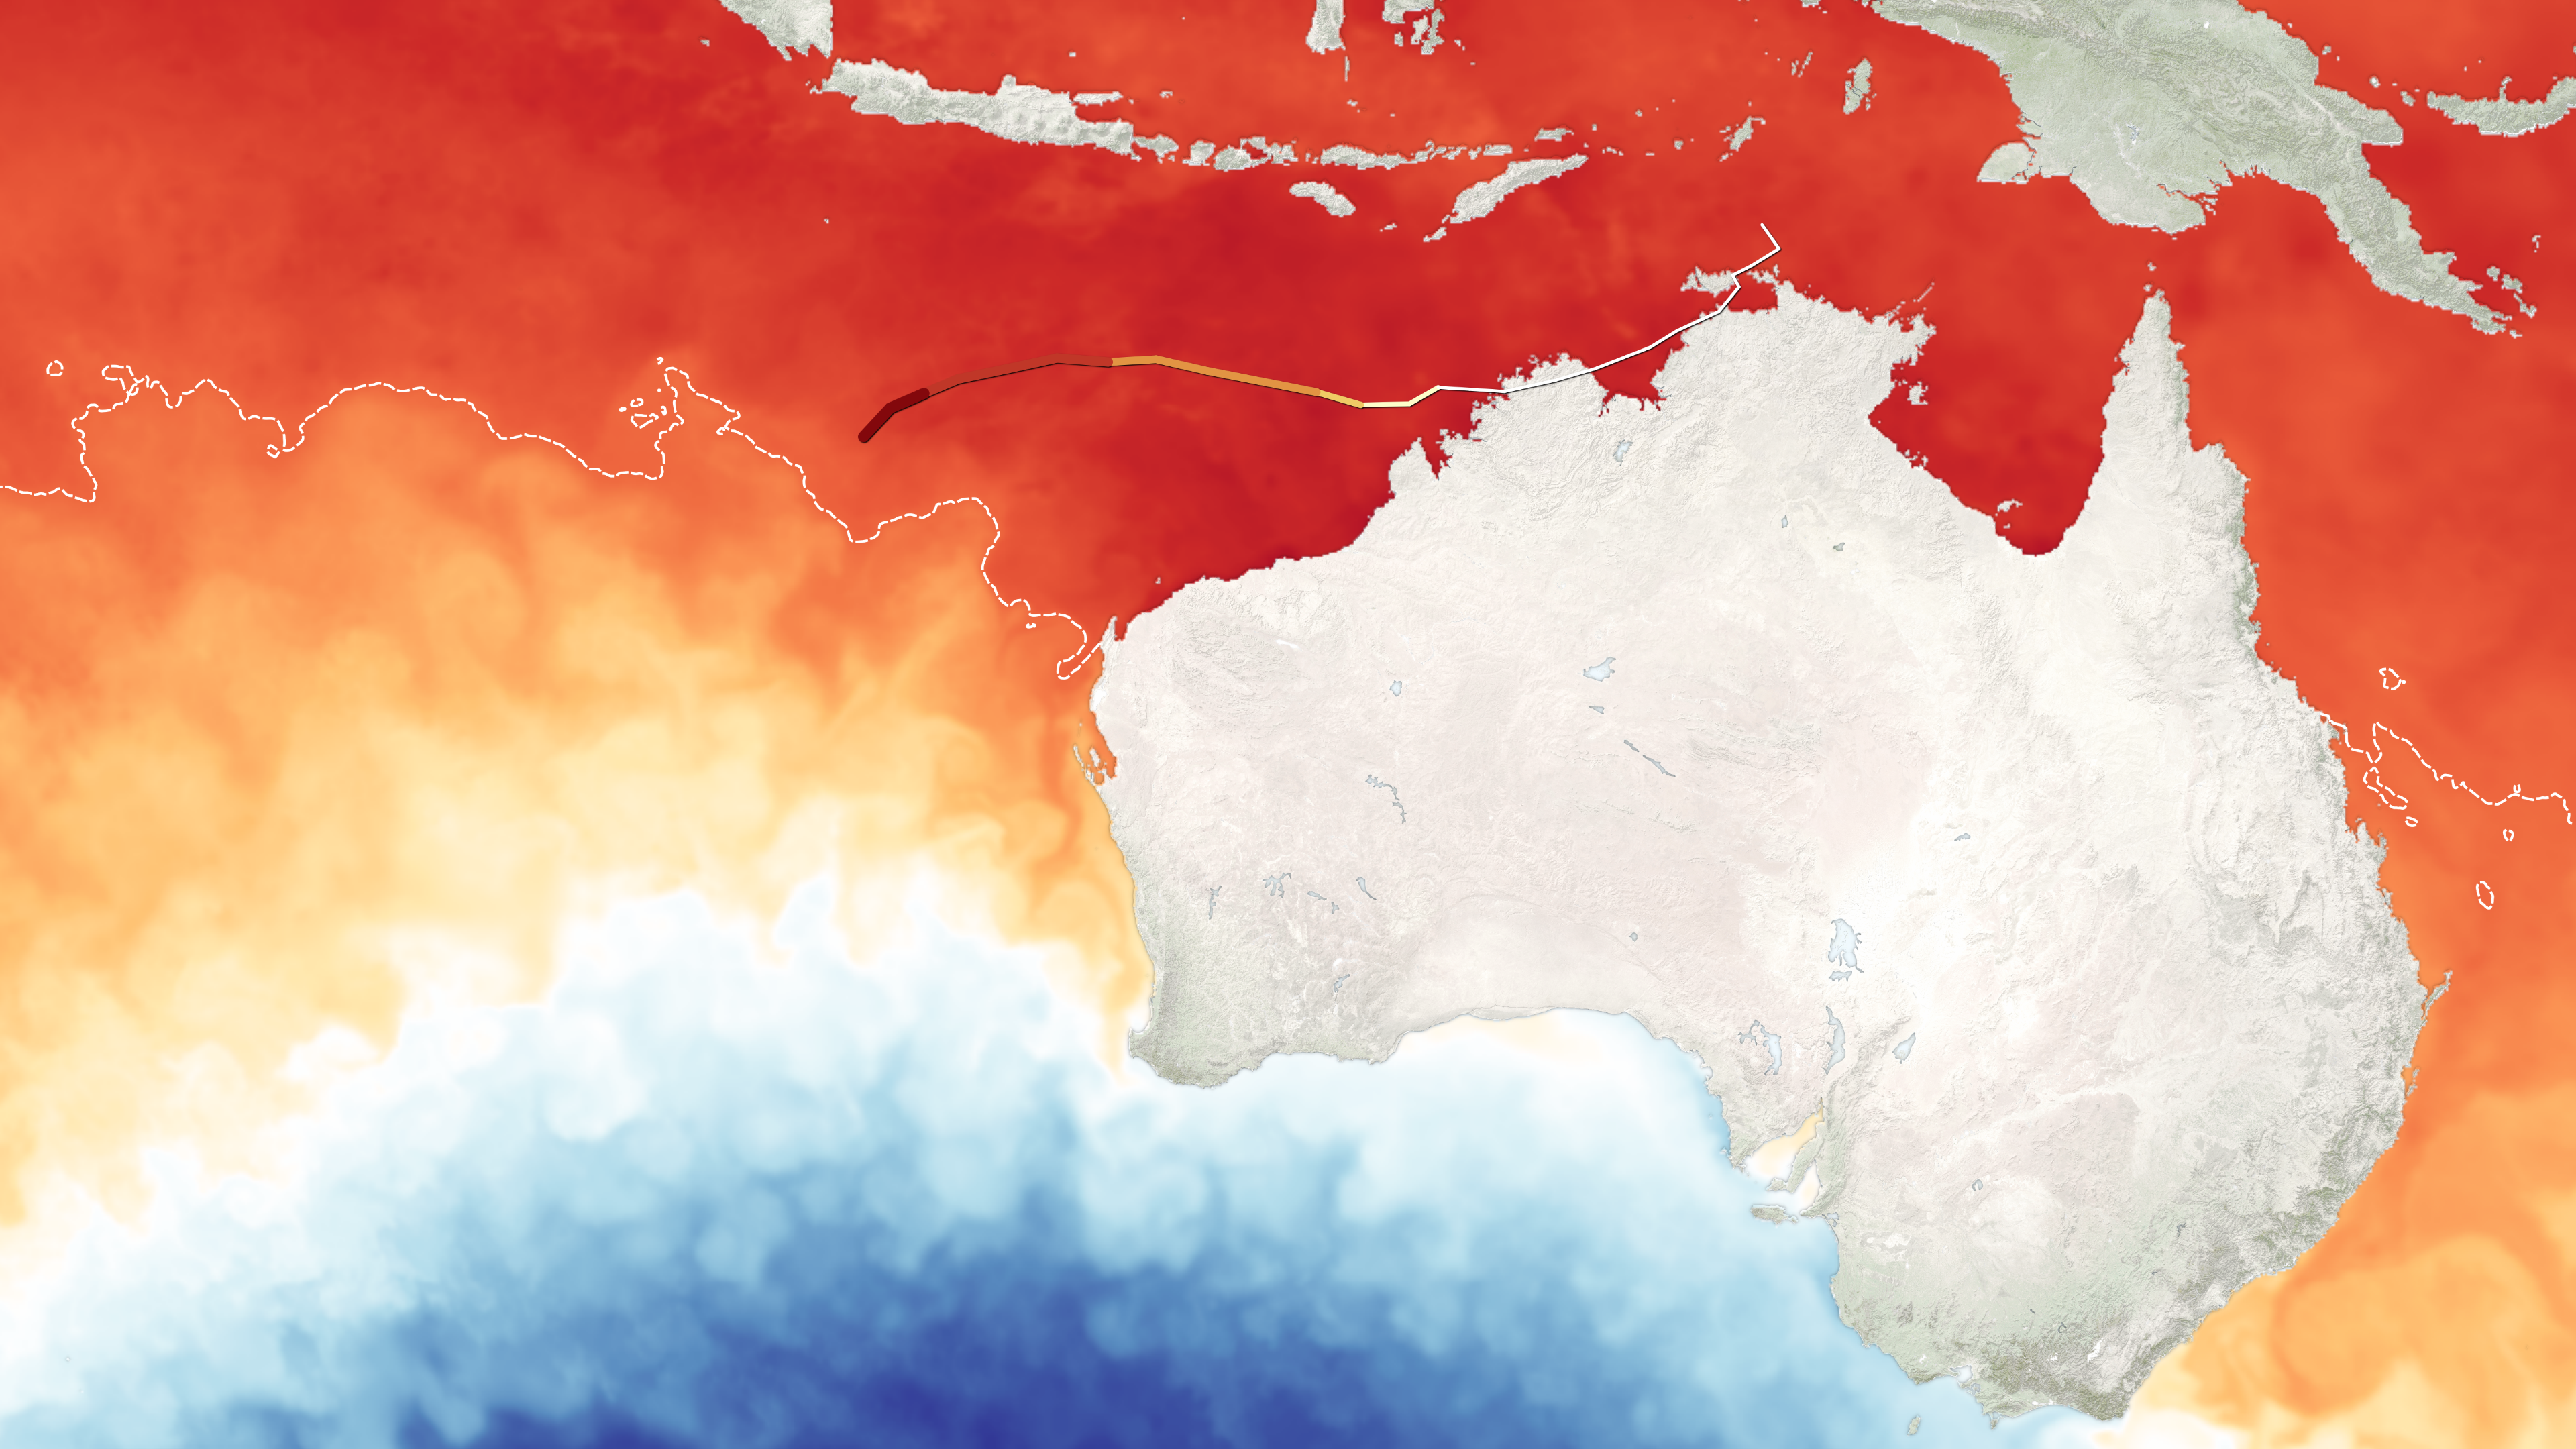
Cyclone Marcus skirted Northern Territory and Western Australia as it moved westward over very warm water and reached category 4 strength by March 21. The map above shows sea surface temperatures in the equatorial Indian Ocean on March 21, 2018. The data were compiled by Coral Reef Watch, which blends observations from the Suomi NPP, MTSAT, Meteosat, and GOES satellites, and computer models. The dotted white line across the Indian Ocean shows the cutoff between waters above and below 27.8 degrees Celsius, a threshold scientists believe to be necessary to fuel a cyclone. The yellow-to-red line represents the storm’s track.
As of March 22, forecasters were calling for Marcus to remain at severe strength for another day, then weaken rapidly as it turns south toward cooler water. The remnants of the storm could make landfall around Perth as a tropical depression.
References & Resources
- ABC News Australia (2018, March 21) Tropical Cyclone Marcus is headed for Perth, but you don’t need to panic. Accessed March 22, 2018.
- ABC News Australia (2018, March 17) Tropical Cyclone Marcus ‘a real wake-up call’ for complacent Territorians, NT Police say. Accessed March 22, 2018.
- Australian Bureau of Meteorology (2018) Current Tropical Cyclones. Accessed March 22, 2018.
- Unisys Weather (2018) Cyclone Marcus. Accessed March 22, 2018.
NASA image by Jeff Schmaltz, LANCE/EOSDIS Rapid Response. NASA Earth Observatory image by Joshua Stevens, using sea surface temperature data from Coral Reef Watch , and storm track information from Unisys . Story by Mike Carlowicz.


