![Request for Information – Potential [Placeholder for Prize]](https://assets.science.nasa.gov/dynamicimage/assets/science/missions/a-step/FFR_Earth_Background_20251120%20.png?w=1024)


In May 2006, Helen Amanda Fricker was doing the kind of work that left her perfectly open to a distraction. A geophysicist at Scripps Institution of Oceanography, Fricker didn’t doubt that her research was important, but she admits it was a little mundane. In an effort to improve Antarctic ice shelf maps and models of Antarctic tides, she was mapping the continent’s coastline by looking at small changes in elevation detected from satellite.

Finding the precise outline of Antarctica can be tricky because the continent is fringed with ice shelves—thick slabs of ice, fed by glaciers, floating on the ocean surface. The shelves may hide the continent, but they do offer clues about where the land ends. The clue is that the floating part of an ice shelf moves up or down with ocean tides while the land-based part sits still.
Fortunately for Fricker, she didn’t have to stand shivering on an Antarctic ice shelf with a handheld GPS receiver to pick up the clues. Subtle changes in ice-shelf elevation from rising and falling tides are visible to NASA’s GLAS (Geoscience Laser Altimeter System) sensor on the agency’s ICESat satellite. The altimeter bounces a laser pulse off the Earth’s surface and times how long the signal takes to come back. Differences in the signal’s return times for the same location indicate changes in elevation.
ICESat makes measurements for 33 days roughly every 4 months, collecting data over 70-meter-wide “footprints” every 175 meters along the satellite’s ground track. “So we got the same patch of real estate—or strip of real estate—surveyed every four months, and we could see how its elevation changed through time,” Fricker explains.
In late May 2006, Fricker was concentrating on West Antarctica, around the Whillans and Mercer Ice Streams on the Ross Ice Shelf. She looked for the small elevation changes that would mark grounding lines, the place where the ice shelves stopped resting on land and started floating on the ocean. Marking the grounding lines would improve tidal models, which would improve understanding of ice shelf behavior, which influences glaciers, which influence sea level. Important work with a long-term payoff, but not terribly exciting.
Then she found something she didn’t expect.
Fricker found an elevation change, but two things about it struck her as weird. For one, it was in the wrong place—near a feature known as Engelhardt Ice Ridge—inland from where the ice shelf grounding line should have been. For another, the elevation change was far bigger than the typical tidal movement of 1 or 2 meters (3 to 6.5 feet). Between October 2003 and November 2005, the area she was examining had dropped roughly 9 meters (nearly 30 feet). “I wasn’t expecting to find this at all,” Fricker recalls. “I was shocked.” Something under the ice had to be moving.

Fricker contacted Ted Scambos at the National Snow and Ice Data Center, the scientist who had spearheaded the development of the Mosaic of Antarctica. Was he interested in helping her pin down the source of the elevation change? He was.
Learning to Add and Subtract
Scambos and his colleagues had created the Mosaic of Antarctica map by layering hundreds of digital images of Antarctica taken by Aqua and Terra MODIS between late 2003 and early 2004. To help Fricker find the source of the elevation drop, he would use a similar technique. But instead of “adding” the layers of MODIS images together to improve the amount of detail in the map, he would “subtract” images captured at different times to figure out what had changed.
Scambos had been working with Robert Bindschadler of NASA’s Goddard Space Flight Center for the past two years, each scientist using data from different NASA sensors to explore the idea of “image differencing.” Fricker’s discovery was a perfect test case for them, and they jumped at the chance to apply their techniques to her find. Photo-like images can’t provide actual elevation change in meters or feet, but if they are captured under similar enough lighting conditions, differences in shadows or brightness between two images can verify that the slope of the surface, and therefore its elevation, has changed.

“With image differencing, we had to be even more constrained than MOA,” Scambos explains. A change in the Sun’s position at the time of an image would give a false impression of change on the continent’s surface. To keep the shadows consistent, the researchers only used images acquired at a certain time of day and a certain time of year (between late November and early December). Scambos then collected as many images fitting those criteria as possible, cleaning up any flaws created by blowing snow or clouds. Once he “subtracted” the images, he could see actual changes in the surface of the snow and ice.
“Near the grounding line, there were lots of changes that occurred, lots of crevasses [cracks in the ice] that you could see because the moving crevasse ridges and troughs had shifted between images,” explains Scambos. The MODIS images confirmed that the elevation inland of the ice shelf grounding line had changed over an oval-shaped area about 15 by 30 kilometers. The area had clearly dropped in elevation, consistent with Fricker’s ICESat interpretation.

“We knew immediately we were onto something big,” Scambos says. The elevation change at the surface was only the visible sign of a change that took place beneath the thick layer of fast-moving ice that covered the area. Buried beneath the ice stream, the cause of the change couldn’t be directly observed. It had to be deduced.
Could it be a sediment shift? Elsewhere in Antarctica, scientists had previously documented that substantial amounts of sediment could move under the ice, but Fricker and her colleagues didn’t think that sediment was responsible here. Under the ice, the thick mud would likely have had an uneven surface. The area Fricker and her colleagues studied had a smooth surface, and it changed more quickly than sediment could likely move. One of geology’s oldest principles is that when a liquid fills a basin, its top surface is smooth and parallel to the horizon. “It took us about a day to convince ourselves it was water,” Scambos recalls.
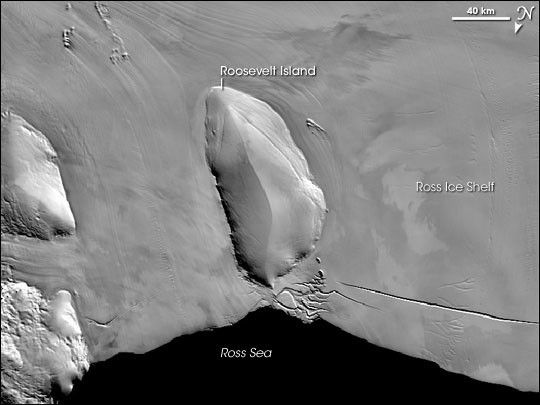
“It’s been known for a very long time that there are lakes under Antarctica’s ice,” Fricker explains. While the surface of the stream is frigid, the underbelly is warmer, with geothermal heat and the friction of the ice’s movement producing meltwater. “There are 145 documented subglacial lakes, and people are discovering more and more.” The lake she and her collaborators found was similar in area to Lake Tahoe (although not nearly as deep). The lake sat in the vicinity of Siple Coast, under the Ross Ice Shelf.

They knew they had found a subglacial lake, and because the elevation had dropped, they knew the lake had drained. But where did the water go, and why did it move?
“After we found that first lake, we went ahead and mapped all of the ice streams around Siple Coast,” Fricker recounts. When they did, they found 14 areas under the ice where elevation rose, fell, or oscillated between February 2003 and June 2006. Drawing from nearby features , they proposed names for the four biggest areas: Subglacial Lake Engelhardt (the largest one), Subglacial Lake Conway, Subglacial Lake Mercer, and Subglacial Lake Whillans.

The simplest explanation for simultaneous elevation changes was that water was moving between these lakes. Glaciologists had previously documented that movements of meltwater beneath the ice can change the ice sheet’s surface elevation. Any subglacial water is subject to tremendous force from the weight of the ice overhead. As the ice stream above the lakes shifts, pressure increases in one area, and the water squishes to another area. The water flow into the new lake increases the pressure there, and eventually, that lake drains into another. As the lakes fill and drain, the elevation of the ice sheet above them rises and falls.

Based on elevation data, image differencing, and ice thickness measurements that suggested where the ice would be leaning most heavily on the water below, Fricker and her colleagues were able to deduce that a complicated network of waterways underlies this region of Antarctic ice. They were also able to describe how some of the subglacial lakes are connected to one another based on where the overlying ice exerted pressure.
“It’s fascinating to watch the water drain in one place and appear in another,” Fricker says. “It’s also incredible to think that you can actually get an idea of what’s going on in that subglacial environment just by looking at the surface. This is under a kilometer of ice we’re talking. We’re actually seeing what’s going on.”
Water Greases the Skids
Yet the discovery of this complex, subglacial water network means more than water squishing around under Antarctic ice. The location of the network under a fast-flowing ice stream means that water likely plays an important role in how quickly the ice overhead moves on its path to the sea. “We know intuitively that water lubricates the ice stream and reduces the friction,” Fricker explains. “If you have more water under an ice stream, it will flow faster. We know there should be some influence on flow speeds, and ultimately that’s going to affect how fast the ice flows off the continent and therefore sea level rise.”
Given those expectations, what actually appeared to be going on beneath the Whillans Ice Stream was rather odd. “While one isolated lake lost about two cubic kilometers of water, all the other lakes gained about an equivalent amount of water,” says NASA scientist Robert Bindchadler. “But it’s not the same water because the lake that lost water is downstream of the other lakes and in a separate basin.” The amount of water that accumulated in the other lakes is nearly equal to all the water that pressure and geothermal heat could likely have produced under the Whillans Ice Stream during that period. “Yet—and here’s the really odd part—,” he emphasizes, “this ice stream is slowing down at a consistent rate of about 1 or 2 percent per year. Now if water is the lubricant that lets ice go fast, why, if there is more water, is the ice stream going slower? We have ideas how to answer this, but the seeming contradiction shows us that we don’t understand this system yet.”
It is a system that climatologists studying the impact of global warming on sea-level rise want to understand better. While the Antarctic and Greenland ice sheet systems are irrevocably tied to Earth’s climate in many ways, Fricker and her collaborators all point out that subglacial lakes have no direct relationship to Earth’s steadily rising temperatures. “We’ve actually got evidence that there were features similar to this in the 1980s on the same ice stream, from photographs.” But even though the lakes are not caused by climate change, their role in “greasing the skids” beneath ice sheets and glaciers will have to be factored into models of how the Earth’s icy landscapes will react to global warming.
That those models need a lot of improvement before they can produce more than just broad estimates of sea-level rise was made clear in February 2007. The same month that the scientific magazine Science published Fricker and her colleagues’ paper on subglacial lakes, the Intergovernmental Panel on Climate Change (IPCC) released a summary of its 2007 report. Even though the panel strongly affirmed the link between greenhouse gases and rising global temperatures, it had to qualify its predictions of future sea level because “understanding of these [ice-sheet] processes is limited, and there is no consensus on their magnitude.”

Scambos expects that ice sheet contributions to sea level will be significant, but he agrees with the IPCC’s decision to avoid specific predictions at this point. “We’re still learning about all of the things that are contributing to flow off these ice sheets,” he says. The discovery of a complex “plumbing” system beneath the ice sheet is clear evidence of that. “Stuffing this information into models will be a real challenge, but it is what we [snow and ice scientists] need to do before we can help out the next IPCC report.”
For Fricker, the obvious next question is whether this kind of subglacial plumbing system exists all over Antarctica. Fricker and Scambos both admit that they don’t know. But they plan to find out. “We’re going to map the whole ice sheet. We’re going to do a continent-wide survey and find out where all the active regions are,” she says.
The drive to have results in time to provide input for the next IPCC report, just a few years down the road, can make scientific progress feel like a race. While the map of Antarctica’s subglacial waterways is incomplete, Scambos says, “We’ve fired the starting gun.”
Sidebar: The Role of Subglacial Lakes
A slab of ice larger than the continental United States smothers much of East Antarctica. A river of ice nearly 800 kilometers long, the Recovery Ice Stream, drains part of the East Antarctic Ice Sheet, sliding roughly 35 billion tons of ice into the ocean each year.
In some places, the ice stream lumbers along at 2 to 3 meters per year, but in others, it suddenly accelerates to 50 meters per year. It is as if the ice stream slips on a banana peel. Surprisingly, the acceleration doesn’t happen on a steep slope; it happens as the ice stream passes over a relatively flat area. What causes this sudden speed up?

Without satellite technology, the Recovery Ice Stream’s acceleration might be a mystery without a solution, but a team of researchers from Columbia University, NASA, and the Universities of New Hampshire and Washington combined satellite-based data from several sensors to peer across and below the ice in the area: radar data of ice velocity, photo-like images of the surface, and laser data of ice elevation. They also analyzed data from ground-based radar surveys collected between 1964 and 1966 on one of the few expeditions to traverse the area.
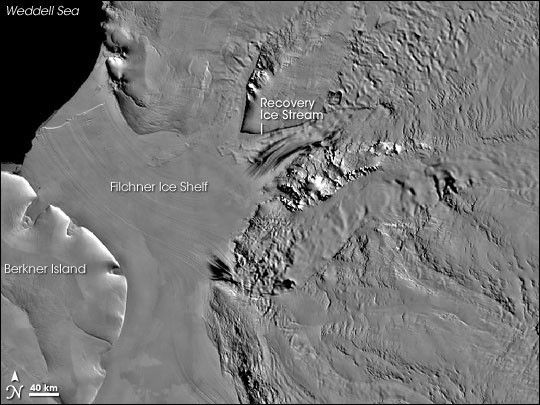
The researchers identified four large lakes below the ice; their combined area is close to that of Antarctica’s largest subglacial water body, Lake Vostok. Their location coincides closely with an area where the Recovery Ice Stream widens and accelerates, offering a neat explanation of what enables the ice to move faster there.
Beneath an ice stream’s frigid surface, its underbelly is warmed and melted by geothermal heat and friction created as it passes over the bedrock below. The researchers deduced that once the underside of the ice stream moves over a lake, the friction disappears, and the ice speeds up. Some lake water freezes onto the bottom of the ice, but this ice is warm and soft compared to the rest of the ice stream. When the ice stream reaches the downstream side of the lake, the warmer, softer ice at its base allows the ice stream to glide over land at a substantially quicker pace.
“Large subglacial lakes that clearly initiate streaming flow in a major ice stream have never been so completely documented before,” explains one of the authors, Chris Shuman of NASA Goddard Space Flight Center. The location and influence of subglacial lakes on ice streams are among the processes that scientists must understand in order to accurately model ice streams and ice sheets and to predict their contributions to sea level.
References and Related Reading
- Fricker, H. A., Scambos, T., Bindschadler, R., and Padman, L. (2007). An active subglacial water system in West Antarctica mapped from space. Science, 315, 1544-1548.
- Bell, R. E., Studinger, M., Shuman, C. A., Fahnestock, M. A., and Joughin, I. (2007). Large subglacial lakes in East Antarctica at the onset of fast-flowing ice streams. Nature, 445, 904-907.
- Kohler, J. (2007). Lubricating lakes. Nature, 445, 830-831.
- NASA: NASA Satellites Unearth Antarctic ‘Plumbing System,’ Clues to Leaks. February 15, 2007.
- Intergovernmental Panel on Climage Change: Climate Change 2007: The Physical Science Basis: Summary for Policymakers (1.3 MB PDF).
- Wingham, D. J., Siegert, M. J., Shepherd, A., and Muir, A. S. (2006). Rapid discharge connects Antarctic subglacial lakes. Nature, 440, 1033-1036.
- Gray, L., Joughin, I., Tulaczyk, S., Spikes, V. B., Bindschadler, R., and Jezek, K. (2005). Evidence for subglacial water transport in the West Antarctic Ice Sheet through three-dimensional satellite radar interferometry. Geophysical Research Letters, 32, L03501.
NASA Earth Observatory story by Michon Scott and designed by Robert Simmon.