![Request for Information – Potential [Placeholder for Prize]](https://assets.science.nasa.gov/dynamicimage/assets/science/missions/a-step/FFR_Earth_Background_20251120%20.png?w=1024)


November 10, 2015
The Decline of Lake Kariba

Editor’s Note: The graph has been updated to include a longer time span. A previous version of the story only included data from 2004 to 2016.
Persistent drought in southern Africa has greatly reduced the planting and emergence of healthy crops. But the drought has affected more than the area’s agriculture; it also has struck the area’s power supply.
Lake Kariba—one of the largest artificial reservoirs in the world—straddles the border between Zambia and Zimbabwe. The reservoir is an important resource for agriculture and fisheries; it is also a key source of hydroelectric power for the region. Water first began to fill the reservoir in 1958, following the damming of the Zambezi River. Over a half-century, the lake level has seen ups and downs due to variations in water use and climate patterns.
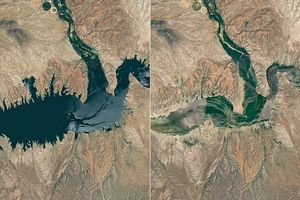
But in February 2016, water levels near the dam declined to near-record lows—just 12 percent full and within about 2 meters of the lowest level required for energy generation, according to the Zambezi River Authority. News reports noted that power generation has been reduced in both Zambia and Zimbabwe.
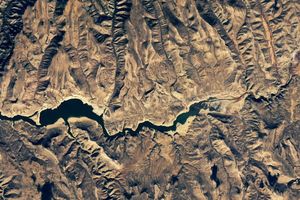
The Operational Land Imager (OLI) on Landsat 8 captured these natural-color images of the reservoir’s northeastern end, in the vicinity of Kariba dam. The top image shows the reservoir on November 10, 2015, near the height of a strong El Niño that brought hot and dry conditions to the region. (Cloud cover in December and January prevented satellites from acquiring a more recent image.) For comparison, the bottom image shows the reservoir on October 19, 2013, during a “neutral” year—when there was neither El Niño nor La Niña. Turn on the image comparison tool to see the shoreline change as the water level declines.
The graph below the images puts the current lake level in context. It shows the variations in lake height since 1992, as measured by the TOPEX/Poseidon, Jason-1, and OSTM/Jason-2 satellites. Notice that reservoir levels were also extremely low in 1997–1998 during another strong El Niño episode.
Lake levels plummet during El Niño years, when reduced rainfall upstream lessens the flow of rivers feeding Lake Kariba, according to Assaf Anyamba, a remote sensing scientist with the NASA Goddard Earth Sciences Technology Center. “The drought this year is of a larger magnitude than the drought in 1997-1998. That explains, in part, the differences in water levels between the two El Niño episodes.”
References & Resources
- Bloomberg Business (2016, January 8) World’s Biggest Dam Has ‘Extremely Dangerous’ Low Water Levels. Accessed February 11, 2016.
- The Guardian (2016, January 27) From the Nile to the Amazon, climate change threatens hydropower. Accessed February 11, 2016.
- The New Yorker (2016, February 2) One of Africa’s Biggest Dams Is Falling Apart. Accessed February 11, 2016.
- Reliefweb (2016, February 5) Zimbabwe declares ‘state of disaster’ over drought. Accessed February 11, 2016.
- USDA Foreign Agricultural Service Crop Explorer (2016, February 8) Lake Kariba Height Variations. Accessed February 11, 2016.
- Zambezi River Authority (2016, February 8) Lake Levels. Accessed February 11, 2016.
NASA Earth Observatory images by Jesse Allen, using Landsat data from the U.S. Geological Survey. Chart by Joshua Stevens using TOPEX/Posideon, JASON-1, & JASON-2 data provided by the United States Department of Agriculture Foreign Agriculture Service. Caption by Kathryn Hansen.