


New research presented at the 2004 meeting of the American Meteorological Society suggests that the cooler, drier conditions in Southern California over the last few years may be the result of a long-term pattern in the ocean known as the “Pacific Decadal Oscillation,” or PDO. This term describes a pattern of warm and cold sea surface temperature anomalies—resembling a large-scale “yin and yang” pattern—spinning clockwise very slowly in the North Pacific. Similar to its cousins to the south, El Niño and La Niña, the PDO can dramatically influence weather patterns hundreds or even thousands of miles away. But whereas El Niño and La Niña are relatively short-lived events (generally measured in months), the PDO revolves on cycles that take decades. (Click to read the full NASA press release.)
New satellite sensors that can measure sea surface temperature and water heights very precisely all over the globe, and that extend data sets begun back in the early 1990s, are giving scientists the perspective they need to study this large-scale, long-term phenomenon. Since 1992, with the launch of the TOPEX/Poseidon mission, NASA has been collecting surface height data over the entire Pacific Ocean and monitoring shifts in its heat content. The new Jason mission, begun in 2001, should continue that data set well into the new millennium. Before these satellites were available, monitoring such large-scale oceanic climate signals in near-real time was virtually impossible. (Also, check out the feature article on the TOPEX/Poseidon and Jason missions, entitled Double Vision.)
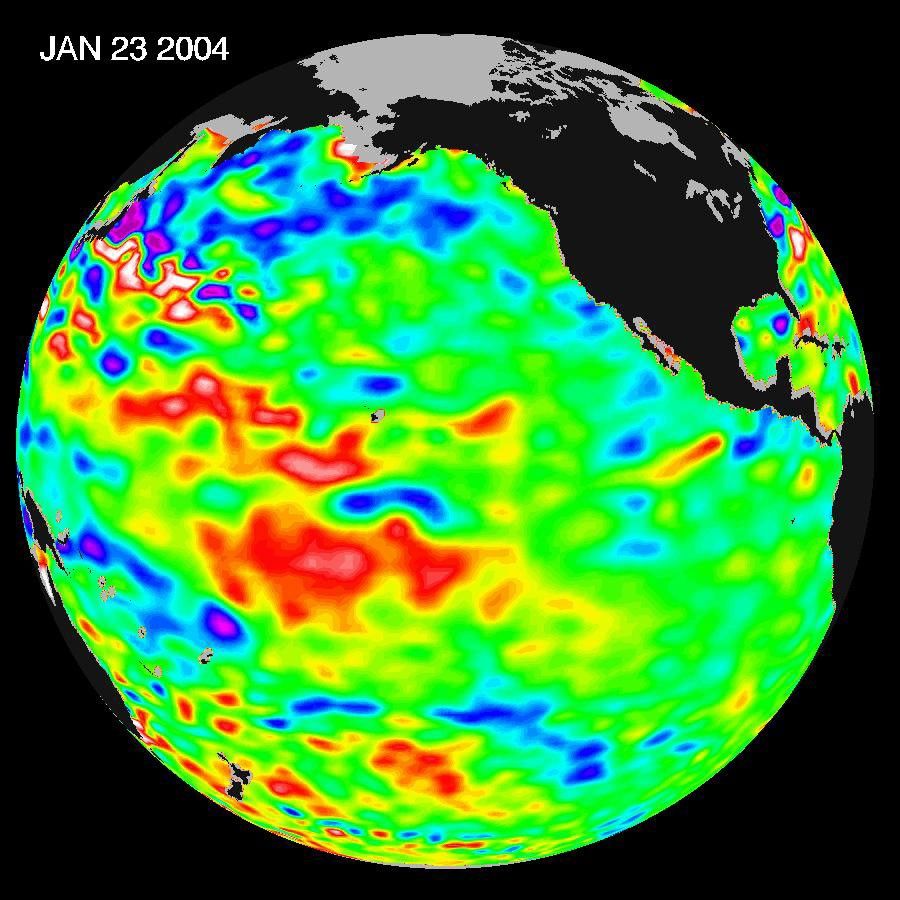
The image above shows Jason measurements of sea surface height, accurate to within 30 millimeters, across a large area of the Pacific Ocean. The image represents data collected and composited over a 10-day period, ending on January 23, 2003. The height of the water relates to the temperature of the water. As the ocean warms, its level rises; and as it cools, its level falls. Yellow and red areas indicate where the waters are relatively warmer and have expanded above sea level, green indicates sea level, and blue and purple areas show where the waters are relatively colder and the surface is lower than sea level.
References & Resources
Image Courtesy NASA/JPL Ocean Surface Topgraphy Team