


Aura Education: Ozone Lesson Plans
Exploring Ozone in our Atmosphere
These set of lesson plans use real NASA data to help students understand how ozone can be both "good up high and bad nearby." Students will explore how scientists use data to describe the atmosphere. Students will practice graphing skills to analyze human impacts on ozone concentrations on the ground and high in the atmosphere.
Lesson 1:
Skydiving through the Atmosphere
This lesson engages students in learning about the different layers of the atmosphere. Students are asked to observe and graph the changing characteristics of the atmosphere following Felix Baumgartner's skydive from the stratosphere. Then, students are encouraged to present their findings in an info-graphic. The lesson uses real NASA data on ozone levels and temperature, relating both to altitude.
Additional Lesson 1 Handouts
Worksheet A: Skydiving through the Atmosphere Notes [PDF]
Worksheet B: Ozone vs. Altitude Graphing Assignment [PDF]
Worksheet C: Temperature vs. Altitude Graphing Assignment [PDF]
Worksheet D: Create an Info-graphic [PDF]
Lesson 2:
Data Exploration and Interpretation: Understanding the UV/Ozone Relationship
Students will understand the relationship between stratospheric ozone and Ultraviolet radiation. They will model the Sun/Earth relationship, complete graphing exercises, and view real NASA data to better understand how humans can impact ozone concentration and effect Earth's climate.
Additional Lesson 2 Handouts
Worksheet A: UV Radiation vs. Latitude Graphing Assignment [PDF]
Worksheet B: Ozone vs. Latitude Graphing Assignment [PDF]
Lesson 3:
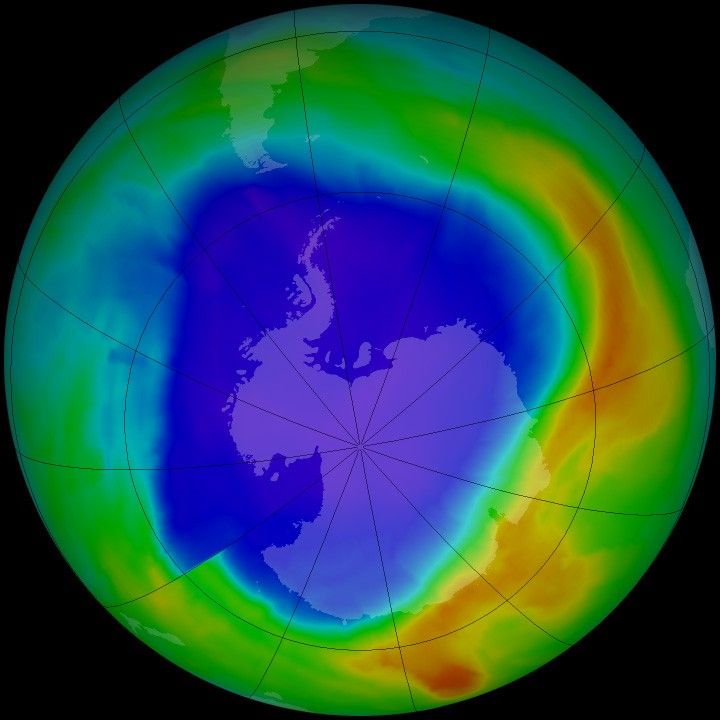
Bad Ozone
Students will analyze real NASA data about ground-level ozone and nitrogen dioxide. They will determine where ozone concentrations are highest, why ozone concentrations are highest, and how ozone concentrations have changed over time. Students will also learn about the effects of ground-level ozone on plants and people.
Additional Lesson 3 Handouts
Los Angeles and Atlanta
Worksheet A: Identifying the Causes of Ground-Level Ozone [PDF]
Worksheet B: Looking at Satellite Data: Understanding NO2 Pollution Data Visualizations [PDF]
Worksheet C: Looking at Satellite Data: Comparing NO2 Pollution and Population [PDF]
Worksheet D: Looking at Satellite Data: Comparing NO2 Levels Over Time [PDF]
Worksheet E: Ozone: Reflection [PDF]
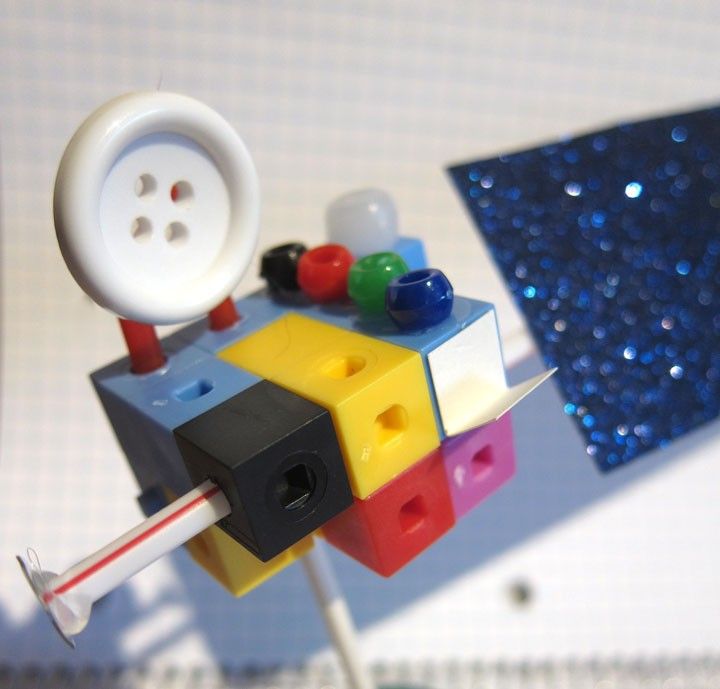
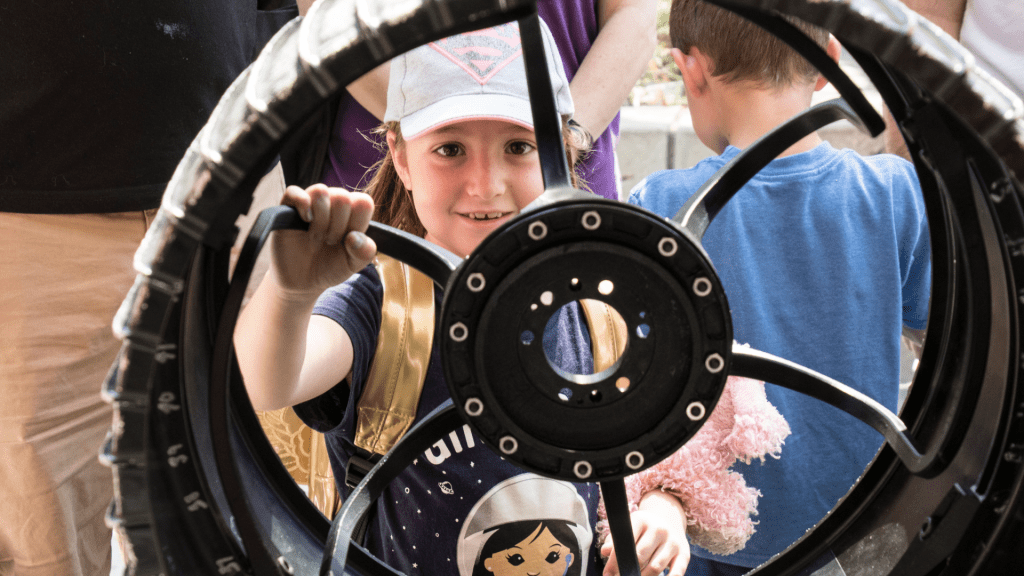
Engineer an Earth Observing Satellite
In this activity, you will select the scientific instruments for your satellite, calculate the power requirements for all the instruments and subsystems, and then construct a scale model of your very own Earth observing satellite.
Build your own scale model