


Spectroscopy 101 – Invisible Spectroscopy
How will Webb use spectroscopy to explore the universe?
Spectroscopy is not limited to visible light.
We tend to think only of visible light when we refer to colors, but it is important to consider that gamma rays, X-rays, ultraviolet light, infrared light, microwaves, and radio waves are all bands of colors as well—just colors that are invisible to human eyes.
Like visible light, these bands of light also interact with matter in various ways. And like visible light, they can be also be spread out into their component wavelengths. Although human eyes would never be able to see an infrared, ultraviolet, or X-ray spectrum directly, we have tools to detect these wavelengths and convert the spectra into digital form that can be shown as a picture or plotted on a graph.
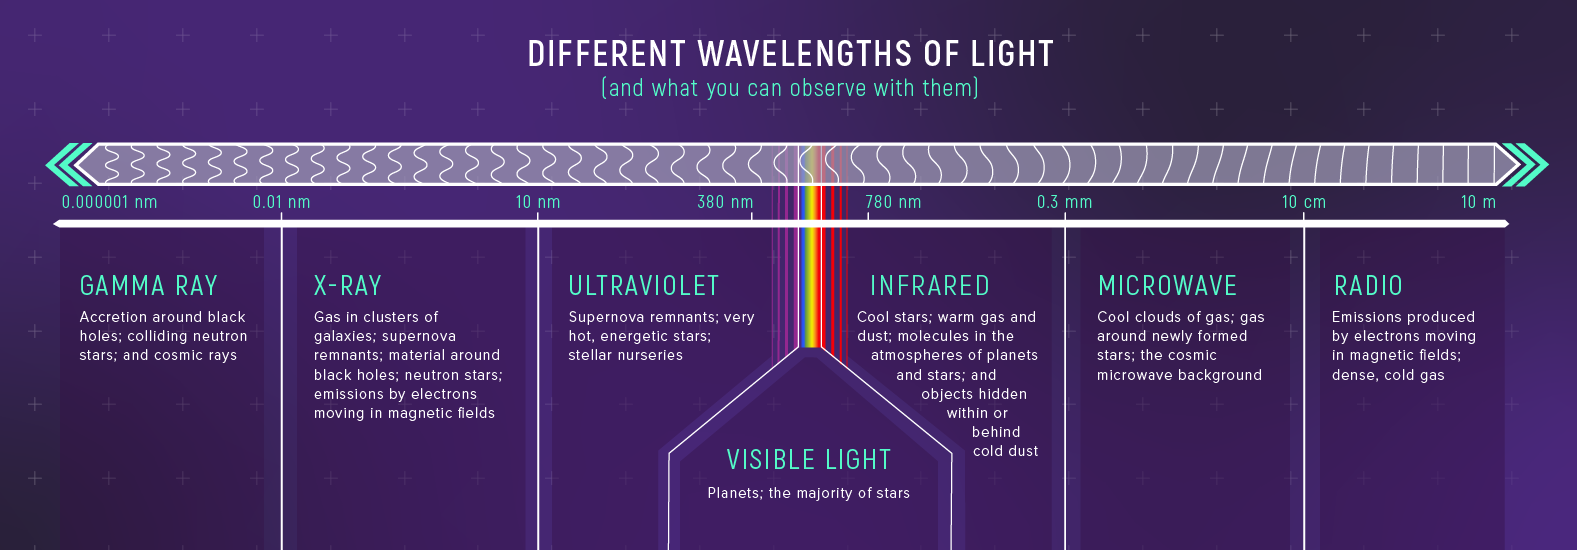
Why go to all the trouble of trying to detect and measure invisible spectra? We can learn only so much from a visible spectrum. Some stars are so hot that most of their light is ultraviolet. Planets and dust grains are too cool to emit visible light; they give off most of their light as infrared. Many atoms and molecules are easier to detect via their ultraviolet or infrared spectra than their visible. Some phenomena emit radio waves, but no other measurable form of light. Some galaxies are so far away that their light, which was once visible, has been stretched out into infrared light.
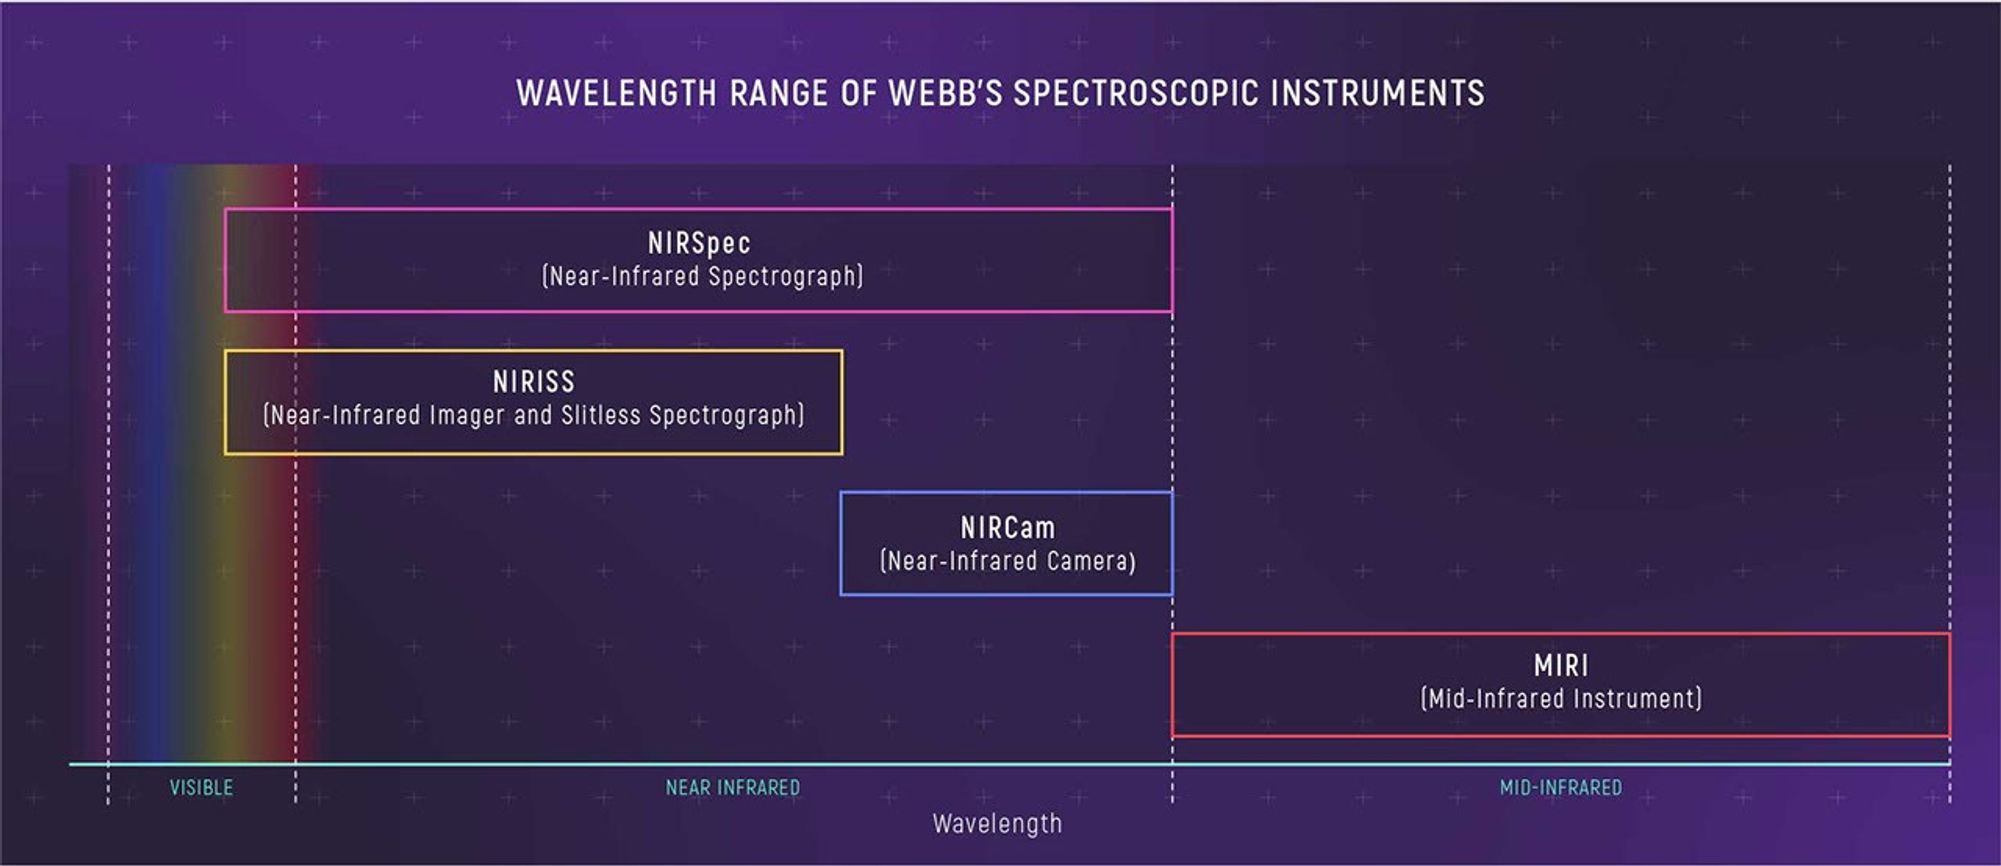
Spectroscopy with Webb
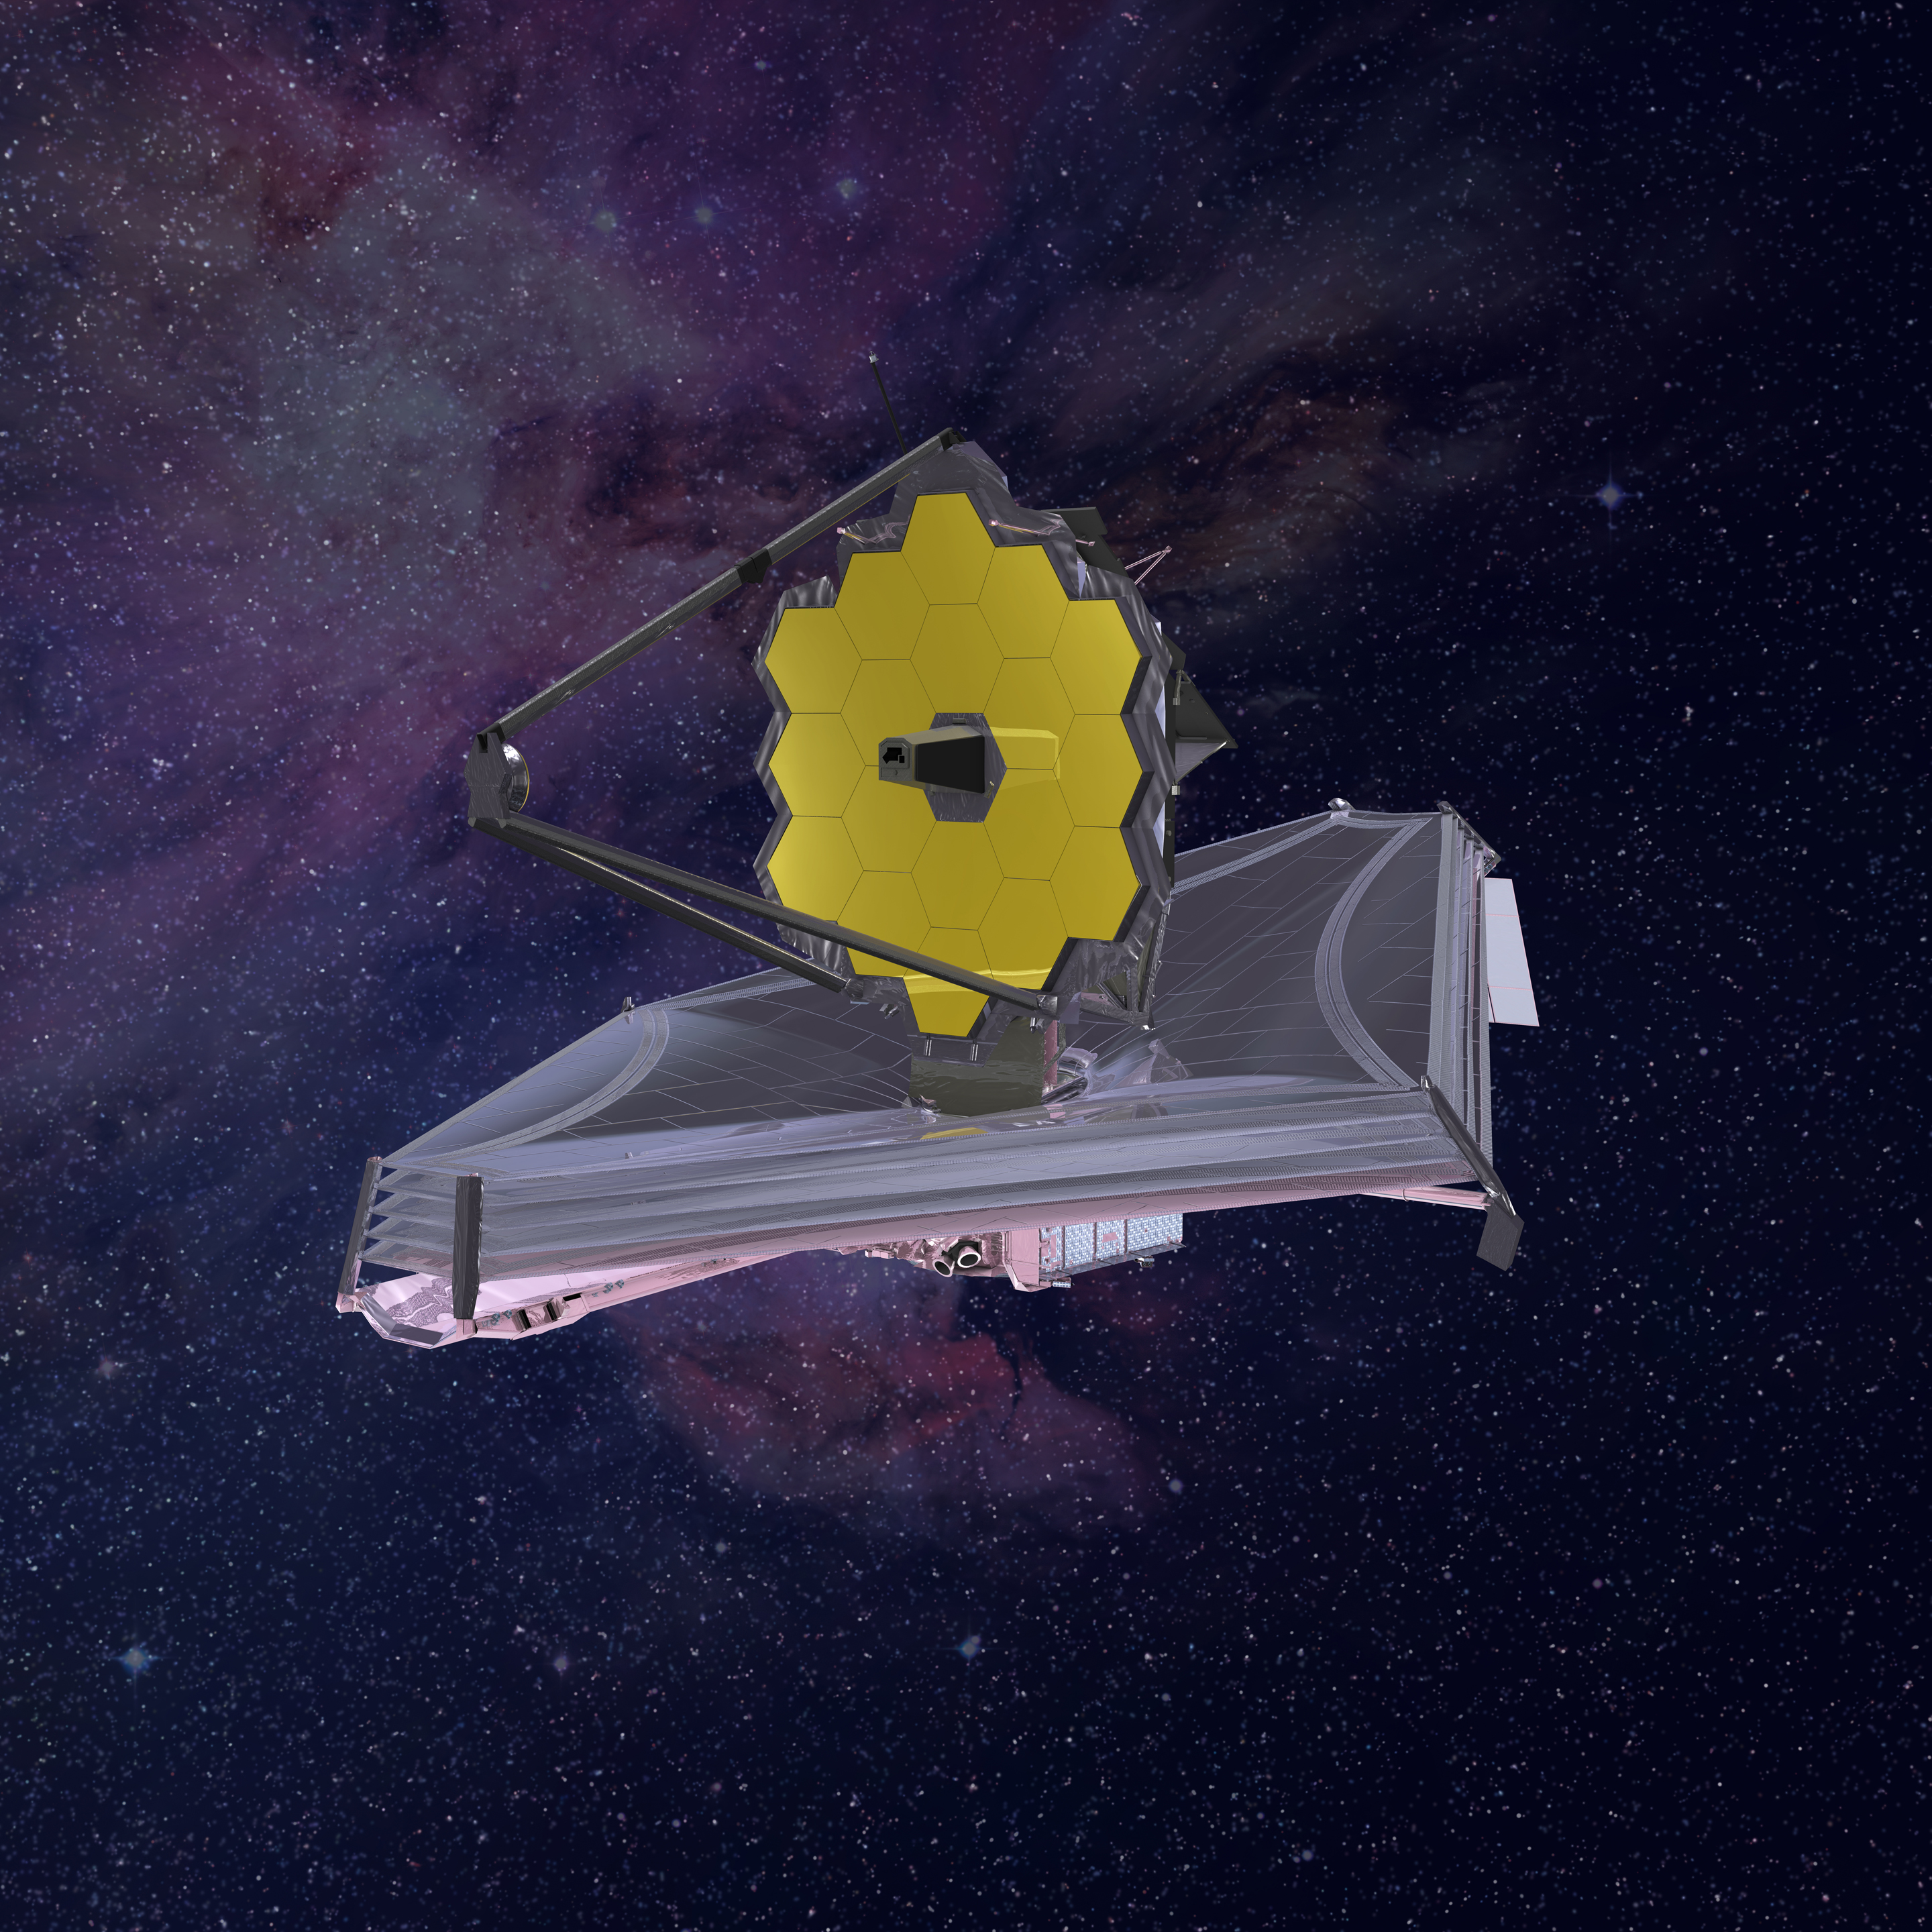
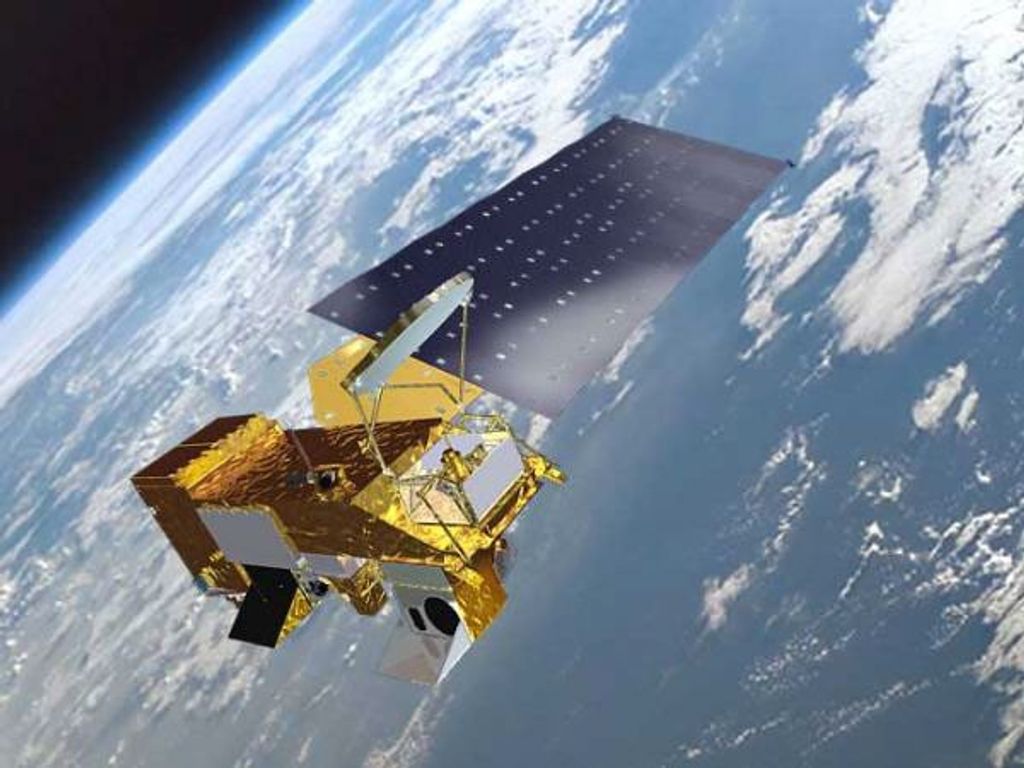
When it comes to infrared spectroscopy, you can’t beat the James Webb Space Telescope. With a giant mirror designed to collect infrared light from extremely dim objects, Webb has the ability to reveal infrared spectra of almost any type of object or material in space with unprecedented detail.
Webb’s primary mirror intercepts infrared light as it travels through space and reflects it onto a smaller secondary mirror. The secondary mirror then focuses the light into one or more of the four scientific instruments, each of which has spectrographs that disperse the light into its component colors to reveal infrared spectra.
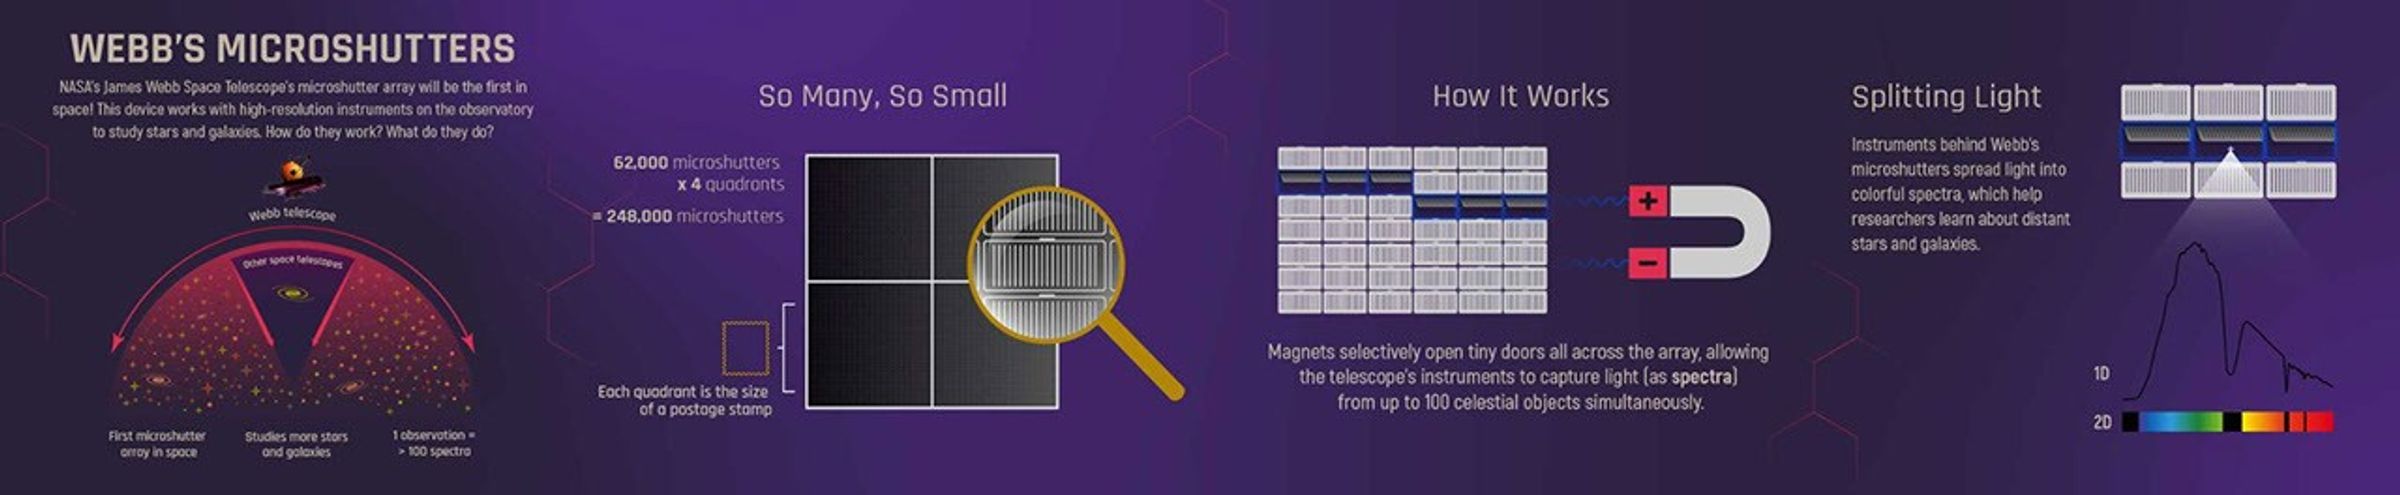
Webb has a number of spectroscopy “modes” to choose from (think modes on a digital camera), depending on what you are interested in. Some involve capturing the overall spectrum of a wide field of view—a field of stars or part of a nearby galaxy, for example. Others focus in on the spectrum of a single object, like a star, exoplanet, or distant galaxy. Two of the instruments have camera-spectrograph combos called integral field units that can capture an image along with a spectrum of each pixel in the image. And to top it off, Webb also has a nifty tool called a microshutter array—a grid of 248,000 tiny doors that can open and shut on command—making it possible to capture detailed spectra from more than 100 individual objects or locations at the same time.
In fact, while Webb will also capture spectacular infrared images of space, its real power is in spectroscopy, and the vast majority of Webb’s investigations will include spectroscopy. Astronomers will use spectra captured by Webb to study:
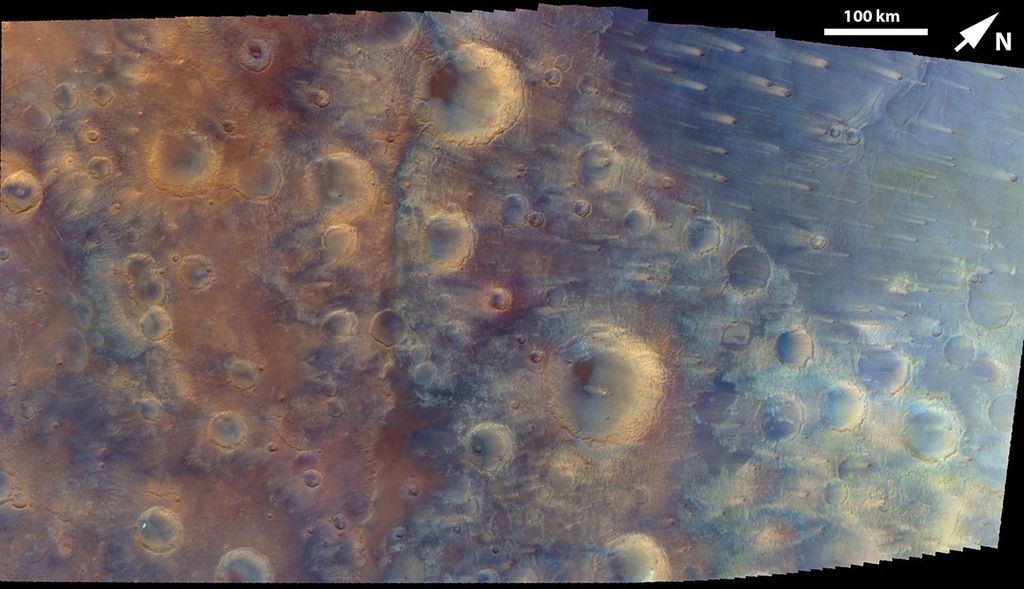
- Surfaces and atmospheres of planet, moons, comets, asteroids, and Kuiper Belt objects in our Solar System
- Fully-formed exoplanets, planets in the process of forming, and proto-planetary debris disks orbiting distant stars in the Milky Way
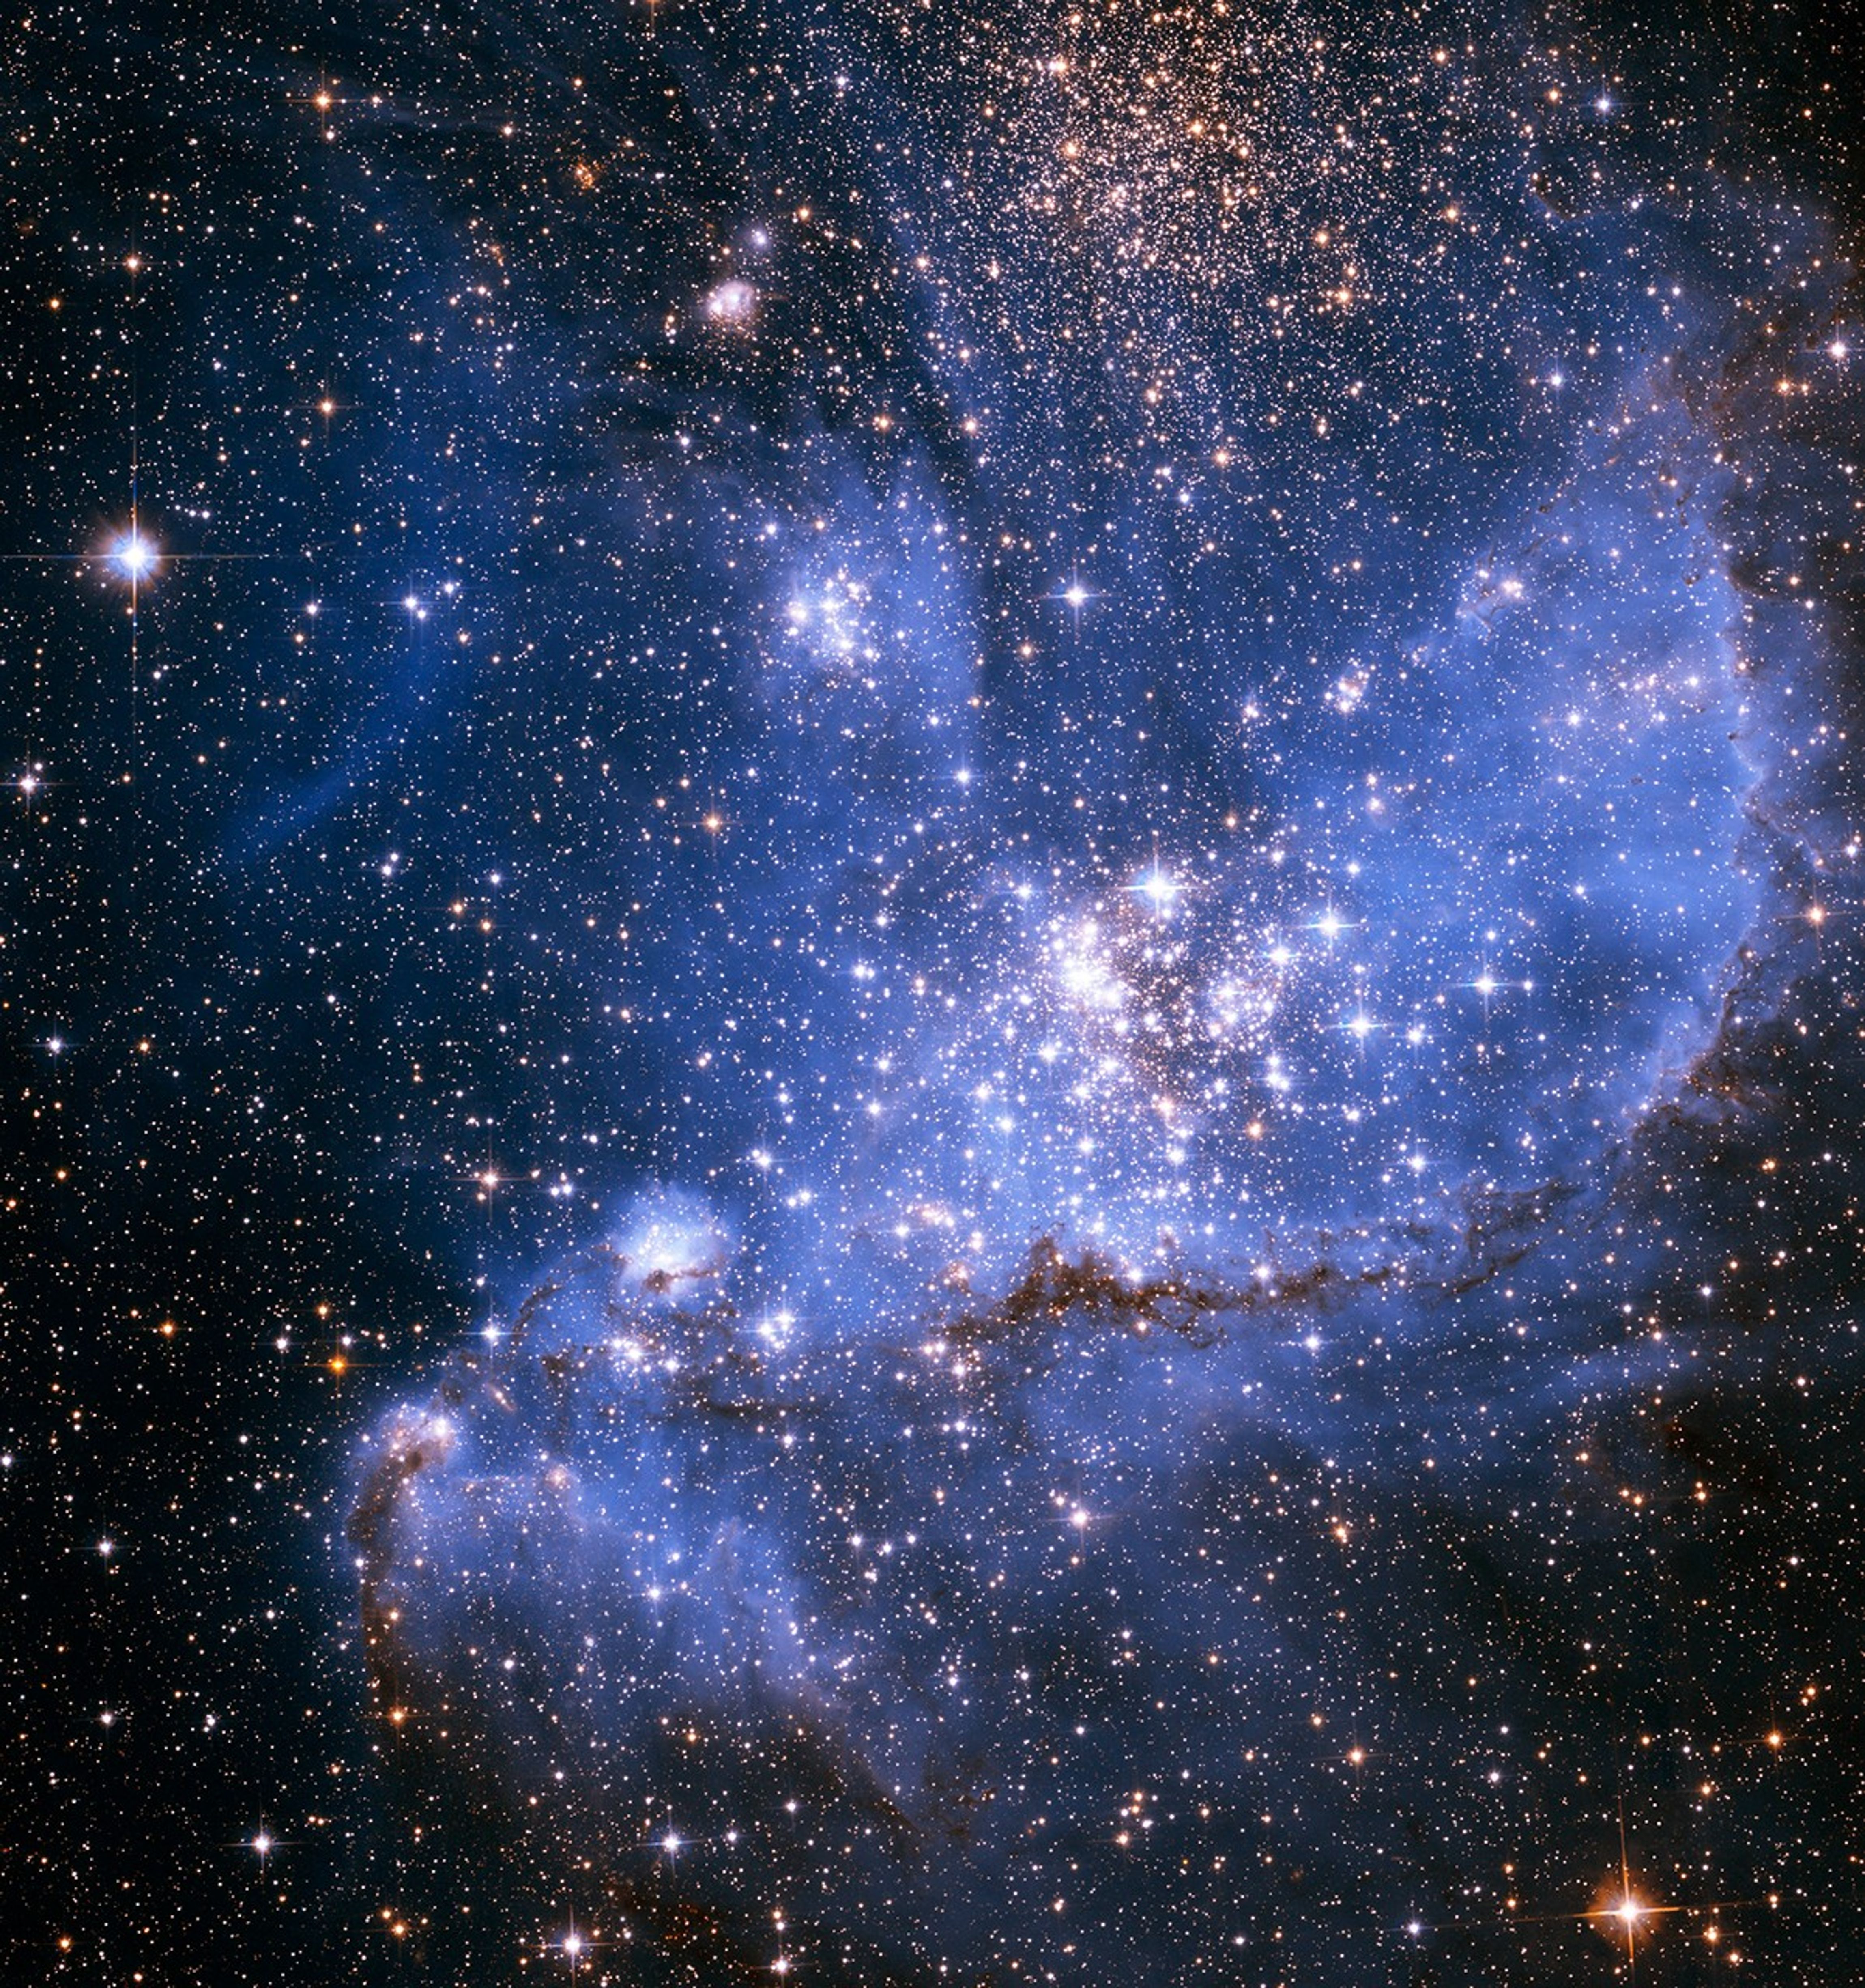
- Mature stars of different size, mass, age, color, temperature, evolutionary stage, and formation environment; and newly forming stars cocooned in dense dark clouds of gas and dust
- Cold molecular clouds that collapse to form stars; gas and dust ejected from dying stars; and molecules between stars
- Galaxies at different stages of evolution, including the first galaxies in their earliest stages of development
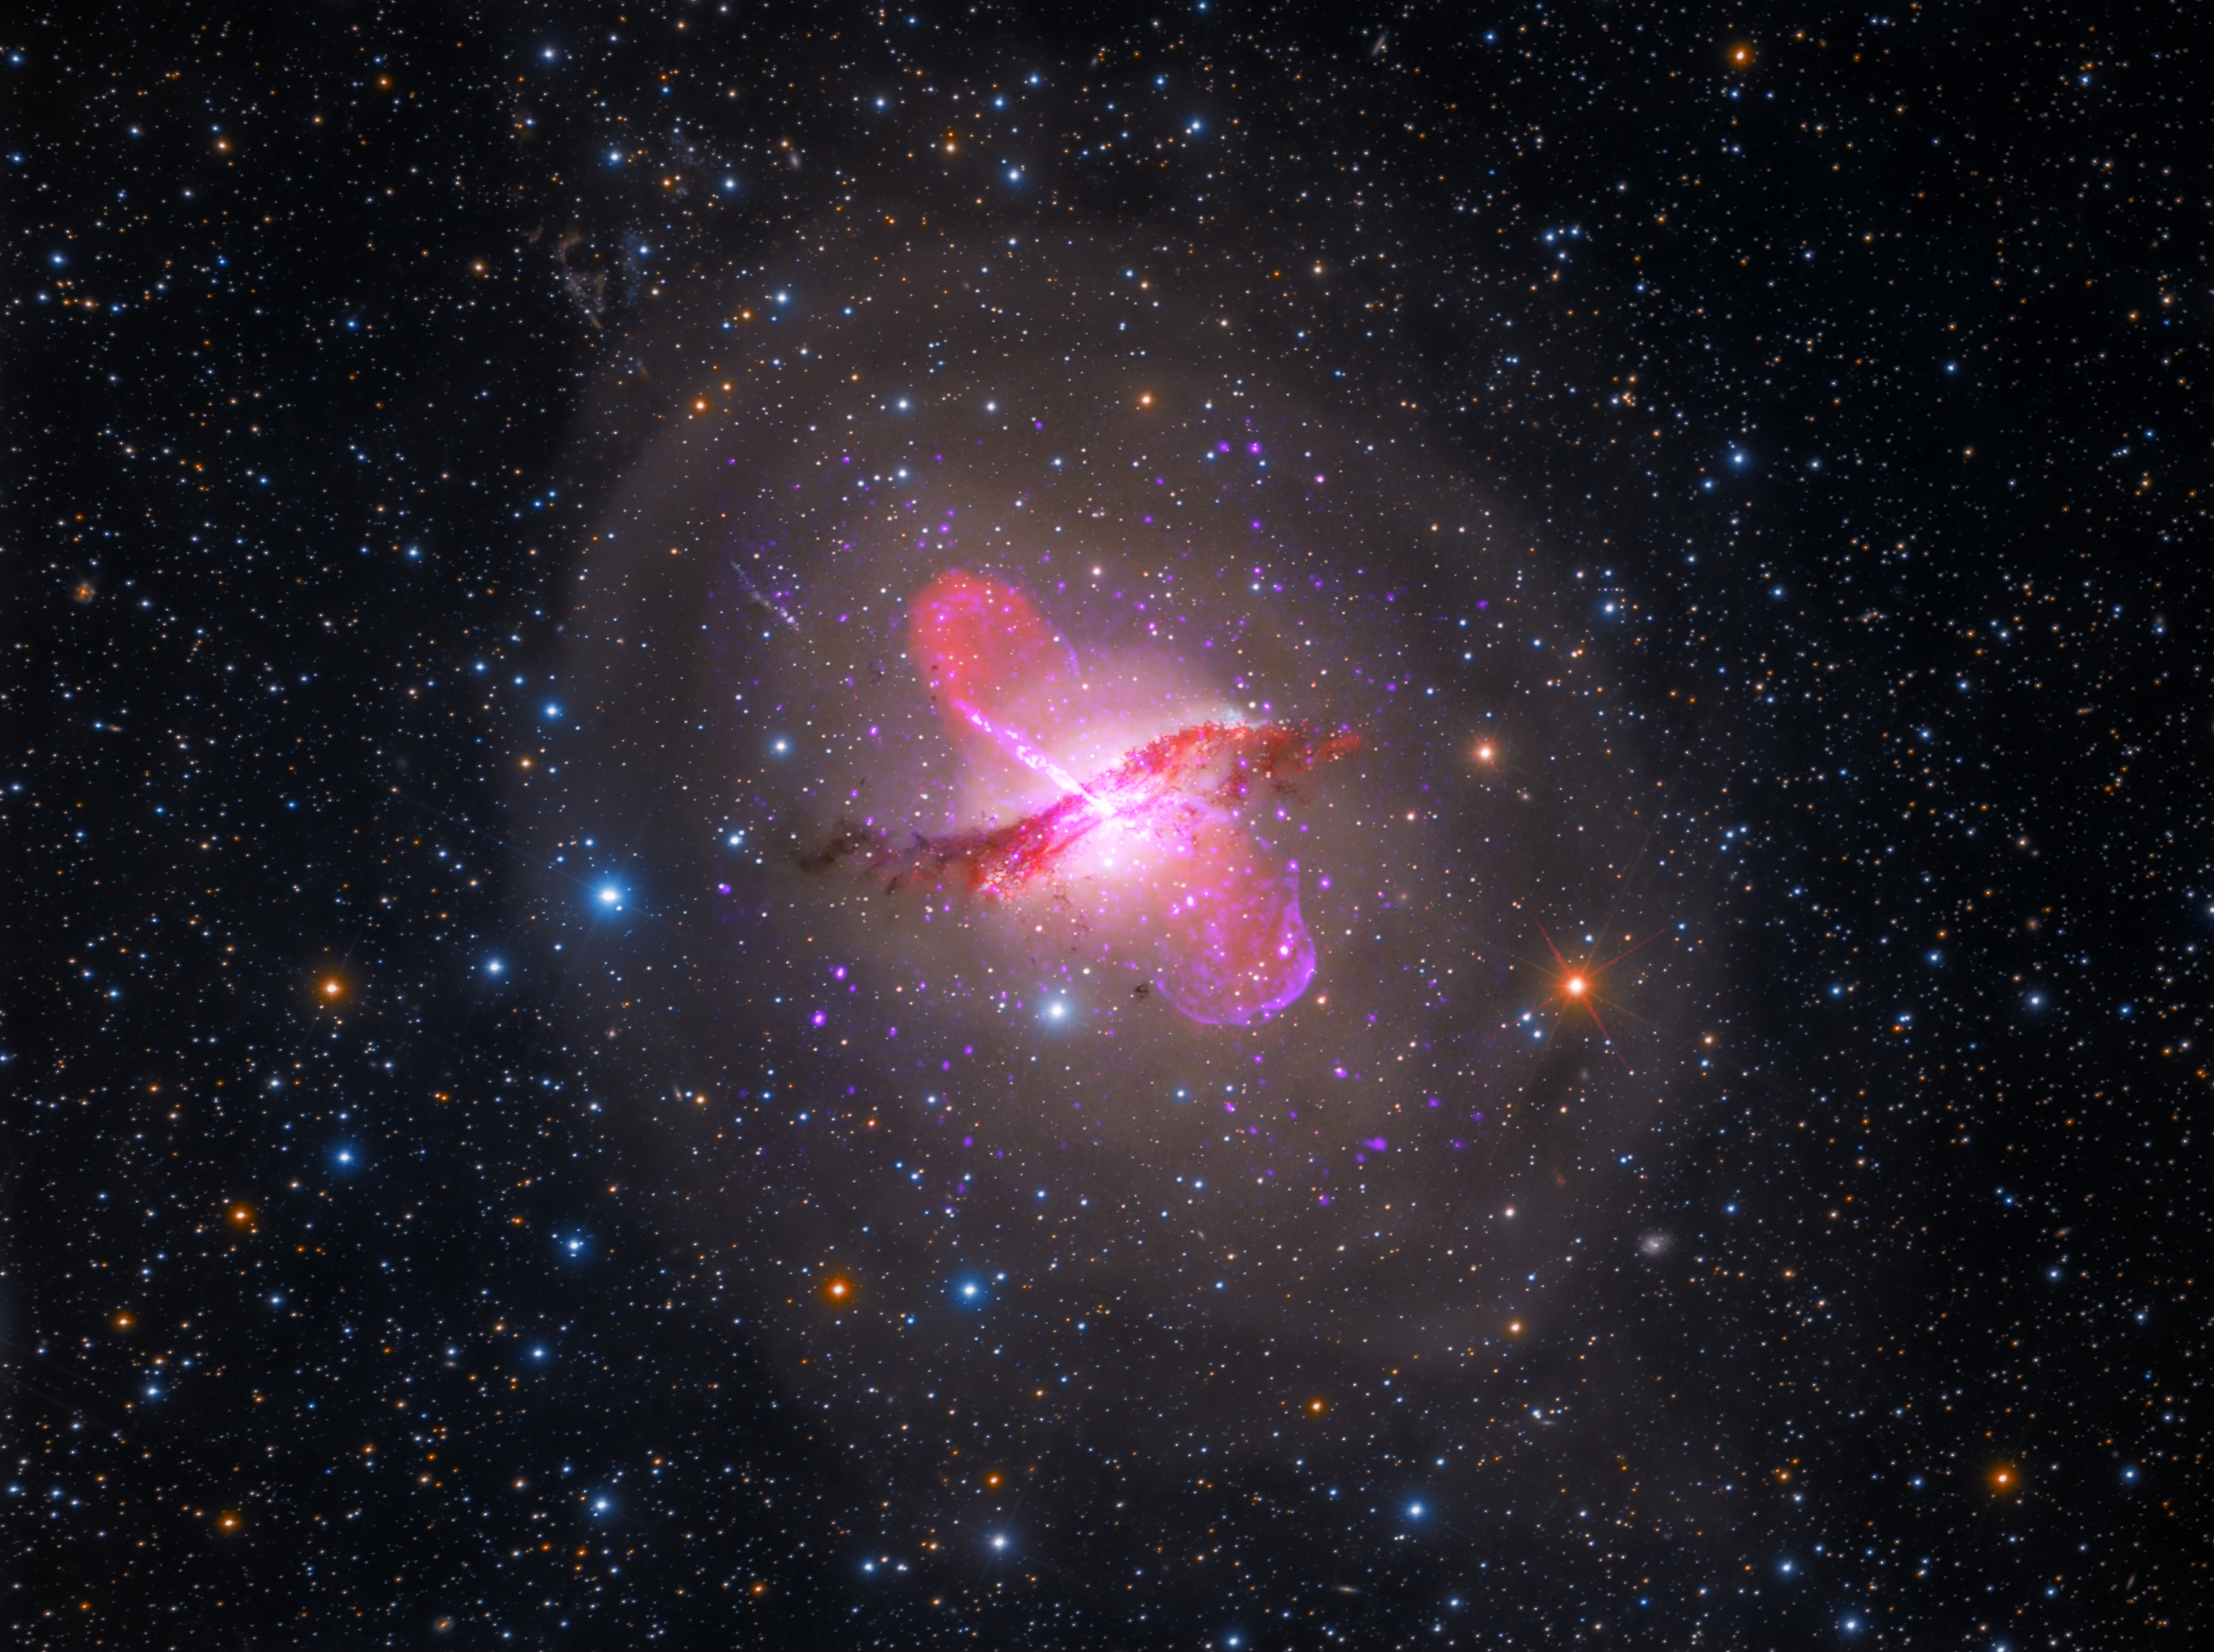
Webb will also capture spectra that can be used to study objects and materials that are invisible in infrared—such as black holes, dark matter, and infrared dark clouds—based on their influence on materials that do give off infrared light.