


1 min read
Webb Telescope Simulated Spectrum
Extended Description and Image Alt Text
Extended Description
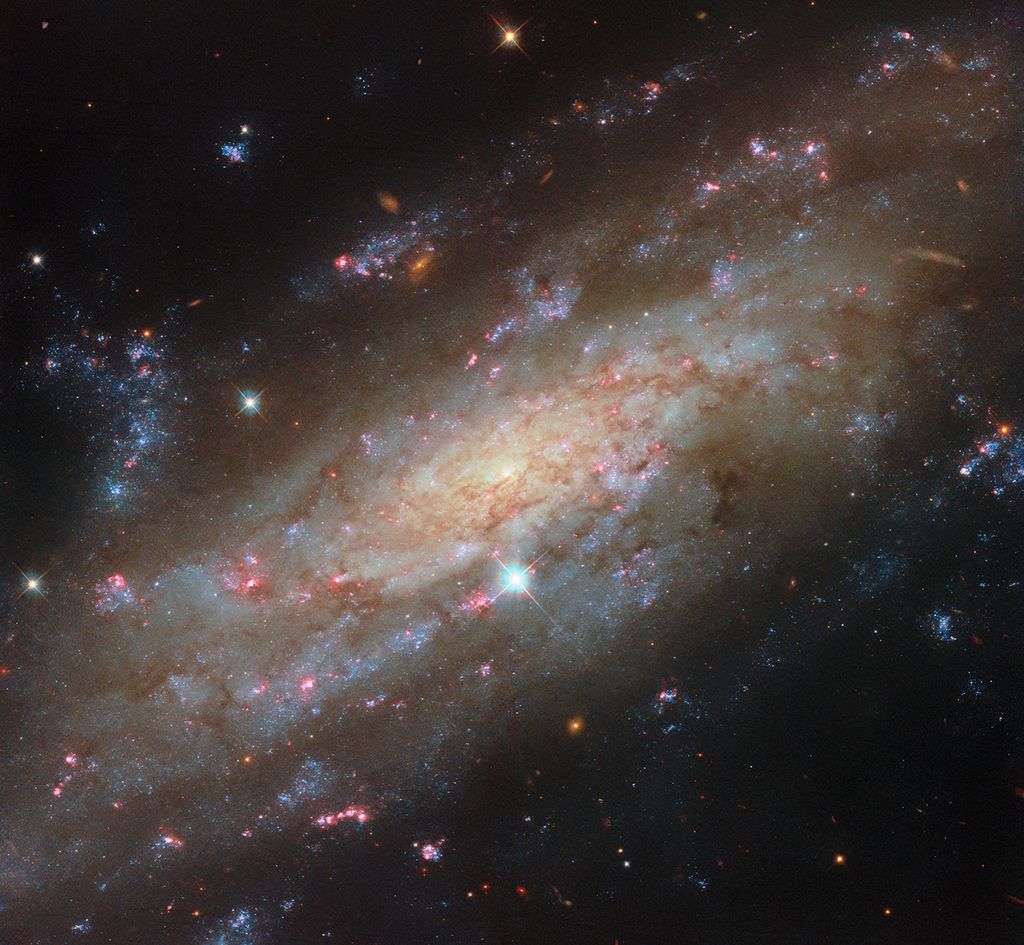
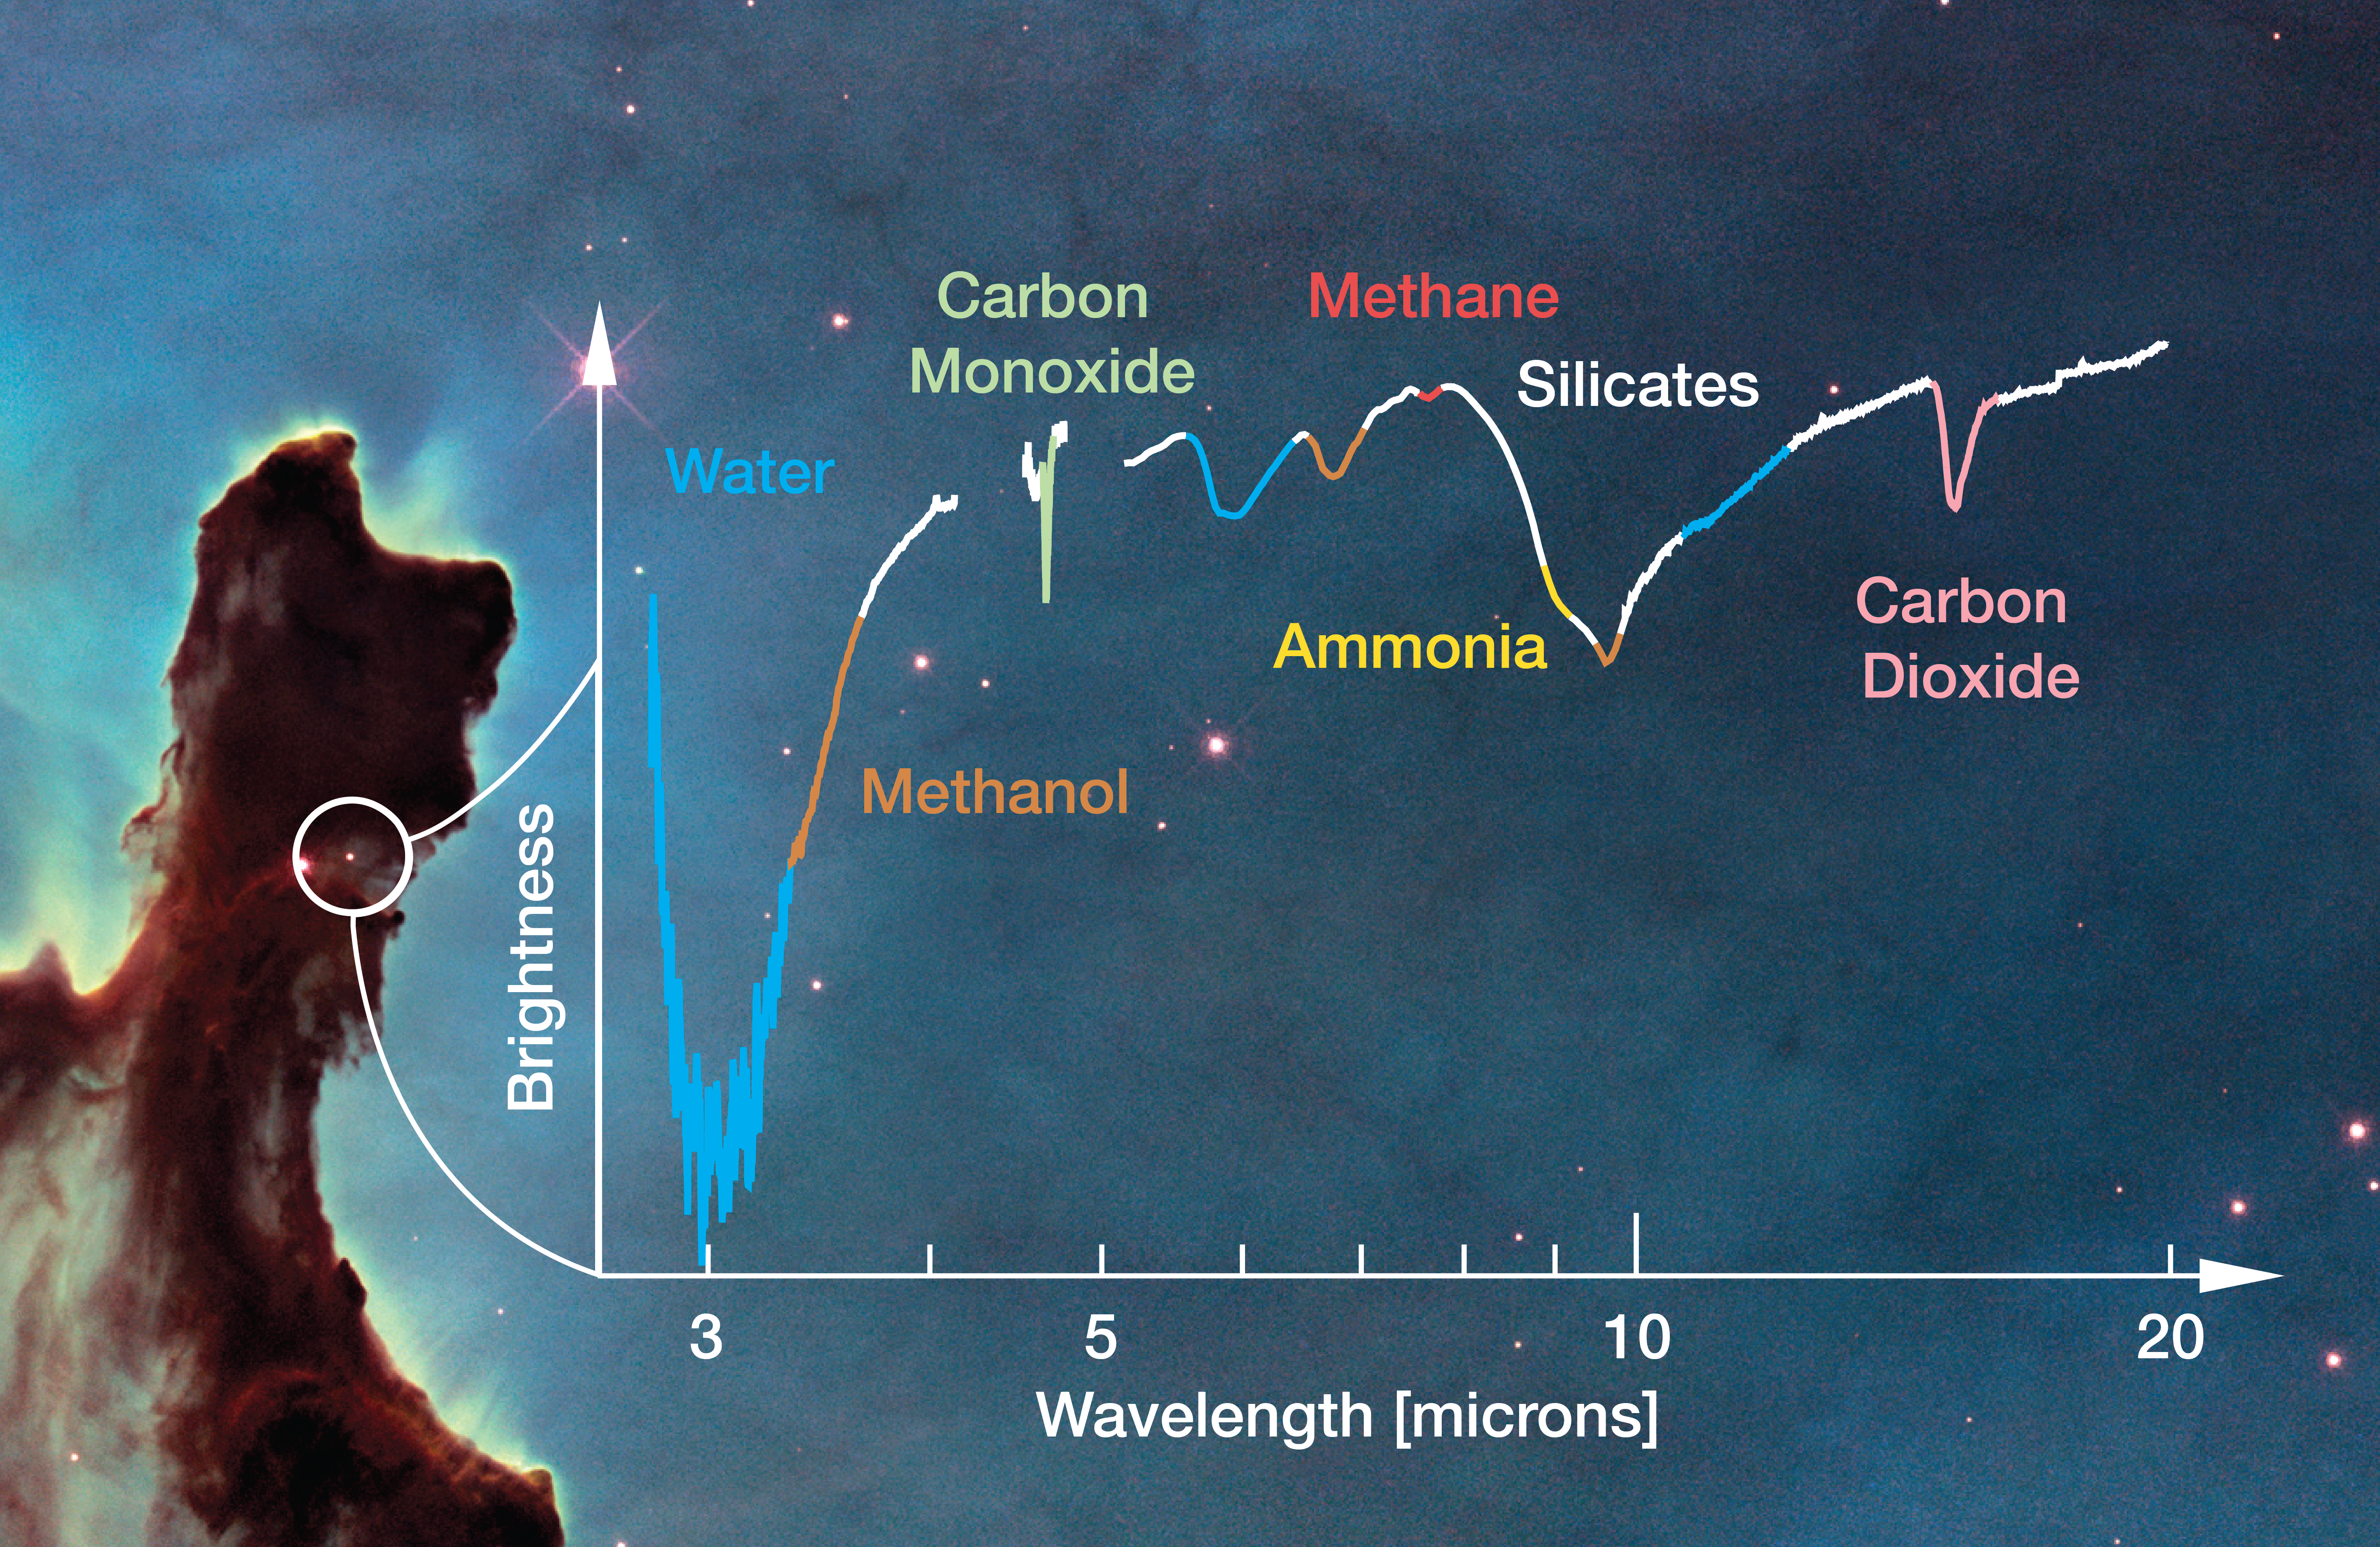
This simulated spectrum from the Webb telescope illustrates molecules that may be detected in star-forming regions like the Eagle Nebula.
This graph is overlaid on an image of one dusty pillar, or elephant trunk-like shape, of the Eagle Nebula. This part of the nebula appears as a mostly opaque, brown column against a blue-green background toward the left. A white circle highlights a bright pink star within the dark brown dust cloud, and two white lines are attached to the vertical y-axis of the graph.
The graph, known as a spectrum, is plotted with brightness of light on the vertical y-axis and wavelength of light in microns on the horizontal x-axis. The y-axis is labeled “Brightness.” There are no numbers, units, or tick marks, but it is clear from the arrowhead at the top that brightness increases from bottom to top. The x-axis is labeled “Wavelength [microns]” and has labeled tick marks at 3, 5, 10, and 20 microns. The tick marks are arranged on a logarithmic scale. The x-axis shows an arrowhead pointing right, indicating increasing values.
The spectrum is represented by a jagged line with a number of prominent peaks and valleys. Portions of the line are colored and labeled to indicate the various features. From left to right:
- Water, labeled in blue, appears as a broad, deep valley (low brightness) centered around 3 microns. It appears again as a shallower valley around 6 microns, and as a short segment with a positive slope between about 11 and 12 microns.
- Methanol, labeled in orange, appears as a segment with a steep positive slope between about 3.5 and 4 microns. It appears again as very shallow valleys around 6.5 and 9.5 microns.
- Carbon monoxide, labeled in green, appears as a very narrow valley near 5 microns.
- Methane, labeled in red, appears as a subtle valley around 7.5 microns.
- Ammonia, labeled in yellow, appears as short segment with a steep negative slope between about 8.5 and 9 microns.
- Silicates, labeled in white, appear along a number of segments of the spectrum, between other features.
- Carbon dioxide, labeled in pink, appears as a distinct v-shaped valley around 15 microns.
Image Alt Text
A simulated spectrum from the Webb telescope illustrates the molecules that may be detected in star-forming regions like the Eagle Nebula. It shows a spectrum plotted on a graph of brightness of light on the vertical y-axis versus wavelength of light in microns on the horizontal x-axis.
- Release DateMarch 9, 2018
- Science ReleaseNASA’s Webb Telescope to Make a Splash in Search for Interstellar Water
- CreditImage: NASA, ESA, Hubble Heritage Project, Michael McClare (University of Amsterdam), A. Boogert (UH Manoa)
Related Images & Videos
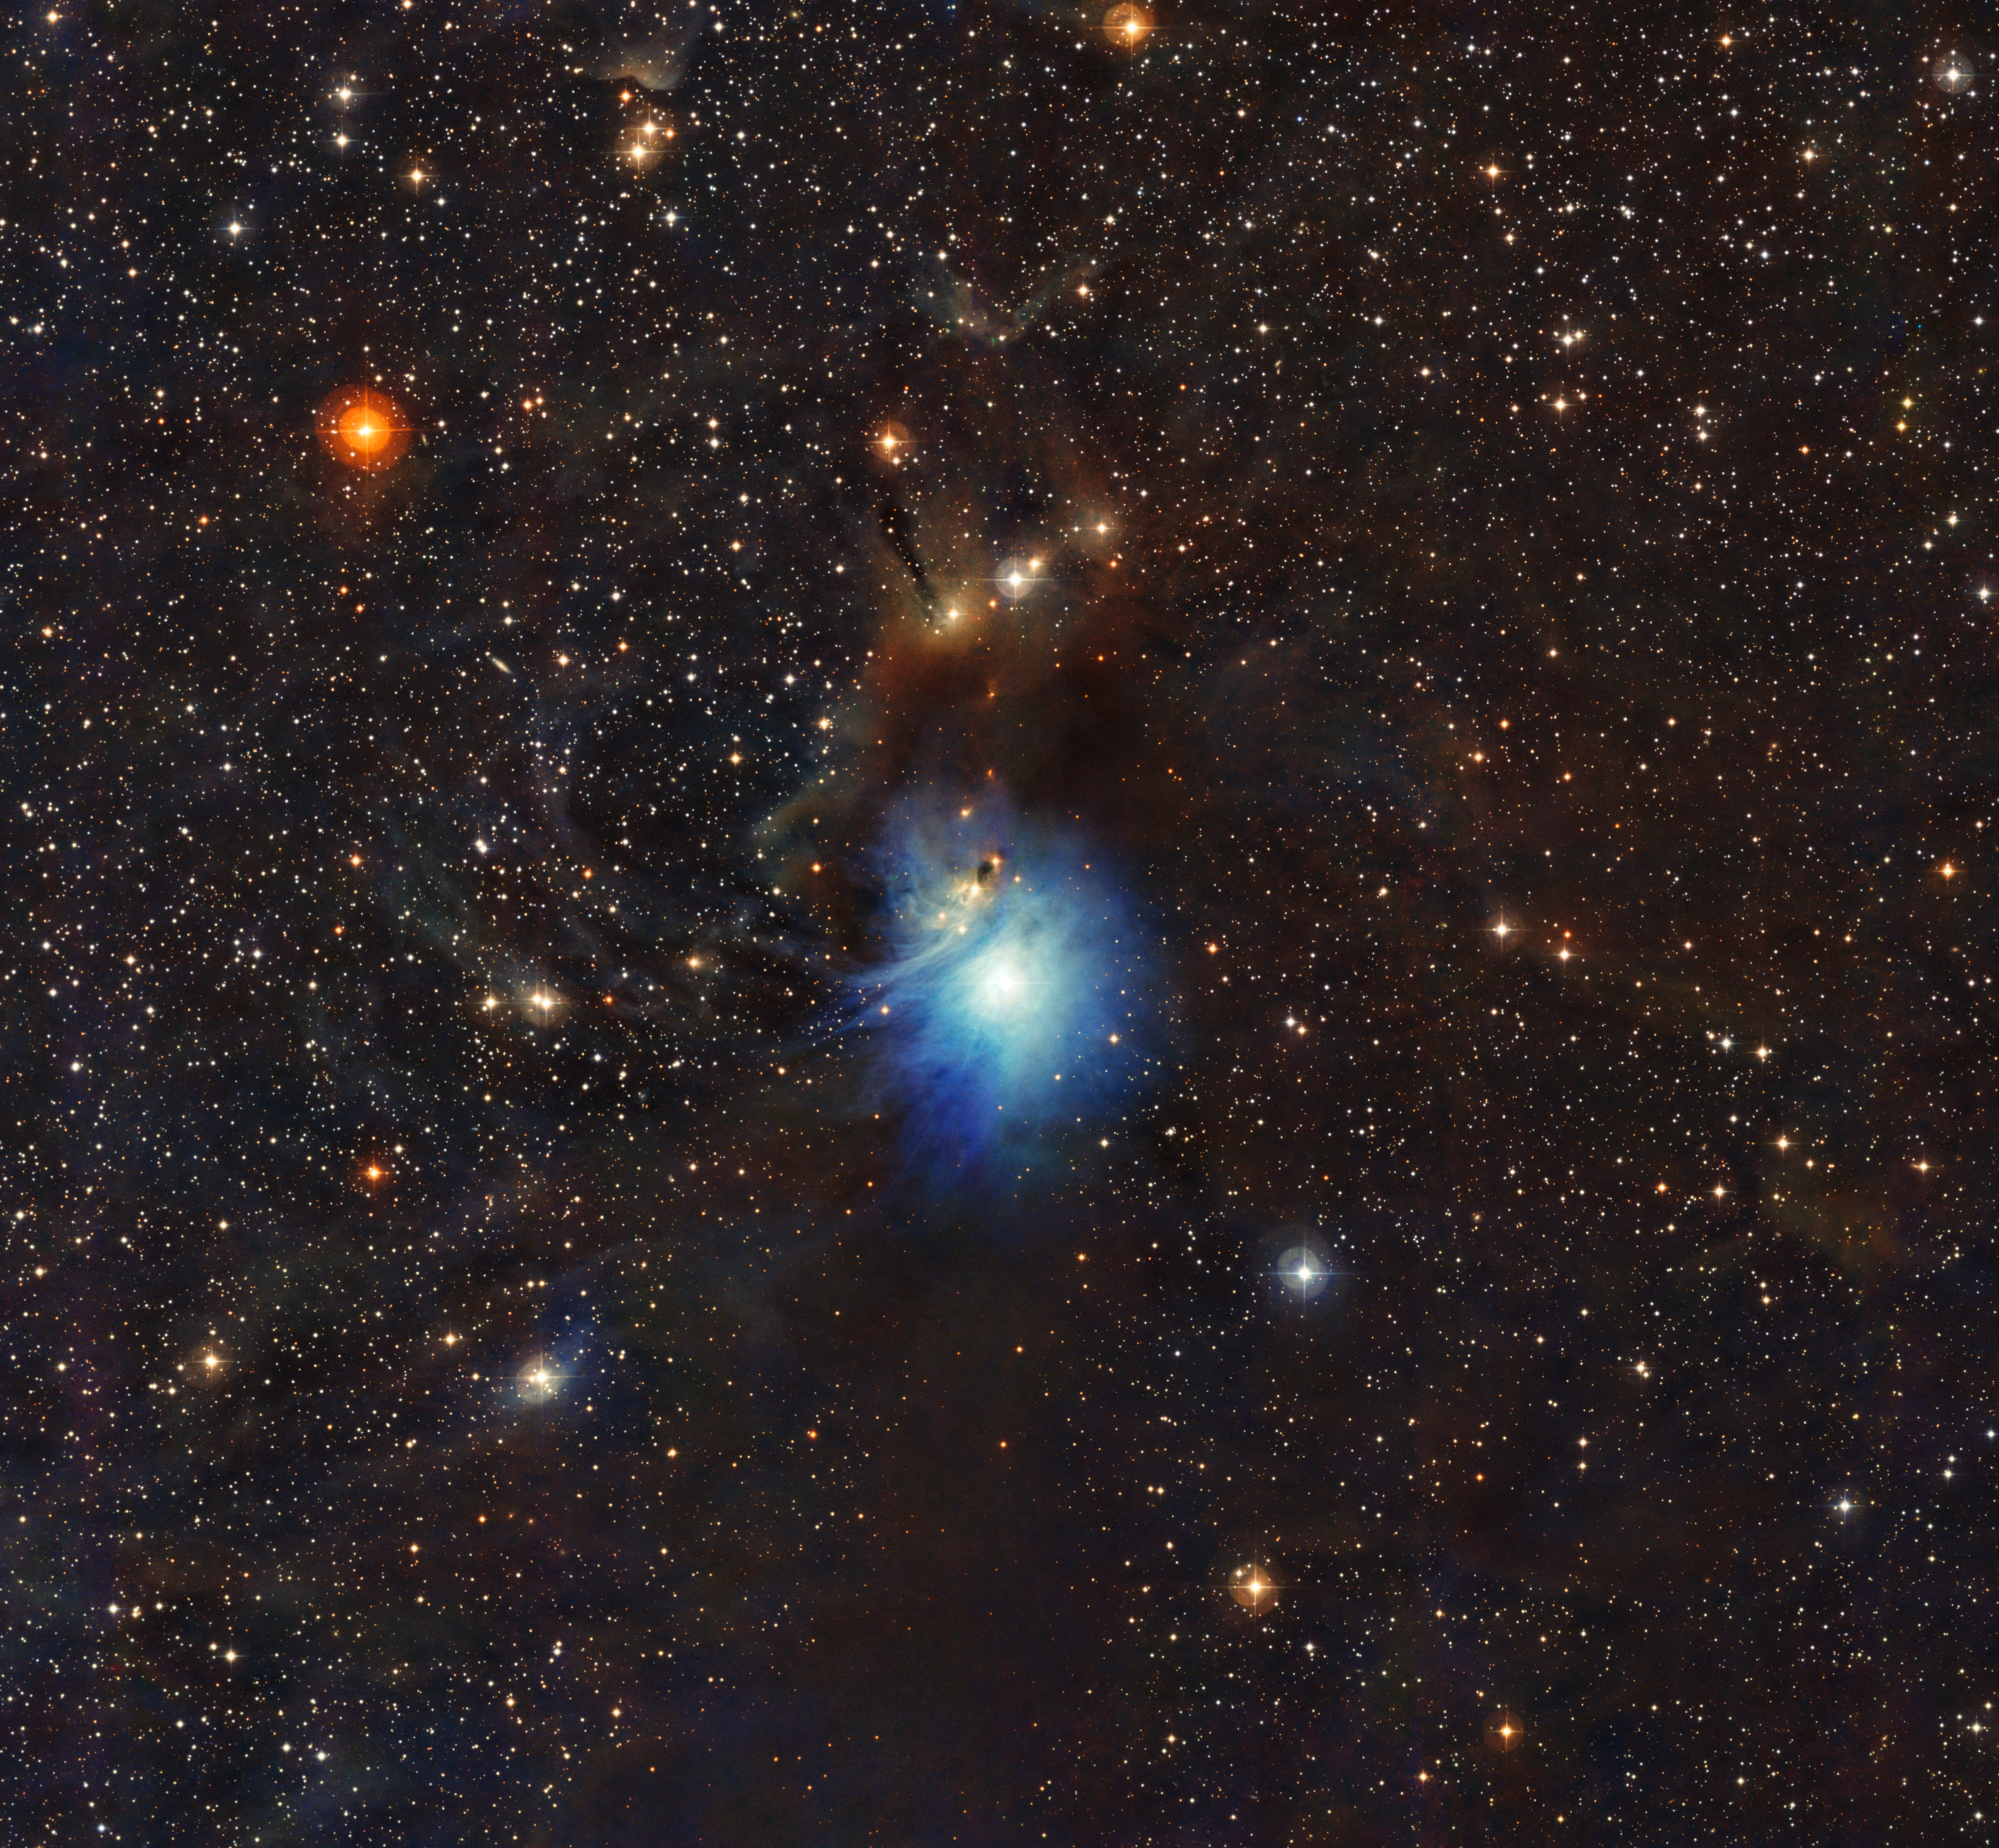
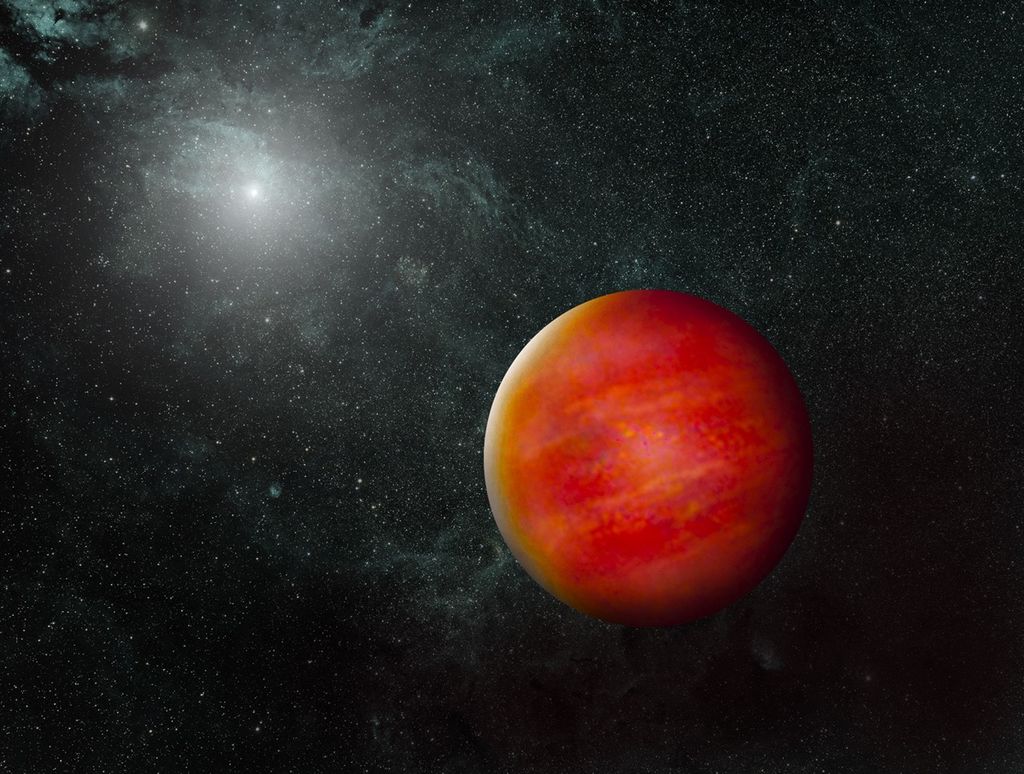
Reflection Nebula IC 2631 (ESO)
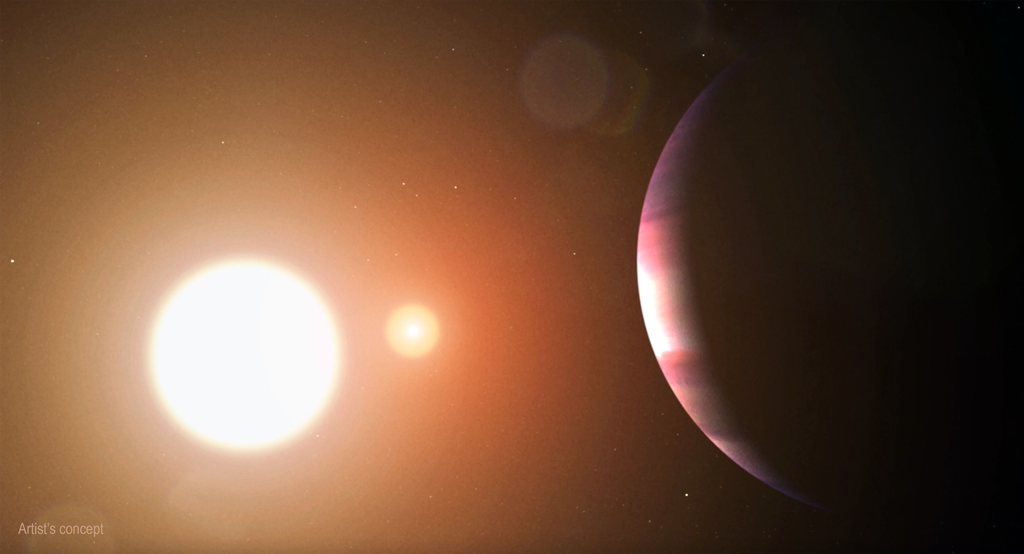
An image from the European Southern Observatory shows blue light from a newborn star lights up the reflection nebula IC 2631. This nebula is part of the Chamaeleon star-forming region, which Webb will study to learn more about the formation of water and other cosmic ices.
Share
Details
Laura Betz
NASA’s Goddard Space Flight Center
Greenbelt, Maryland
laura.e.betz@nasa.gov
NASA, ESA, Hubble Heritage Project, Michael McClare (University of Amsterdam), A. Boogert (UH Manoa)


