


1 min read
Stephan’s Quintet (MIRI Spectra)
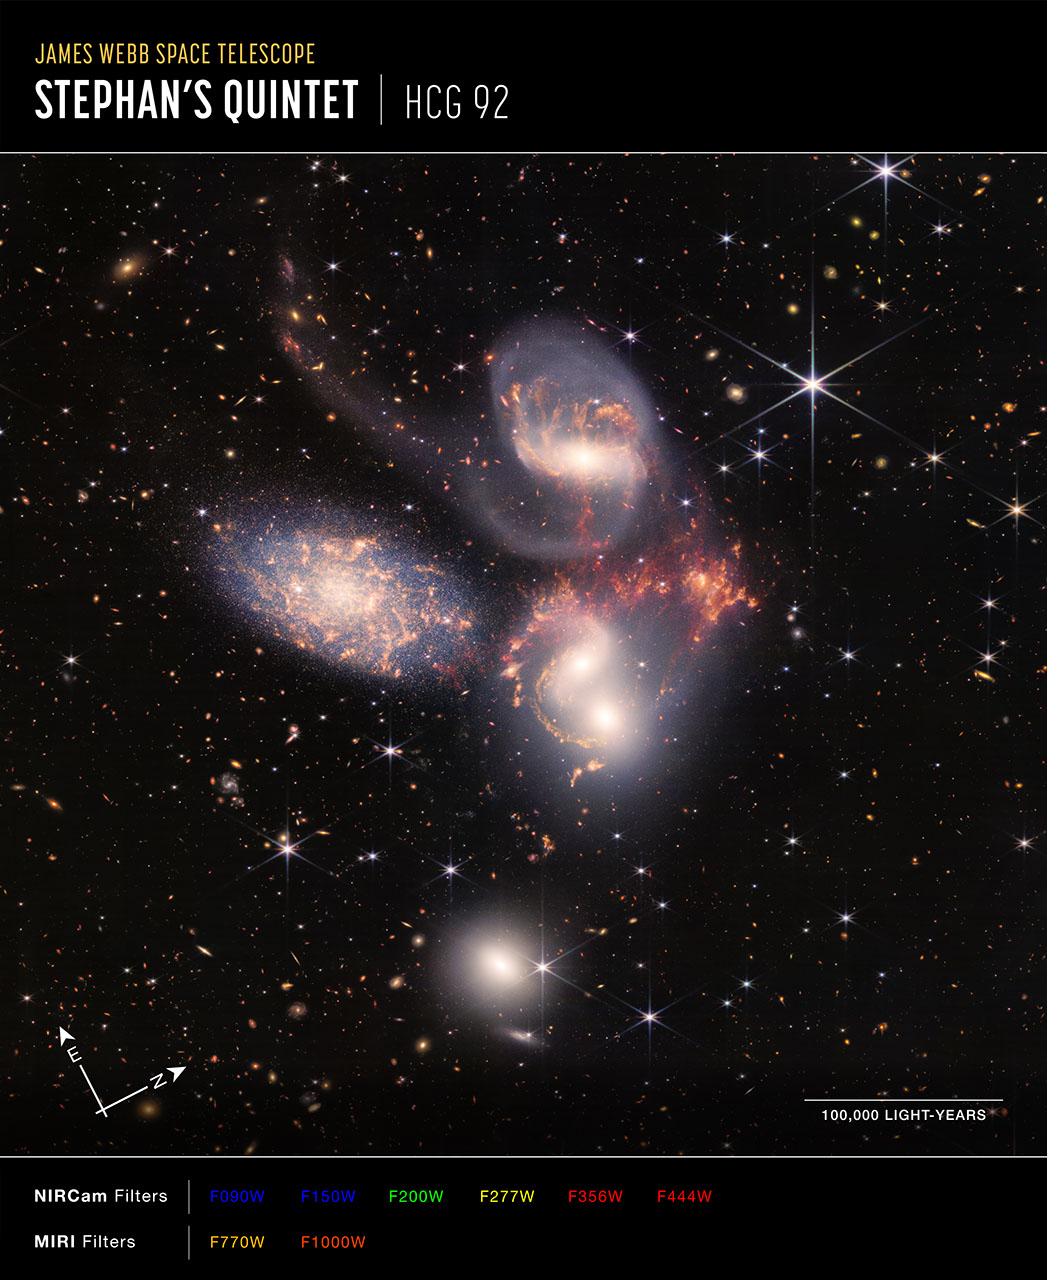
Stephan’s Quintet is a visual grouping of five galaxies located in the constellation Pegasus. Together, they are also known as the Hickson Compact Group 92 (HCG 92). Although called a “quintet,” only four of the galaxies are truly close together and caught up in a cosmic dance. The fifth and leftmost galaxy, called NGC 7320, is well in the foreground compared with the other four.
Tight groups like this may have been more common in the early universe when their superheated, infalling material may have fueled very energetic black holes called quasars. Even today, the topmost galaxy in the group – NGC 7319 – harbors an active galactic nucleus, a supermassive black hole 24 million times the mass of the Sun. It is actively pulling in material and puts out light energy equivalent to 40 billion Suns.
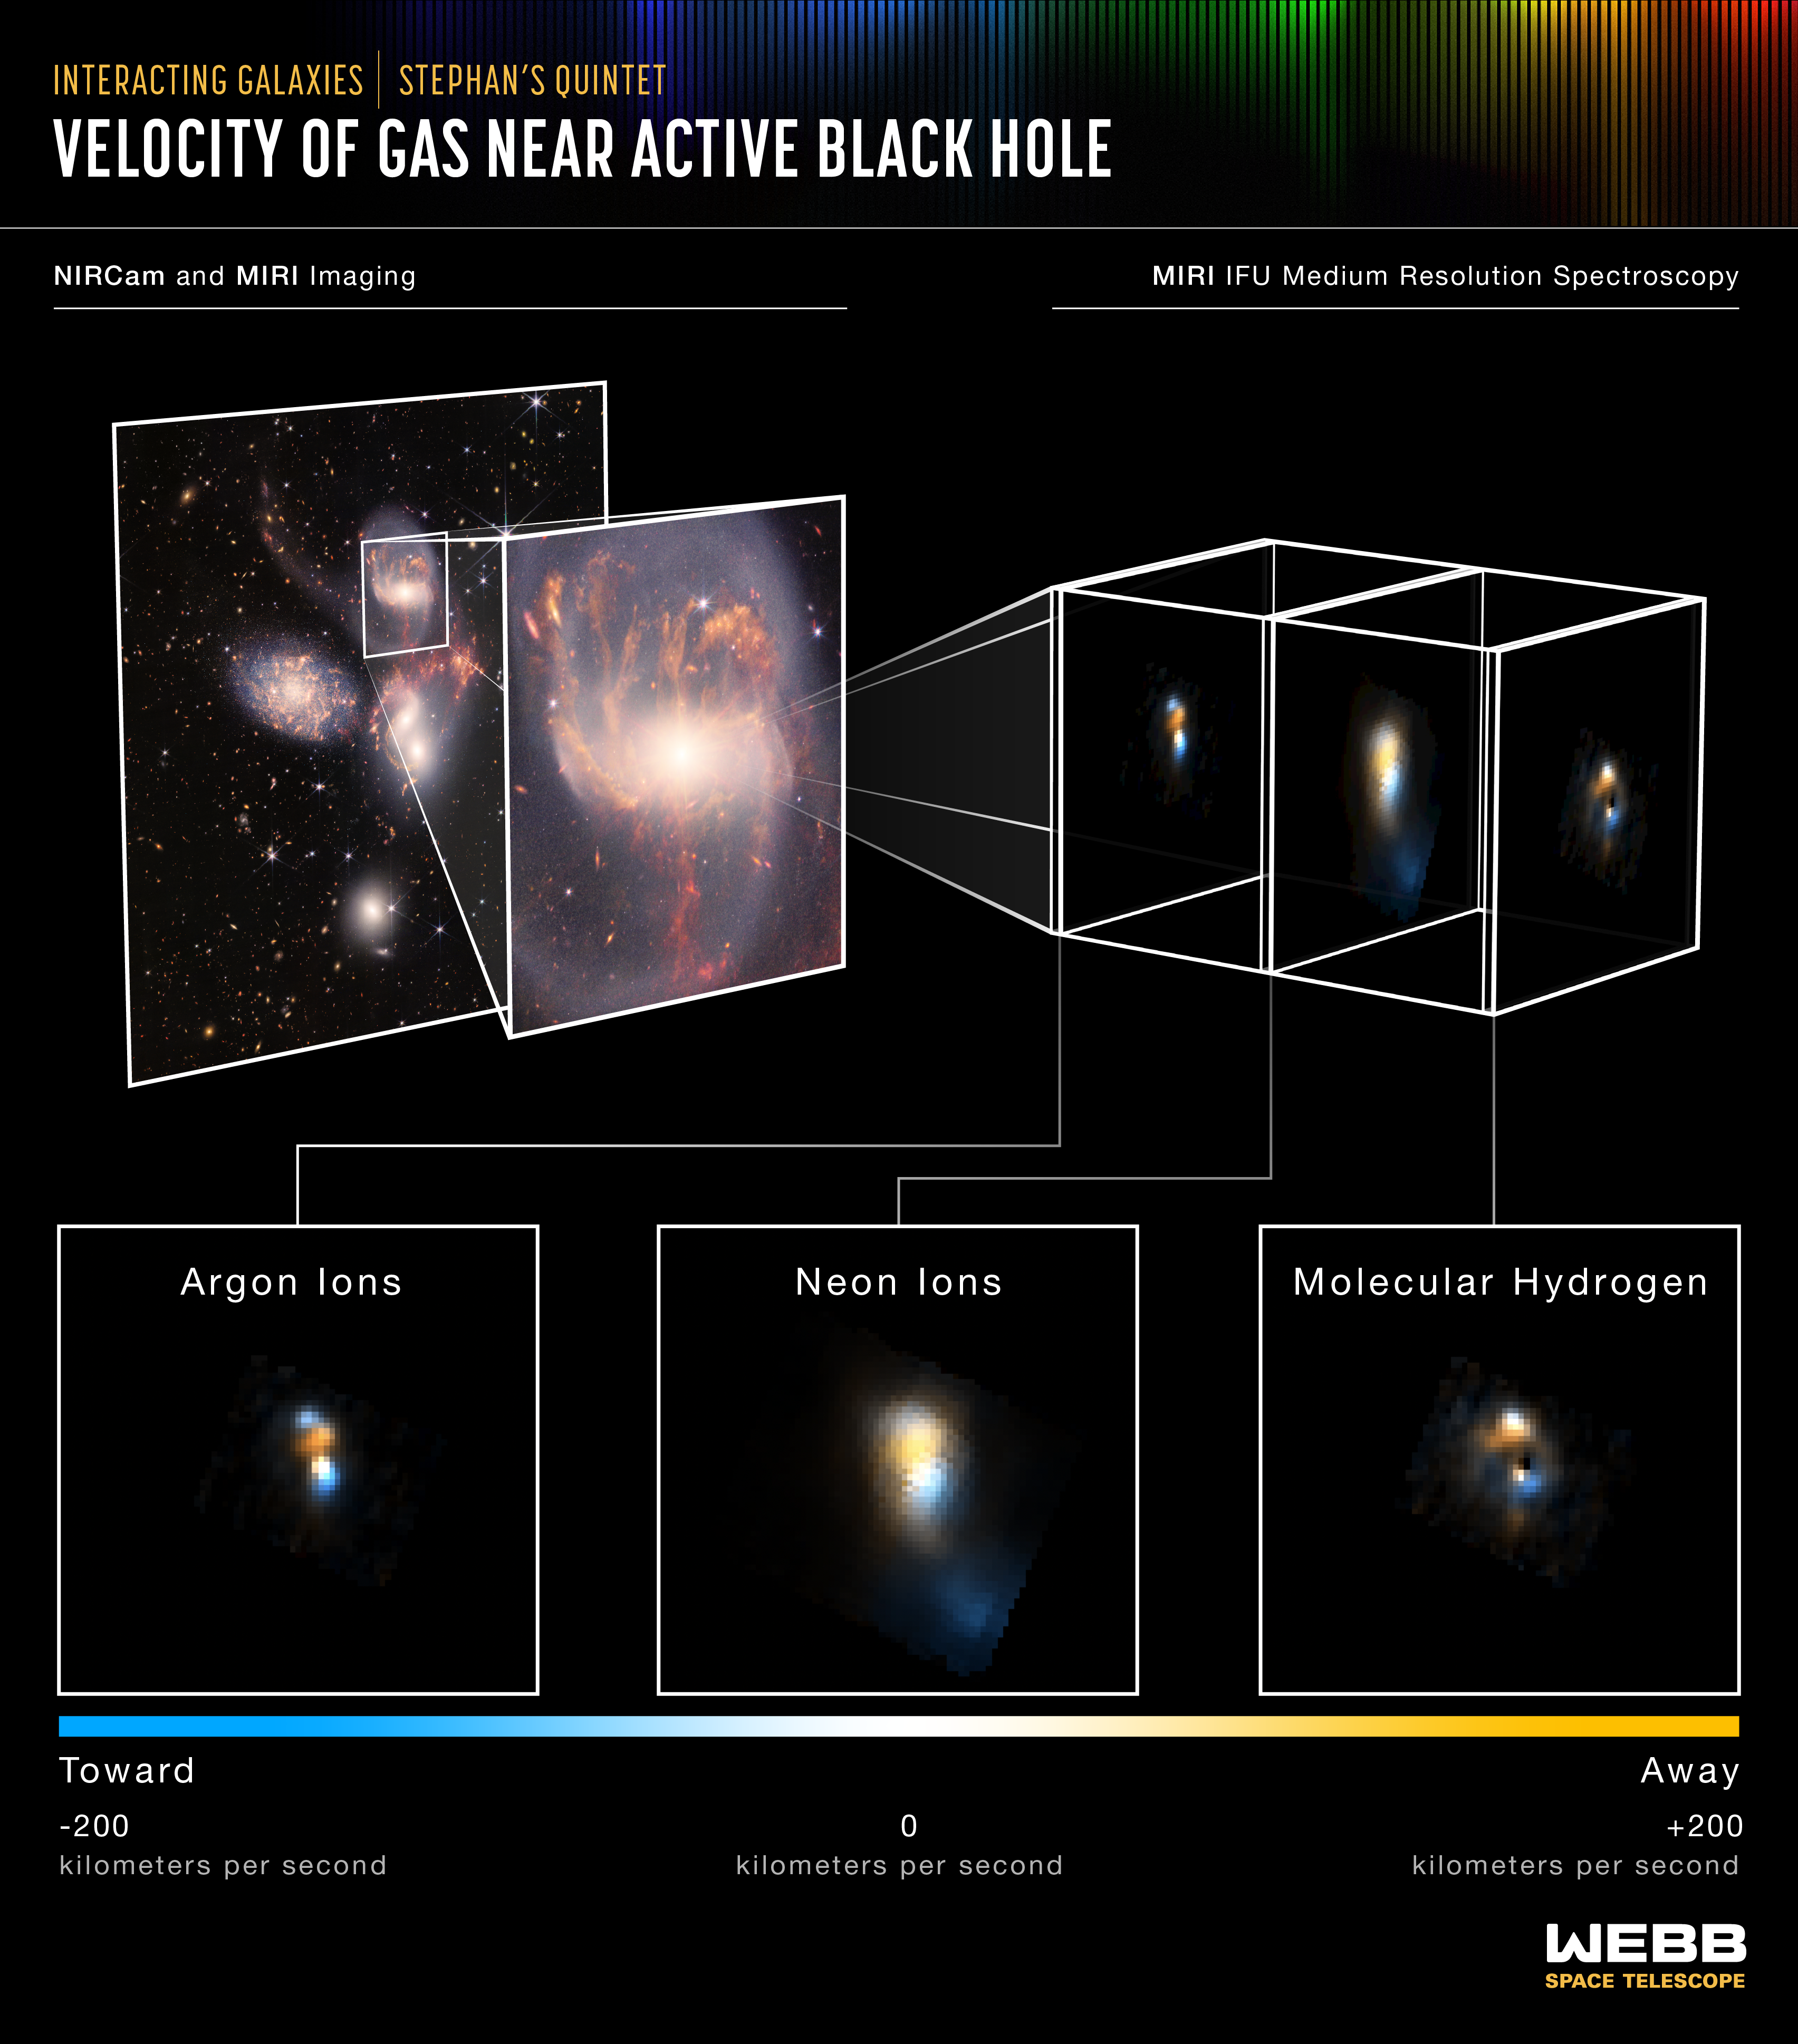
Scientists using NASA’s James Webb Space Telescope studied the active galactic nucleus in great detail with the Medium-Resolution Spectrometer (MRS) that is part of the Mid-Infrared Instrument (MIRI). The spectrometer features integral field units (IFUs) – a combination of a camera and spectrograph. These IFUs provided the Webb team with a “data cube,” or collection of images of the galactic core’s spectral features.
Using IFUs, scientists can measure spatial structures, determine the velocity of those structures, and get a full range of spectral data. Much like medical magnetic resonance imaging (MRI), the IFUs allow scientists to “slice and dice” the information into many images for detailed study.
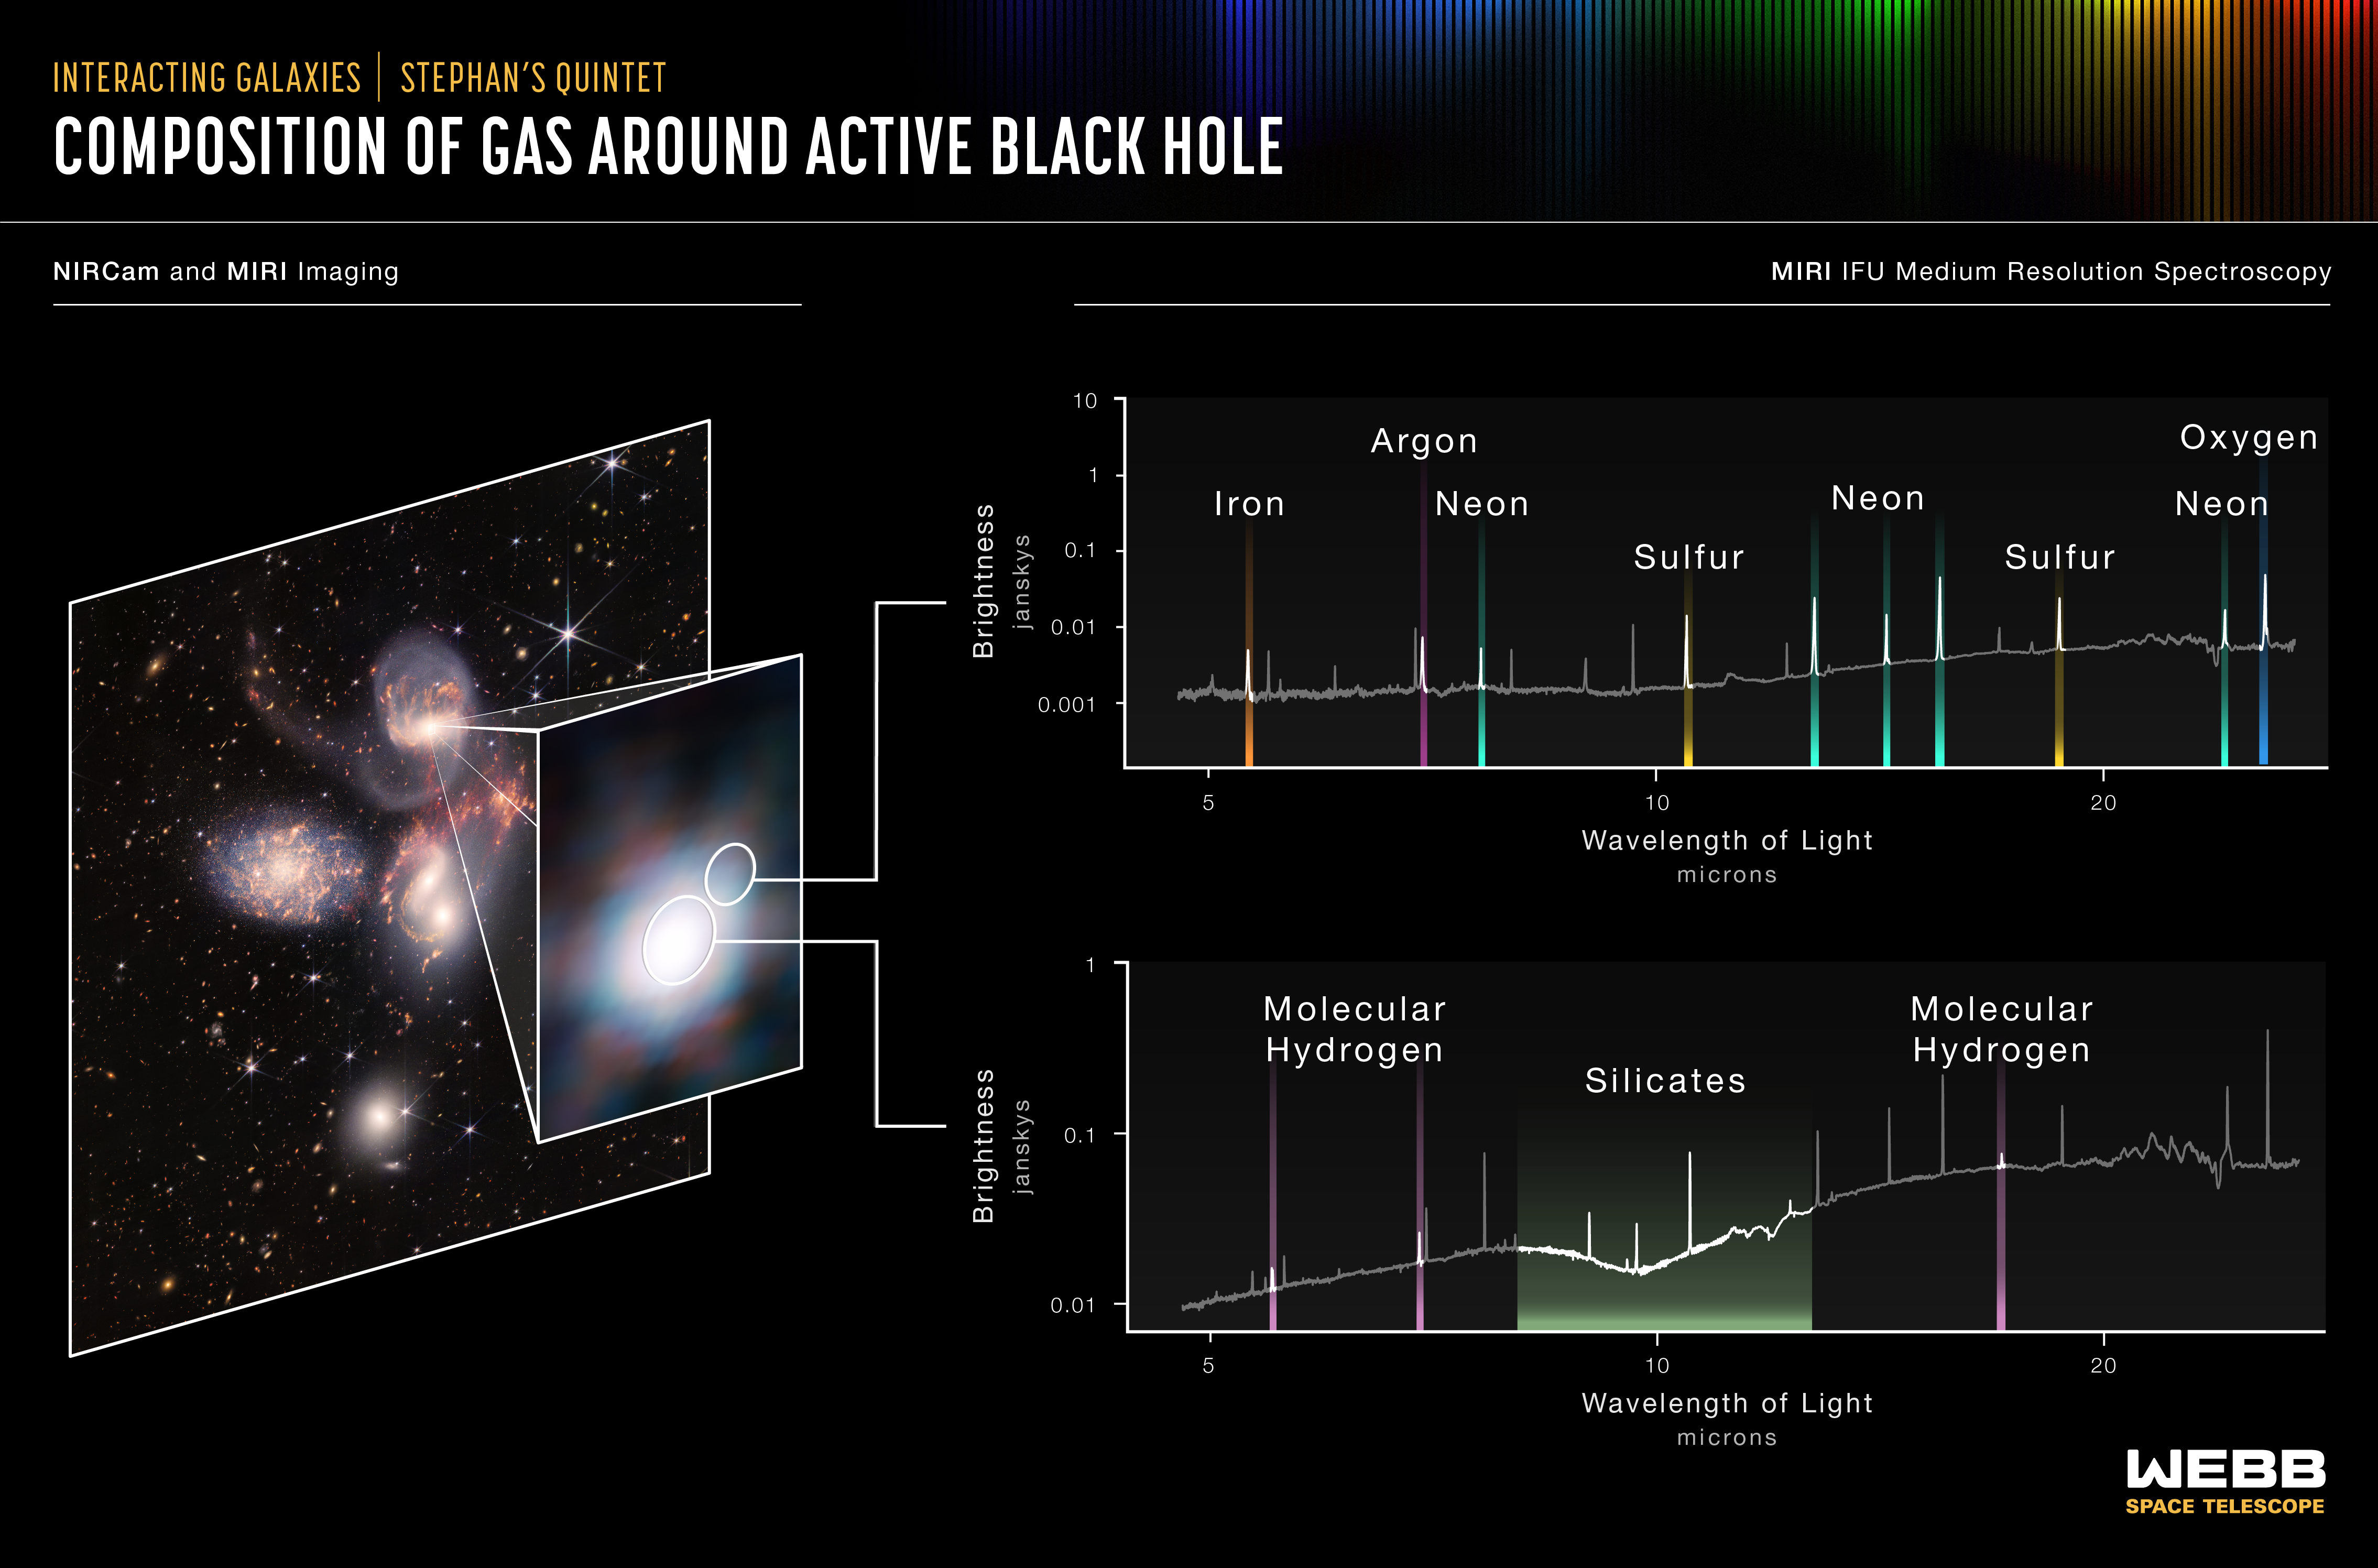
MIRI’s MRS pierced through the shroud of dust near the active galactic nucleus to measure the bright emission from nearby hot gas that is being ionized by powerful winds and radiation from the black hole. The instrument saw the gas near the supermassive black hole at a level of detail never seen before, and it was able to determine its composition.
When a supermassive black hole feeds, some of the infalling material becomes very hot and is pushed away from the black hole in the form of winds and jets. MIRI probed many different regions, including the black hole’s outflowing wind – indicated by the smaller circle – and the area immediately around the black hole itself – indicated by the larger circle. It showed that the black hole is enshrouded in silicate dust similar to beach sand, but with much smaller grains.
The top spectrum, from the black hole’s outflow, shows a region filled with hot, ionized gases, including iron, argon, neon, sulfur and oxygen as denoted by the peaks at given wavelengths. The presence of multiple emission lines from the same element with different degrees of ionization is valuable for understanding the properties and origins of the outflow.
The bottom spectrum reveals that the supermassive black hole has a reservoir of colder, denser gas with large quantities of molecular hydrogen and silicate dust that absorb the light from the central regions of the galaxy.
MIRI was contributed by ESA and NASA, with the instrument designed and built by a consortium of nationally funded European Institutes (The MIRI European Consortium) in partnership with JPL and the University of Arizona.
For a full array of Webb’s first images and spectra, including downloadable files, please visit: https://webbtelescope.org/news/first-images
Extended Description and Image Alt Text
Extended Description
Infographic titled “Interacting Galaxies Stephan’s Quintet: Composition of Gas Around Active Black Hole; NIRCam and MIRI Imaging and MIRI IFU Medium Resolution Spectroscopy.”
On the left side are two reference images of a group of galaxies. On the right are two emission spectra: jagged line graphs of brightness versus wavelength. The peaks on the graphs are labeled with the names of various elements and compounds.
Right Side: Reference Images
An oblique view of a NIRCam/MIRI composite image shows a group of galaxies of different shapes on a background of numerous smaller (more distant) galaxies. A zoom-in of the bright central core of the spiral galaxy at the top of the group is pulled out. The pull-out zoom has two circular outlines: a large circle at the center of the bright white core and a smaller circle at the upper right edge of the bright core.
Left Side: Graphs
Two spectra are shown as graphs of brightness in janskys on the vertical y-axis versus wavelength of light in microns on the horizontal x-axis. The graphs are stacked and aligned vertically for easy comparison. Connector lines indicate the parts of the image (and the parts of the galaxy core) that each spectrum is related to.
Axes
On both graphs, the x-axis has a log scale that ranges from just less than 5 microns to more than 25 microns, with labeled tick marks at 5, 10, and 20 microns.
On the top graph, which shows the spectrum emitted at the edge of the galaxy core, the y-axis has a log scale that ranges from 0.001 janskys at the origin to 10 janskys at the top, with labeled tick marks at 0.01, 0.1, 1, and 10.
On the bottom graph, which shows the spectrum of light emitted from the core of the galaxy, the y-axis has a log scale that ranges from 0.01 janskys just above the origin to 1 jansky at the top, with labeled tick marks at 0.01, 0.1, and 1.
Data
Both graphs show jagged lines with many prominent spike-like peaks. Some are taller than others. The pattern of peaks (the wavelengths locations of the peaks) are the same on both graphs. The overall shape of the line is slightly different between the two graphs. Different peaks are labeled.
On the top graph, which shows the spectrum emitted at the edge of the galaxy core, ten peaks are labeled with the element that is emitting that wavelength of light. From left to right (shorter to longer wavelength) the peaks are: iron, argon, neon, sulfur, neon, neon, neon, sulfur, neon, and oxygen. Each peak is also highlighted in a color. Peaks of the same element are highlighted the same color. Iron is highlighted in orange; argon in purple; neon in green; sulfur in yellow; and oxygen in blue. In between the labeled peaks are many other unlabeled peaks.
On the bottom graph, which shows the spectrum of light emitted from the core of the galaxy, three peaks and one broad band are labeled. From left to right (shorter to longer wavelength), they are: a peak for molecular hydrogen, a peak for molecular hydrogen, a broad valley for silicates, and a peak for molecular hydrogen. All three of the molecular hydrogen peaks are highlighted in light purple. The band for silicates is highlighted in light green.
Although the locations of the peaks are in the same place on the two graphs, the heights of the peaks are different. The baseline (the line connecting the low points between peaks) of the graphed data is also different. On the top graph (edge of the core) the baseline is fairly flat from the left side to the middle of the graph at around 10 microns, and then slopes upward slightly to the end at the far right. On the bottom graph (middle of the core) the baseline slopes upward from left to right at an angle of about 30 degrees, with a broad dip centered around 10 microns where the silicate band is labeled.
Image Alt Text
Infographic showing the composition of gas around an active black hole
About the Object
- R.A. PositionR.A. PositionRight ascension – analogous to longitude – is one component of an object's position.22:35:57.49
- Dec. PositionDec. PositionDeclination – analogous to latitude – is one component of an object's position.33:57:36.0
- ConstellationConstellationOne of 88 recognized regions of the celestial sphere in which the object appears.Pegasus
- DistanceDistanceThe physical distance from Earth to the astronomical object. Distances within our solar system are usually measured in Astronomical Units (AU). Distances between stars are usually measured in light-years. Interstellar distances can also be measured in parsecs.290 million light-years (89 million parsecs)
About the Data
- Data DescriptionData DescriptionProposal: A description of the observations, their scientific justification, and the links to the data available in the science archive.
Science Team: The astronomers who planned the observations and analyzed the data. "PI" refers to the Principal Investigator.This image was created with Webb data from proposal 2732. It is part of Webb Early Release Observations.
The Early Release Observations and associated materials were developed, executed, and compiled by the ERO production team:
Jaclyn Barrientes, Claire Blome, Hannah Braun, Matthew Brown, Margaret Carruthers, Dan Coe, Joseph DePasquale, Nestor Espinoza, Macarena Garcia Marin, Karl Gordon, Alaina Henry, Leah Hustak, Andi James, Ann Jenkins, Anton Koekemoer, Stephanie LaMassa, David Law, Alexandra Lockwood, Amaya Moro-Martin, Susan Mullally, Alyssa Pagan, Dani Player, Klaus Pontoppidan, Charles Proffitt, Christine Pulliam, Leah Ramsay, Swara Ravindranath, Neill Reid, Massimo Robberto, Elena Sabbi, Leonardo Ubeda.
The EROs were also made possible by the foundational efforts and support from the JWST instruments, STScI planning and scheduling, Data Management teams, and Office of Public Outreach.
- InstrumentInstrumentThe science instrument used to produce the data.NIRCam, MIRI
- Object NameObject NameA name or catalog number that astronomers use to identify an astronomical object.Stephan’s Quintet, Hickson Compact Group (HCG) 92
- Object DescriptionObject DescriptionThe type of astronomical object.Interacting Galaxy Group
- Release DateJuly 12, 2022
- Science ReleaseNASA’s Webb Sheds Light on Galaxy Evolution, Black Holes
- CreditImage: NASA, ESA, CSA, STScI
Related Images & Videos
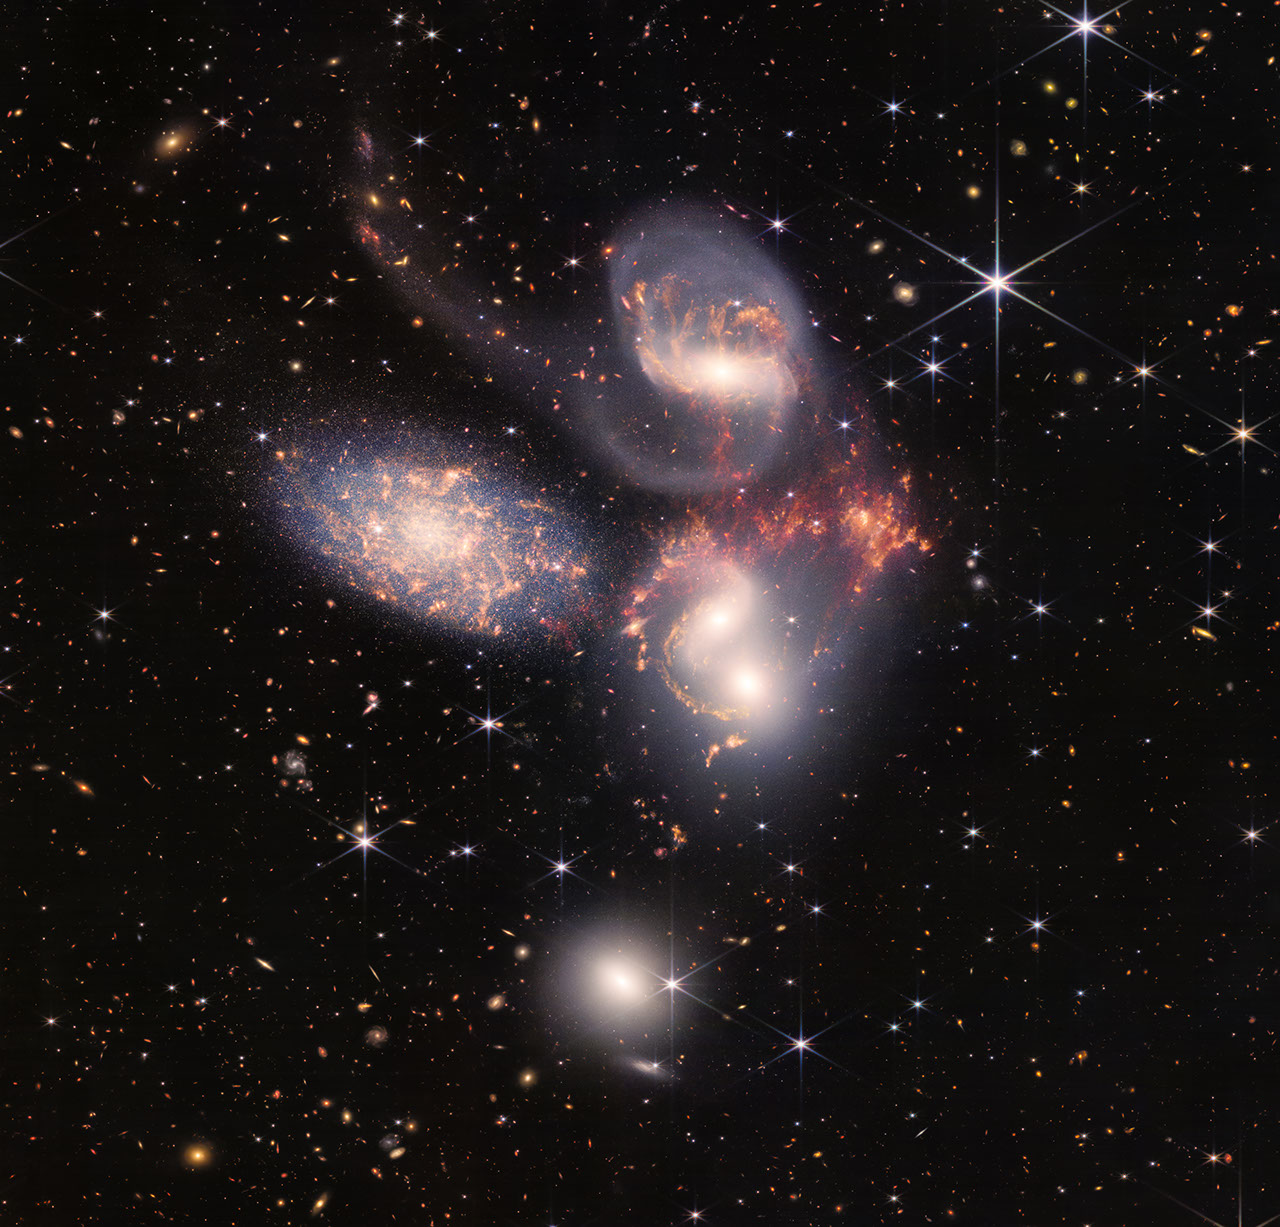
Stephan's Quintet (NIRCam and MIRI Composite Image)
An enormous mosaic of Stephan’s Quintet is the largest image to date from NASA’s James Webb Space Telescope, covering about one-fifth of the Moon’s diameter. It contains over 150 million pixels and is constructed from almost 1,000 separate image files. The visual grouping of...
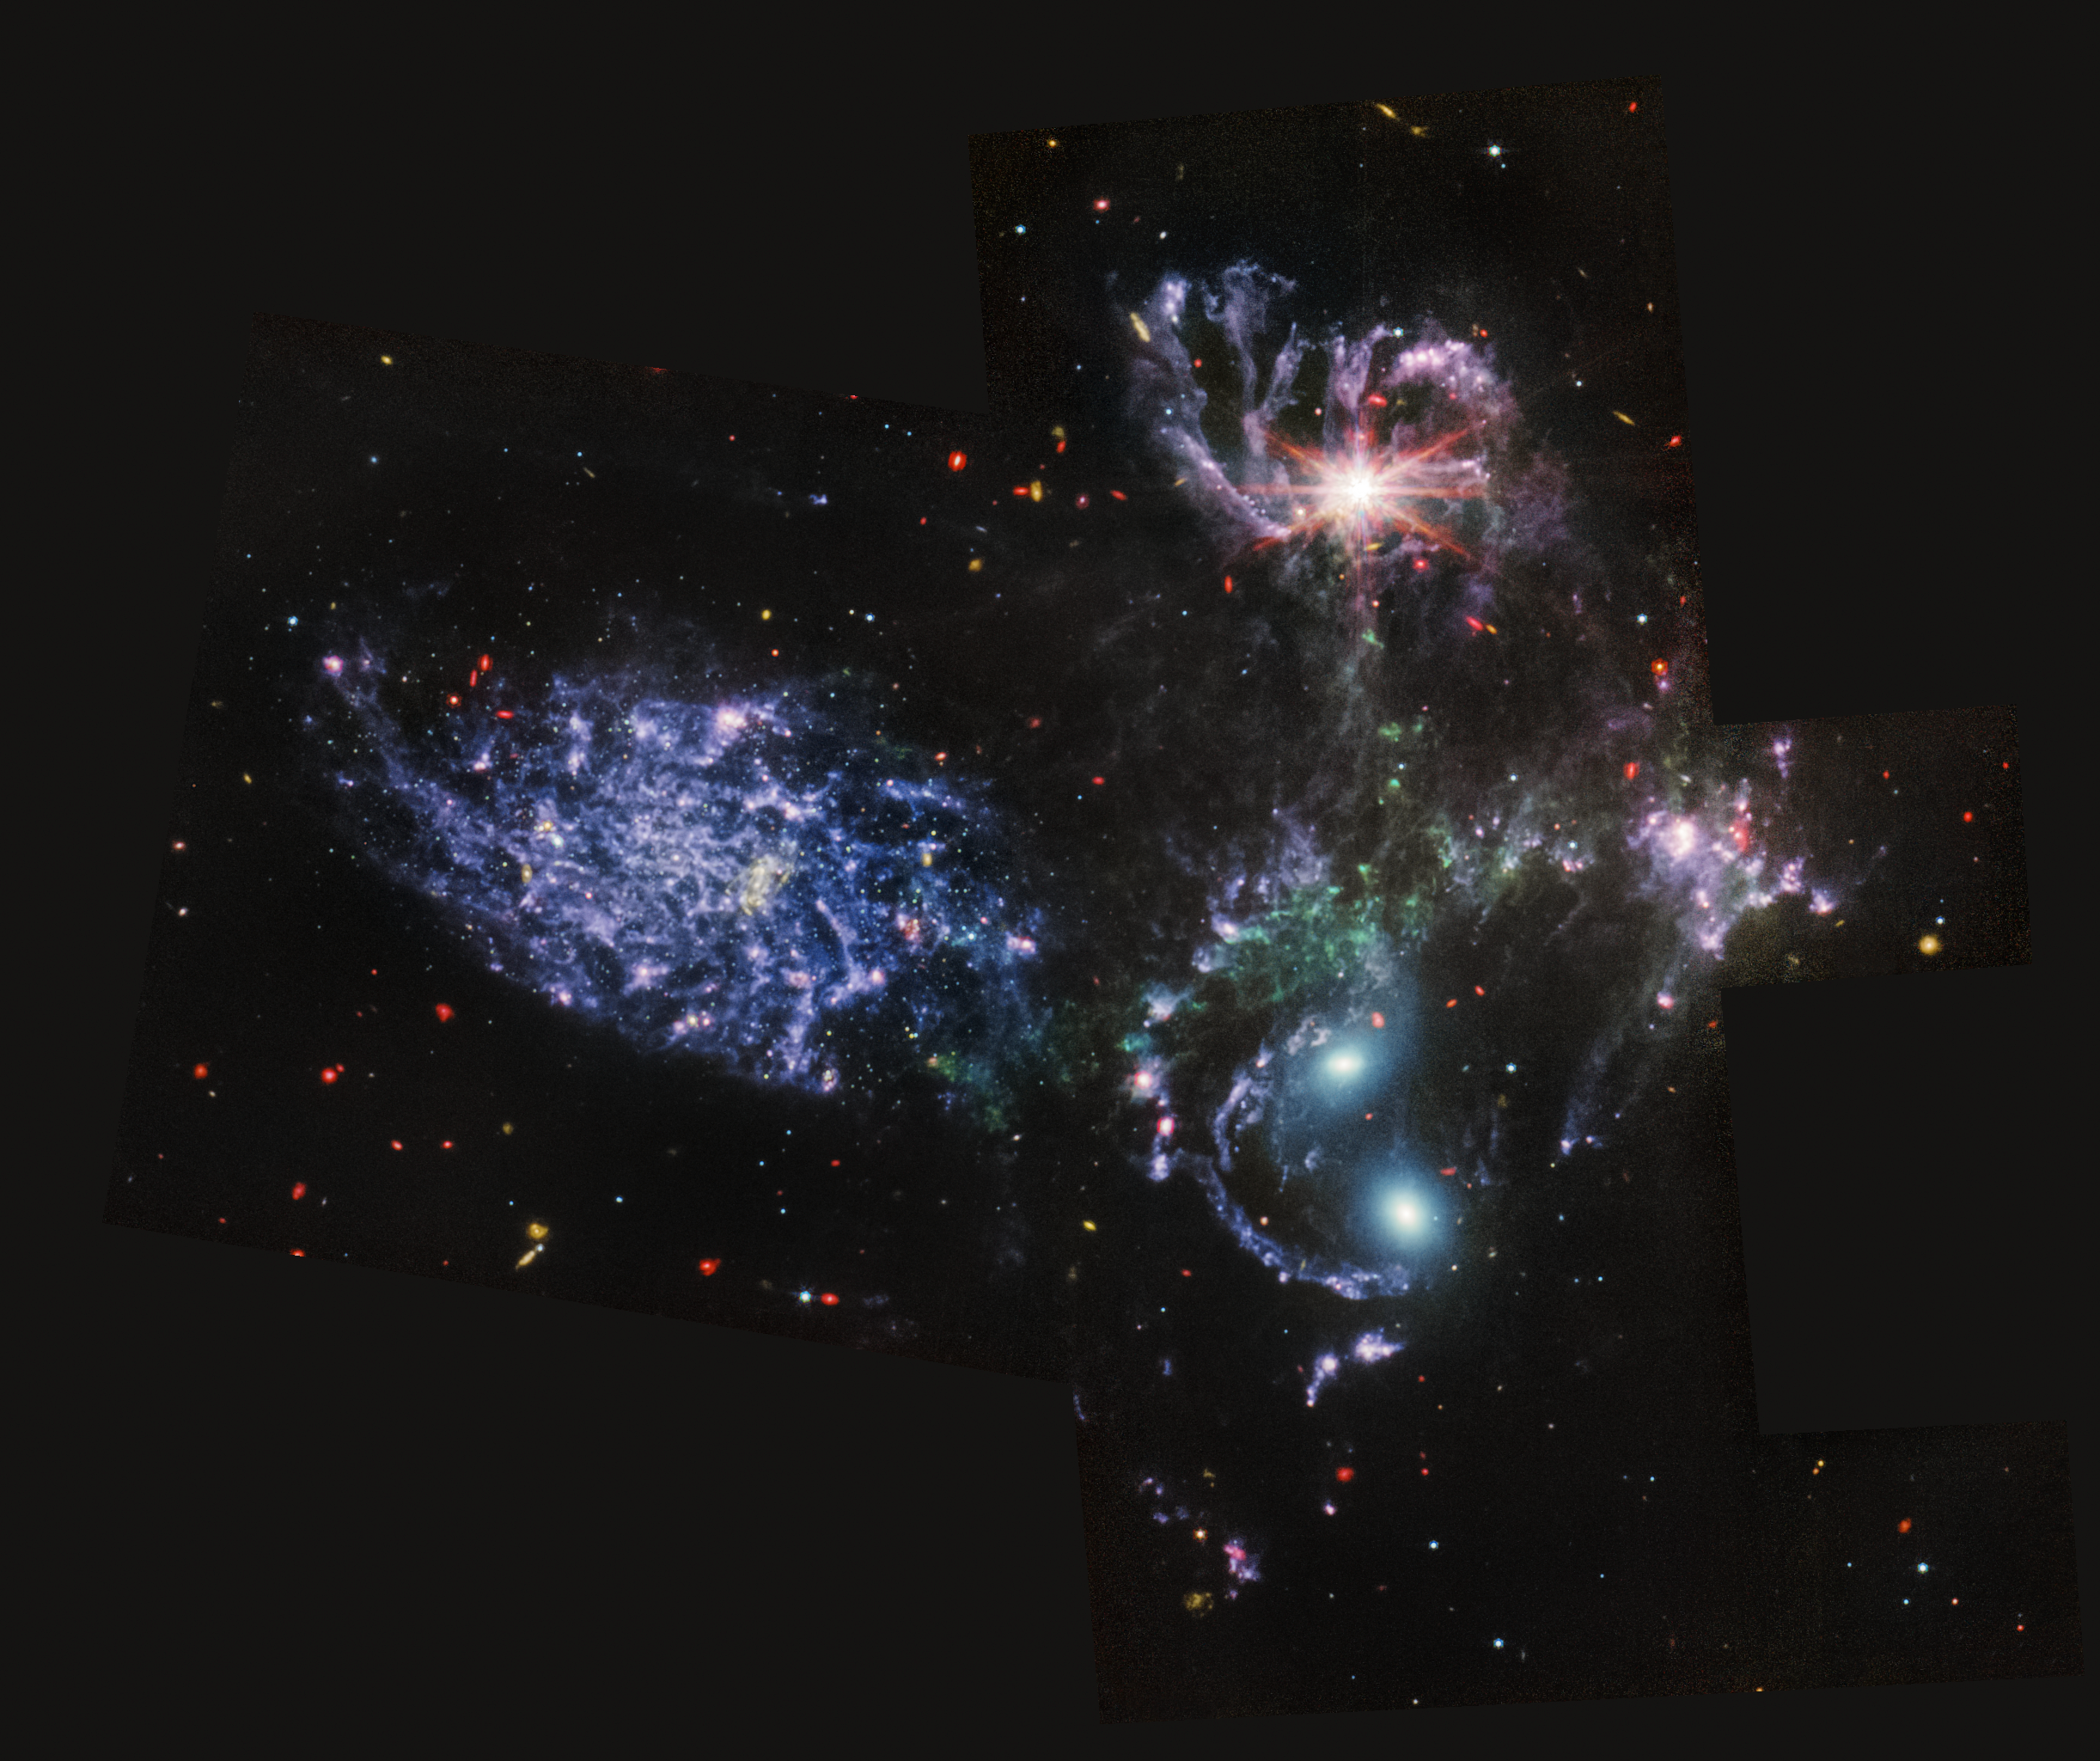
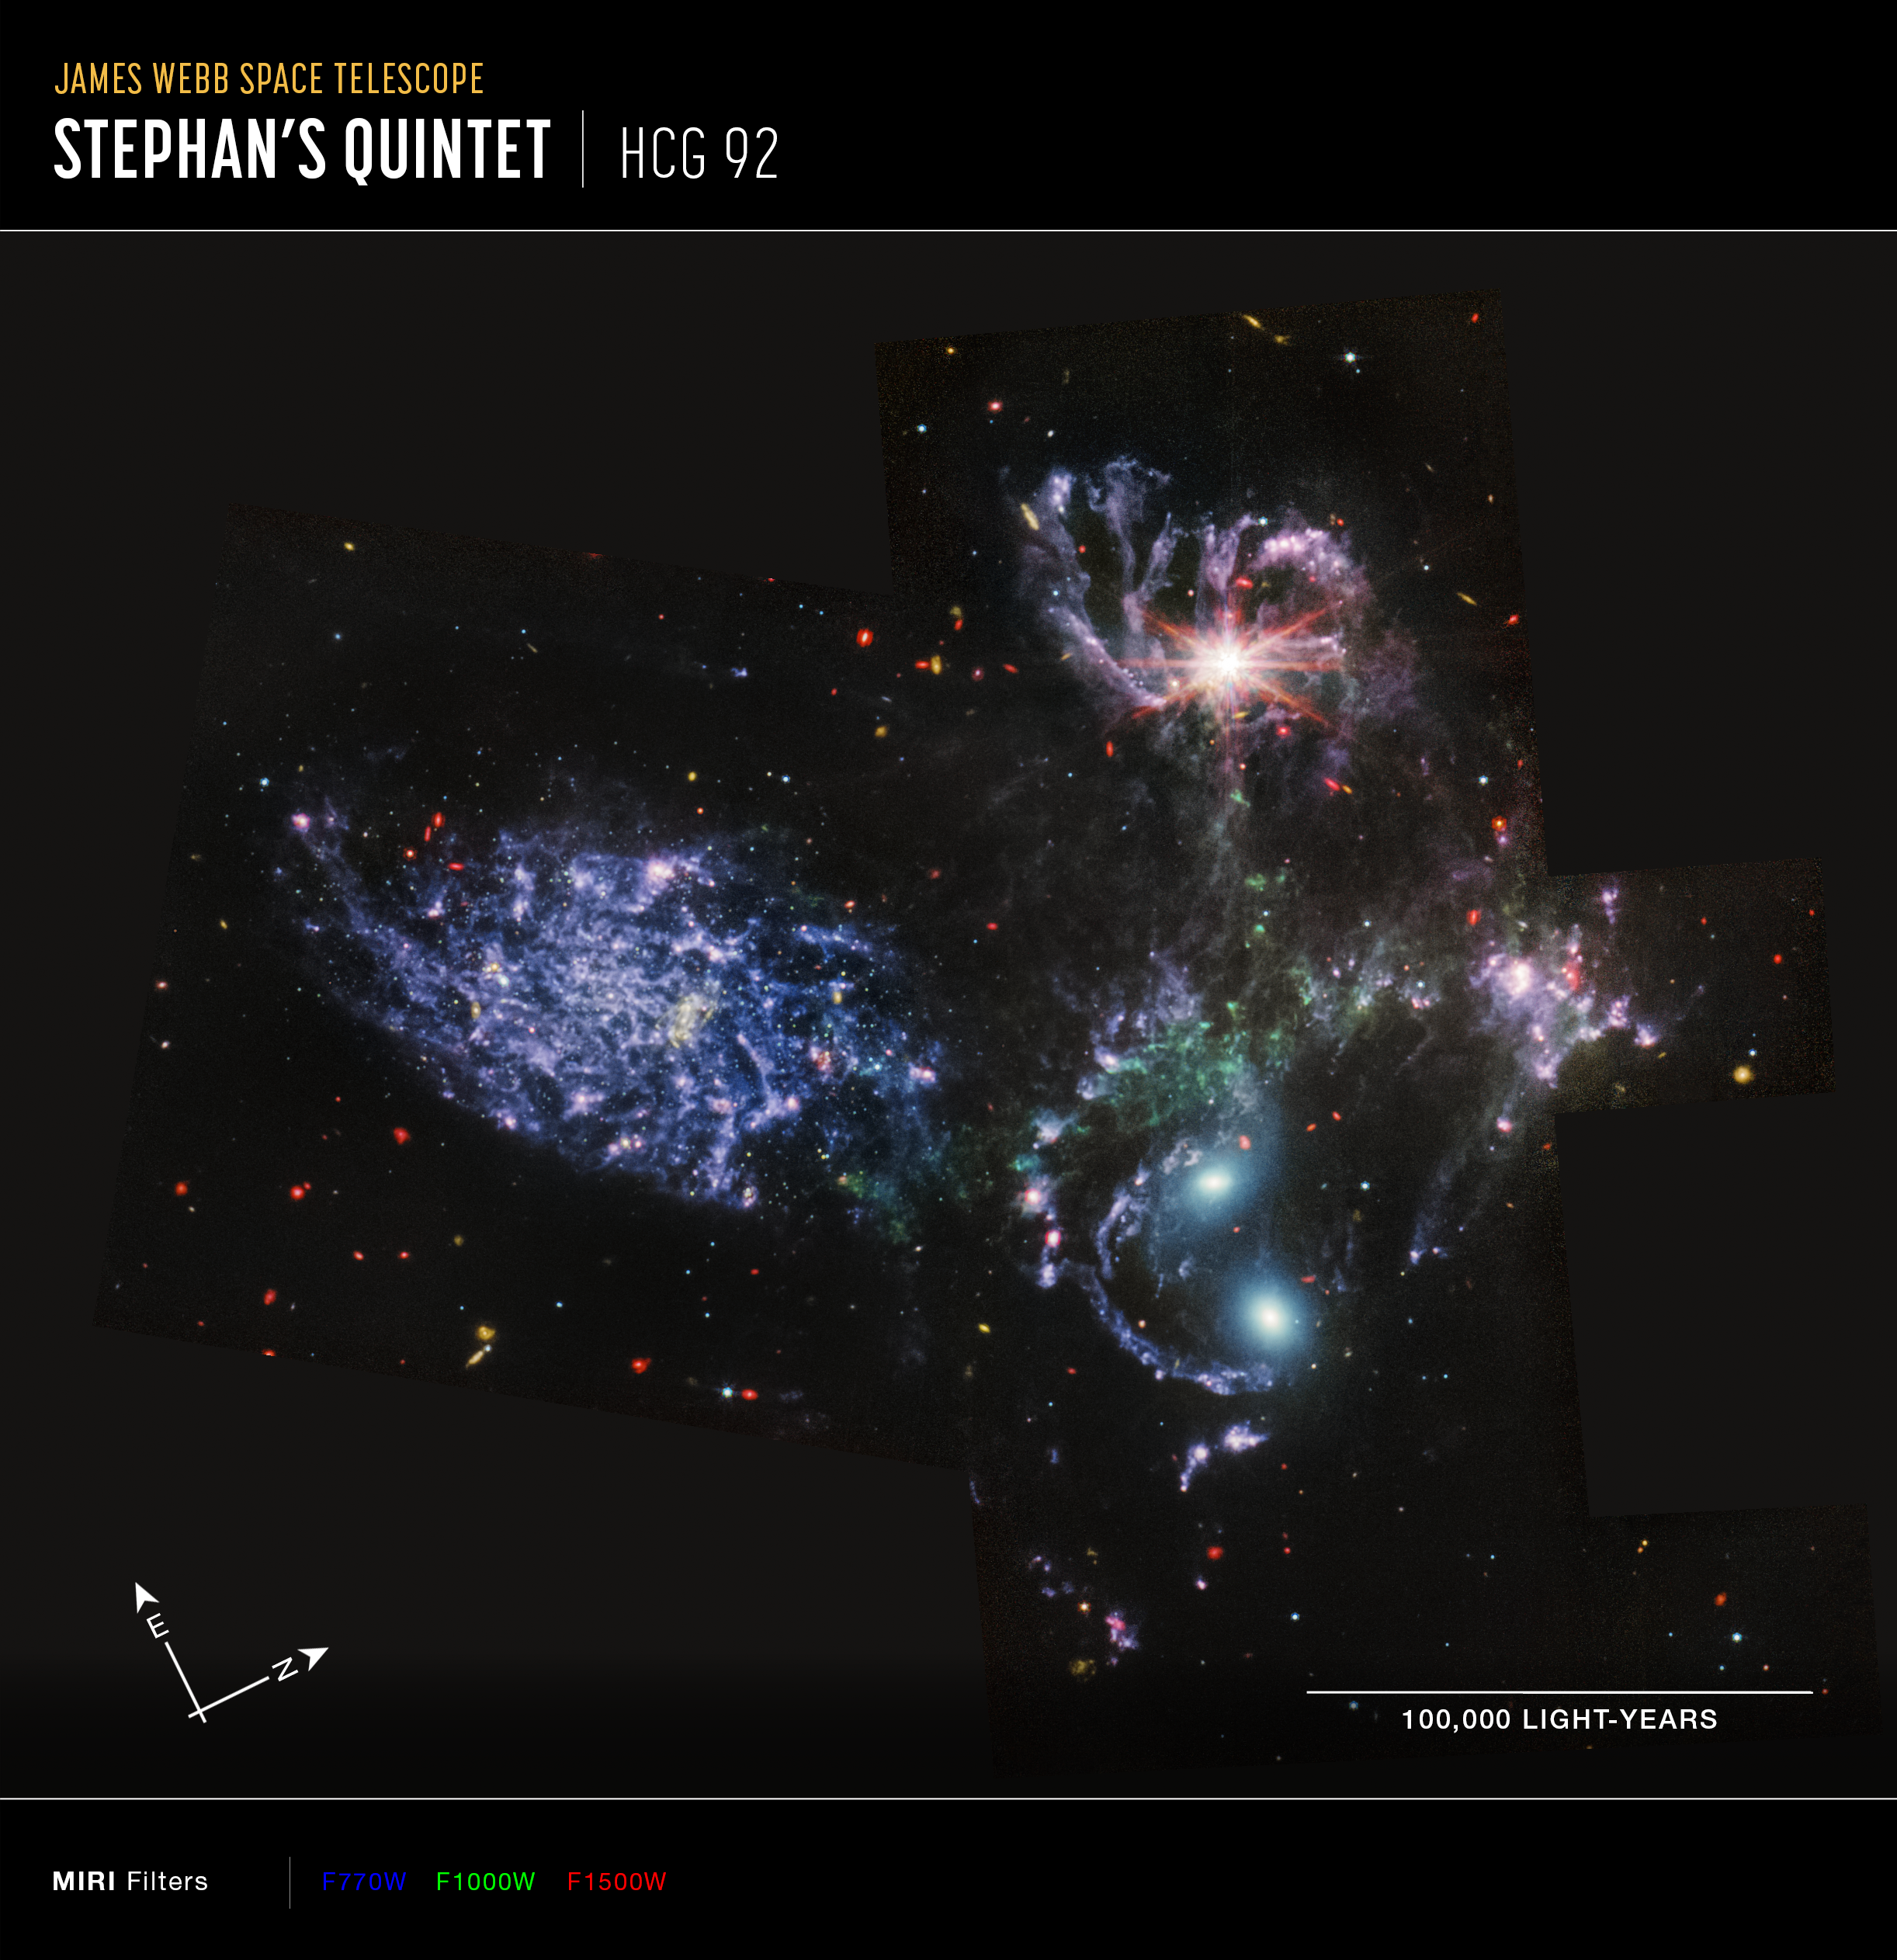
Stephan's Quintet (MIRI Image)
With its powerful, mid-infrared vision, the Mid-Infrared Instrument (MIRI) shows never-before-seen details of Stephan’s Quintet, a visual grouping of five galaxies. MIRI pierced through dust-enshrouded regions to reveal huge shock waves and tidal tails, gas and stars stripped...
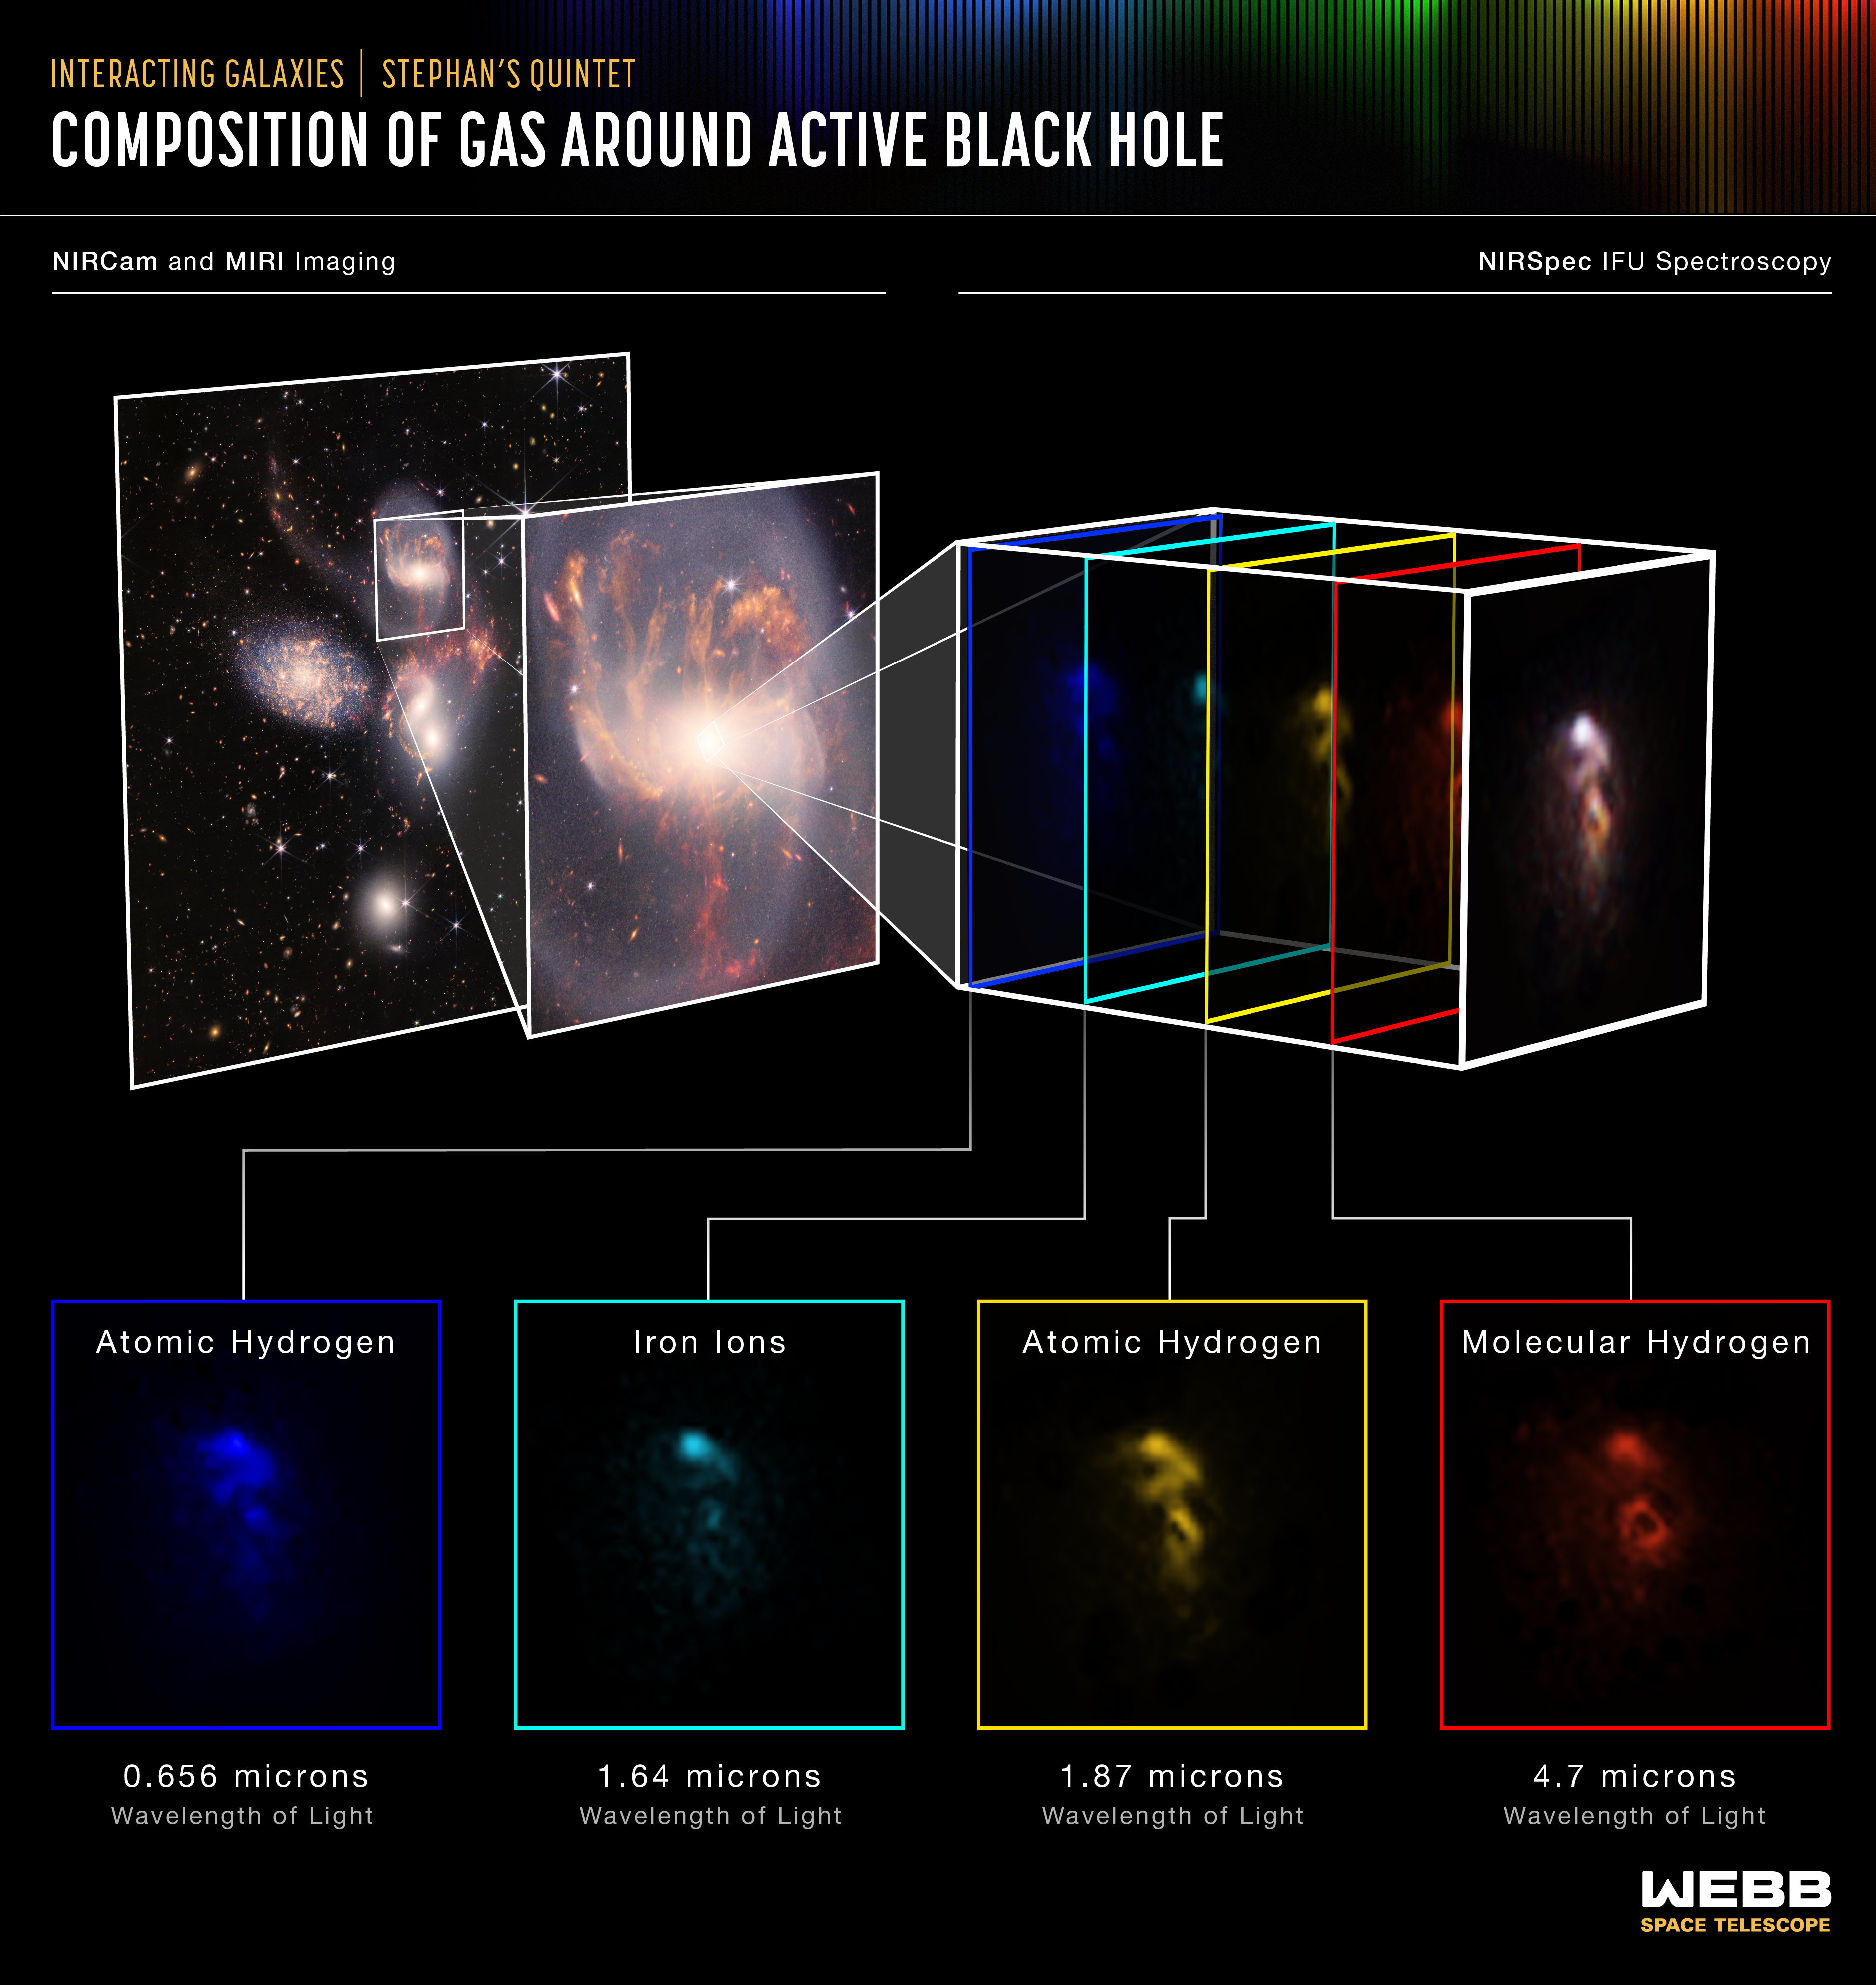
Stephan's Quintet (NIRSpec IFU)
Stephan’s Quintet is a visual grouping of five galaxies located in the constellation Pegasus. Together, they are also known as the Hickson Compact Group 92 (HCG 92). Although called a “quintet,” only four of the galaxies are truly close together and caught up in a cosmic dance....
Stephan's Quintet (MIRI IFU)
Stephan’s Quintet is a visual grouping of five galaxies located in the constellation Pegasus. Together, they are also known as the Hickson Compact Group 92 (HCG 92). Although called a “quintet,” only four of the galaxies are truly close together and caught up in a cosmic dance....
Stephan's Quintet (NIRCam and MIRI Composite Compass Image)
Image of Stephan's Quintet, HCG 92, captured by Webb’s Near-Infrared Camera (NIRCam) and Mid-Infrared Instrument (MIRI), with compass arrows, scale bar, and color key for reference. The north and east compass arrows show the orientation of the image on the sky. Note that the...
Stephan's Quintet (MIRI Compass Image)
Image of Stephan's Quintet, HCG 92, captured by Webb’s Mid-Infrared Instrument (MIRI), with compass arrows, scale bar, and color key for reference. The north and east compass arrows show the orientation of the image on the sky. Note that the relationship between north and east...
Share
Details
Laura Betz
NASA’s Goddard Space Flight Center
Greenbelt, Maryland
laura.e.betz@nasa.gov
NASA, ESA, CSA, STScI


