


1 min read
Hot Gas Giant Exoplanet WASP-39 b Transmission Spectrum (NIRSpec)
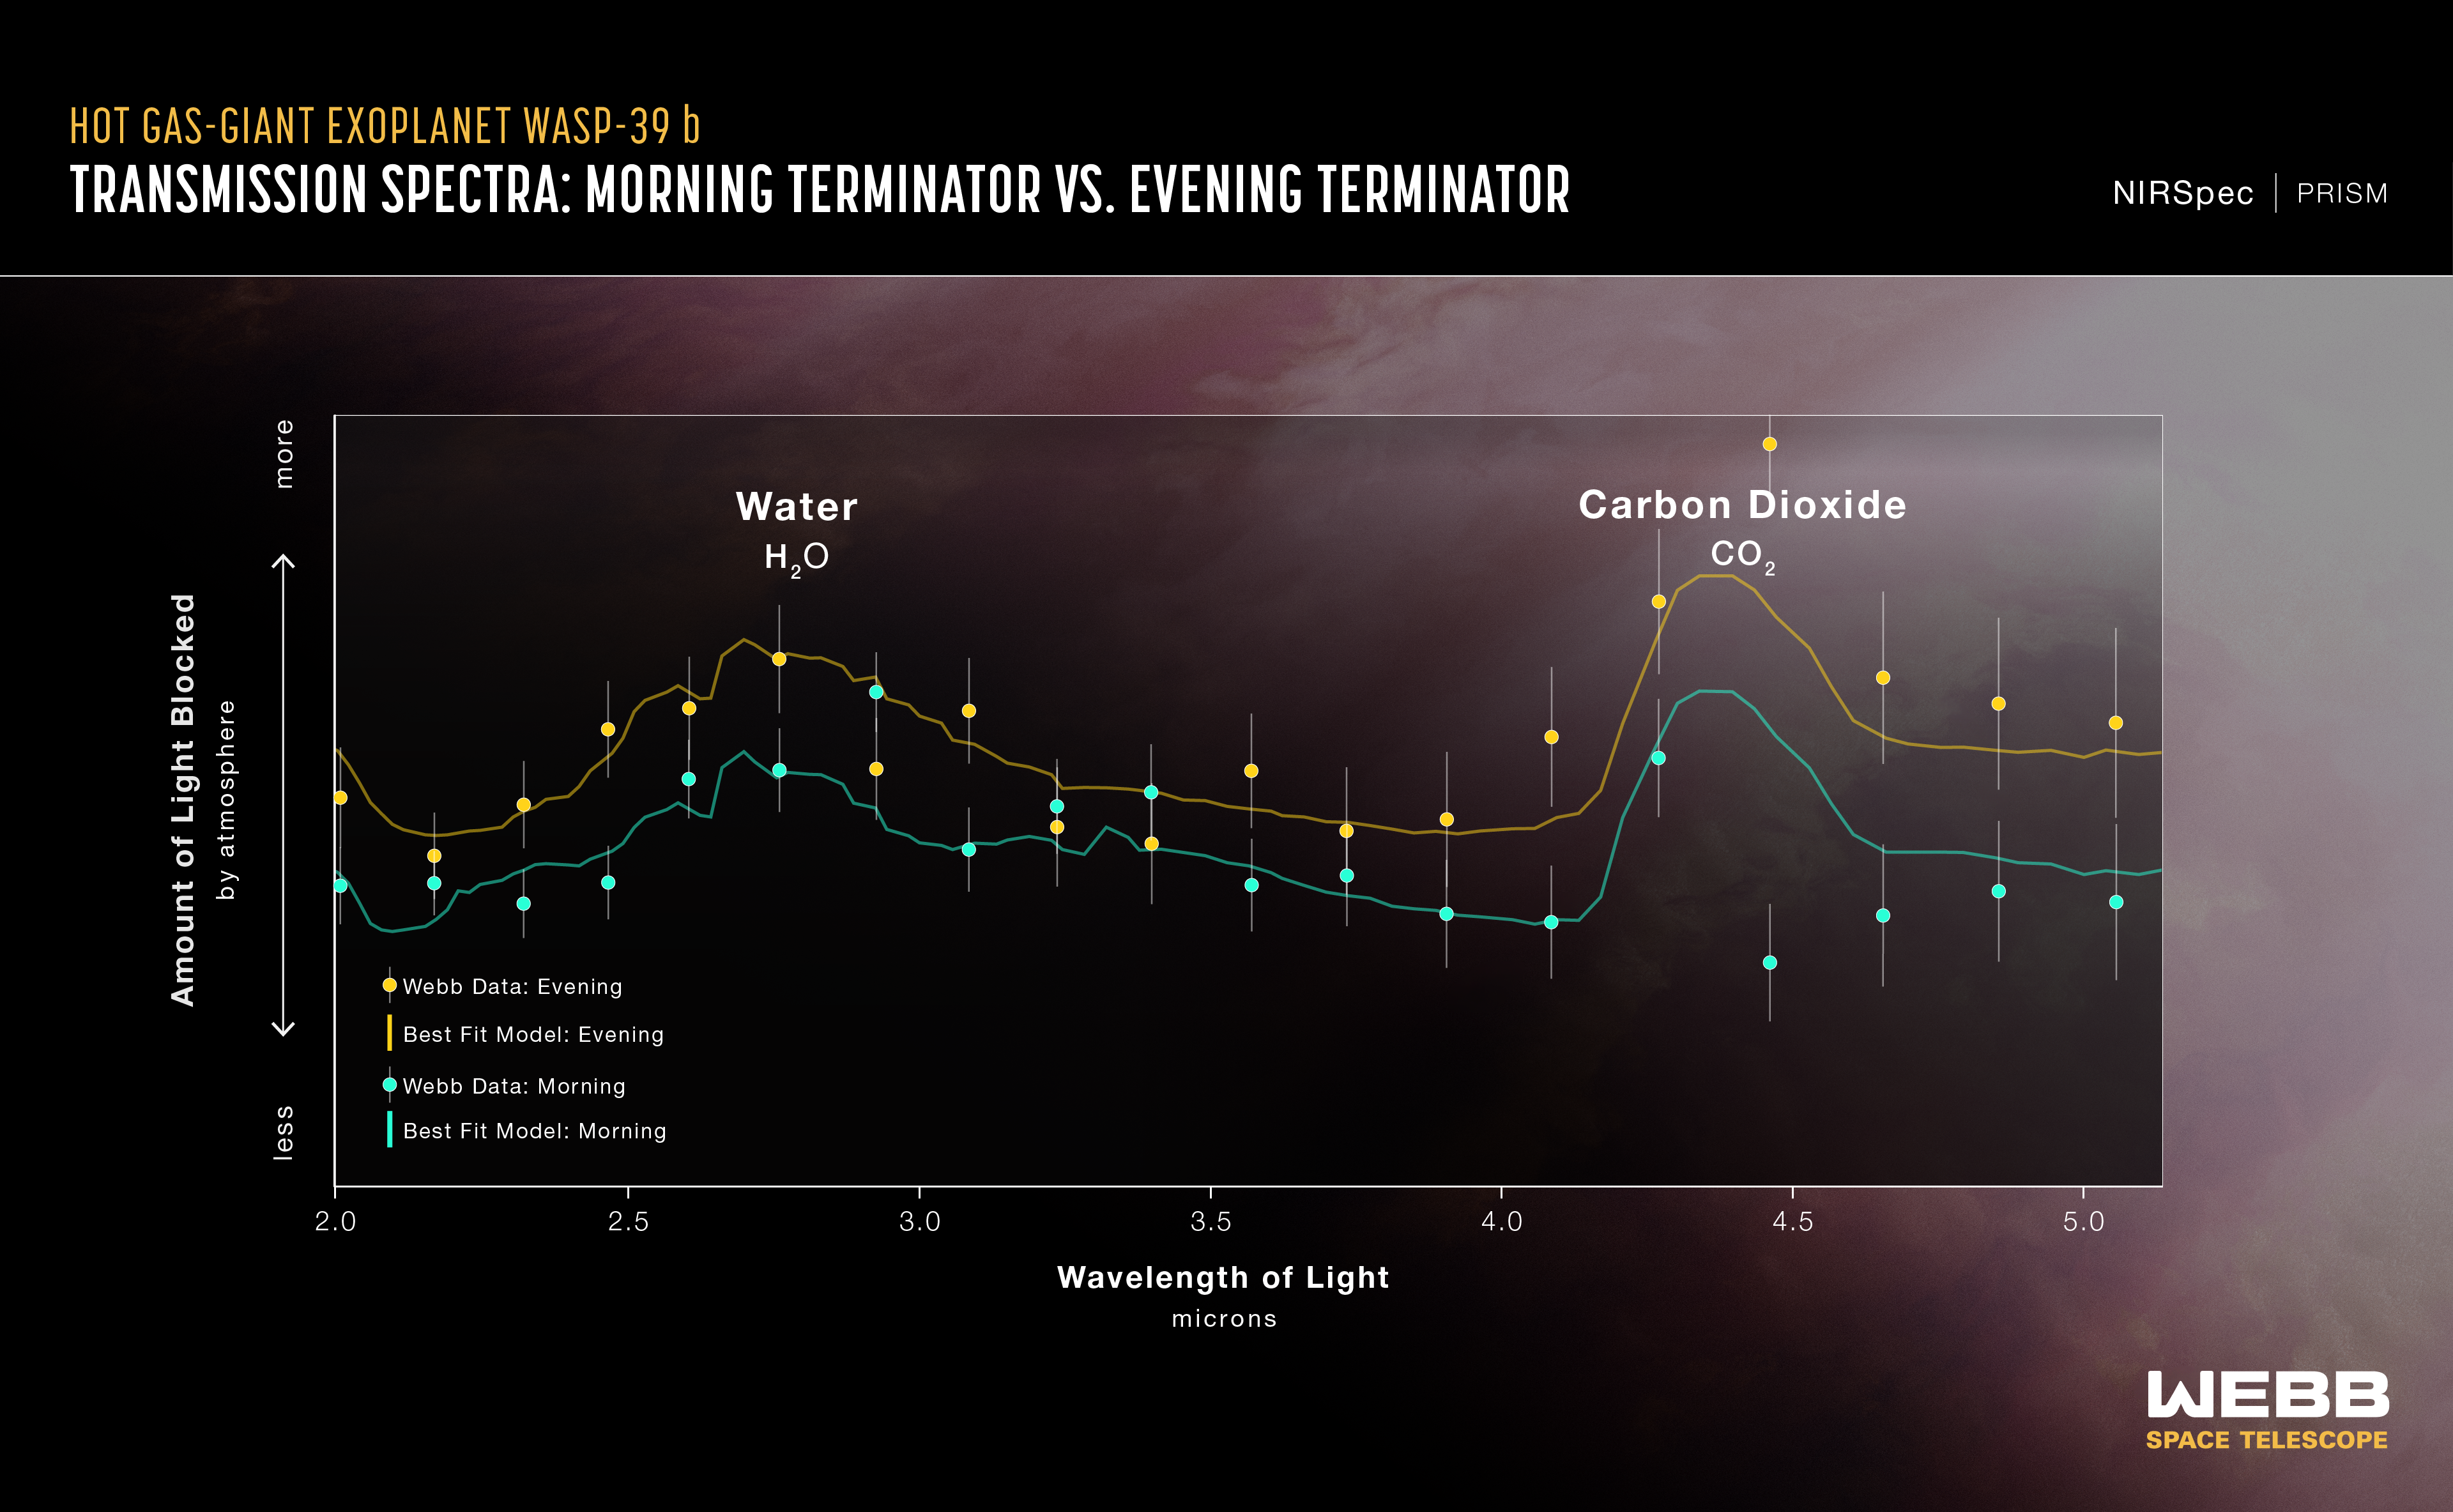
This transmission spectrum, captured using Webb’s NIRSpec (Near-Infrared Spectrograph) PRISM bright object-time series mode, shows the amounts of near-infrared starlight blocked by the atmosphere of hot gas giant exoplanet WASP-39 b. The spectrum shows clear evidence for water and carbon dioxide, and a variation in temperature between the morning and evening on the exoplanet.
New analysis of the transmission spectrum of WASP-39 b builds two different spectra from the stationary day/night boundary on the exoplanet, essentially splitting this terminator region into two semicircles, one from the evening, and the other from the morning. Data reveals the evening as significantly hotter, a searing 1,450 degrees Fahrenheit (800 degrees Celsius), and the morning a relatively cooler 1,150 degrees Fahrenheit (600 degrees Celsius).
The blue and yellow lines are a best-fit model that takes into account the data, the known properties of WASP-39 b and its star (e.g., size, mass, temperature), and assumed characteristics of the atmosphere.
Extended Description and Image Alt Text
Extended Description
Graphic titled “Hot Gas-Giant Exoplanet WASP-39 b Transmission Spectrum: Morning Terminator vs. Evening Terminator” showing two sets of data points with error bars and a best-fit model for on a graph of Amount of Light Blocked by atmosphere on the y-axis versus Wavelength of Light in microns on the x-axis. In the background is an illustration of a pink-orange planet with wispy white clouds.
Axes
The y-axis ranges from less light blocked on the bottom to more light blocked by atmosphere at the top, with no values, units, or tick marks. The x-axis ranges from 2.0 on the left to 5.2 on the right, labeled in even increments of 0.5 microns ending at 5.0.
Data, Model, and Labels
There is two sets of NIRSpec data points plotted, one set as solid yellow circles with gray vertical error bars and one as solid green circles with grey vertical error bars.
A best-fit model is shown as jagged yellow and green line with a number of broad peaks and valleys.
The yellow data and best fit model are labeled as the evening.
The green data and best fit model are labeled as morning.
The following features are labeled, from left to right:
- A large, wider peak centered around 2.75 microns is labeled Water H2O.
- A short and narrow peak at 4.4 microns is labeled Carbon Dioxide CO2.
Image Alt Text
Graphic titled “Hot Gas-Giant Exoplanet WASP-39 b Transmission Spectrum: Morning Terminator vs. Evening Terminator” has two sets of data points with error bars and a best-fit model for each on a graph of Amount of Light Blocked on the y-axis versus Wavelength of Light in microns on x-axis. Y-axis ranges from less light blocked at bottom to more light blocked at top. X-axis ranges from 2.0 to 5.2 microns. Webb NIRSpec data consists of 38 points plotted in yellow and green, the best-fit model for each are jagged yellow and green lines with several broad peaks and valleys. Two features are labeled. From left to right: Water H2O and Carbon Dioxide CO2.
- Release DateJuly 15, 2024
- Science ReleaseNASA’s Webb Investigates Eternal Sunrises, Sunsets on Distant World
- CreditIllustration: NASA, ESA, CSA, Ralf Crawford (STScI)
Related Images & Videos

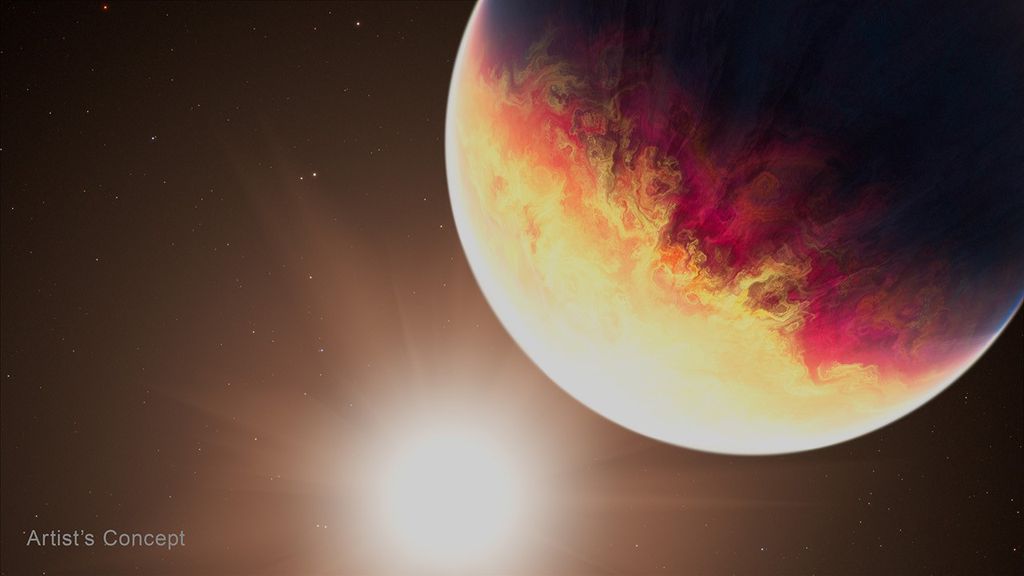
Hot Gas Giant Exoplanet WASP-39 b (Artist's Concept)
This artist’s concept shows what the exoplanet WASP-39 b could look like based on indirect transit observations from NASA’s James Webb Space Telescope as well as other space- and ground-based telescopes. WASP-39 b is a hot, puffy gas giant that orbits a G-type star that is...
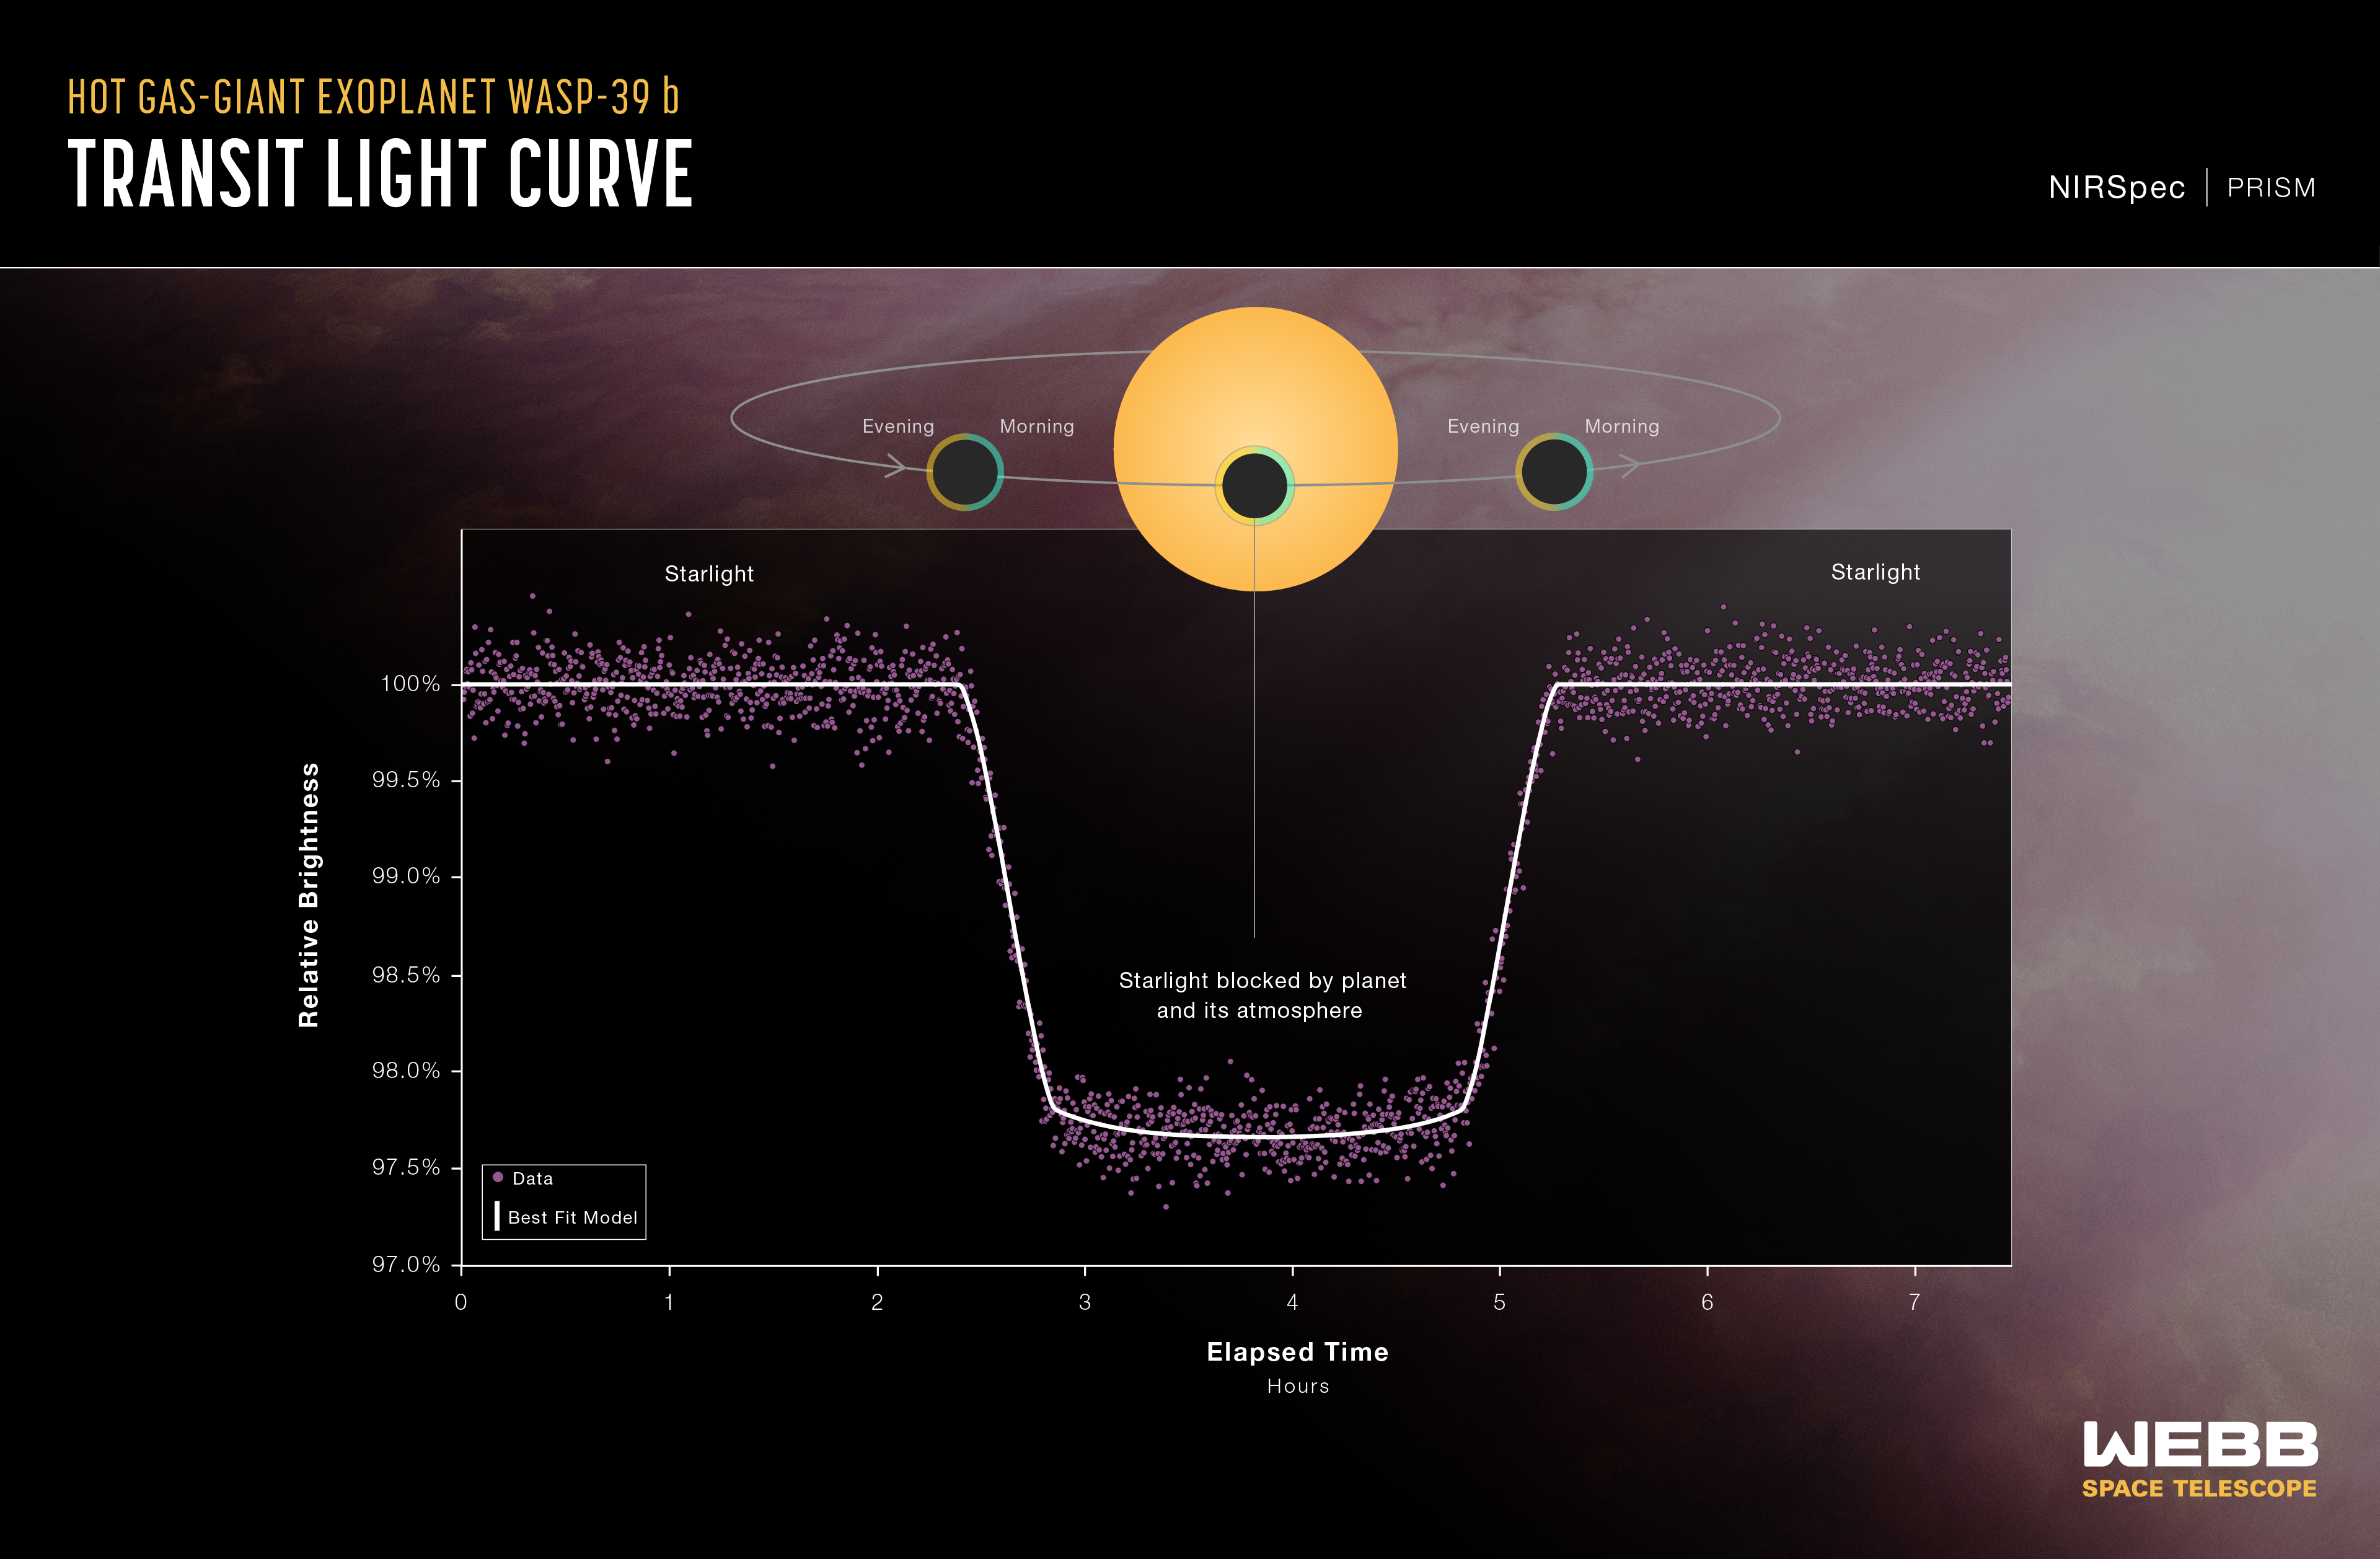
Hot Gas Giant Exoplanet WASP-39 b Transit Light Curve (NIRSpec)
A light curve from NASA’s James Webb Space Telescope’s NIRSpec (Near-Infrared Spectrograph) shows the change in brightness from the WASP-39 star system over time as the planet transited the star. This observation was made using NIRSpec’s bright object time-series mode, which...
Share
Details
Laura Betz
NASA’s Goddard Space Flight Center
Greenbelt, Maryland
laura.e.betz@nasa.gov
NASA, ESA, CSA, Ralf Crawford (STScI)


