1 min read
A Sample of Galaxy Disks (NIRCam)
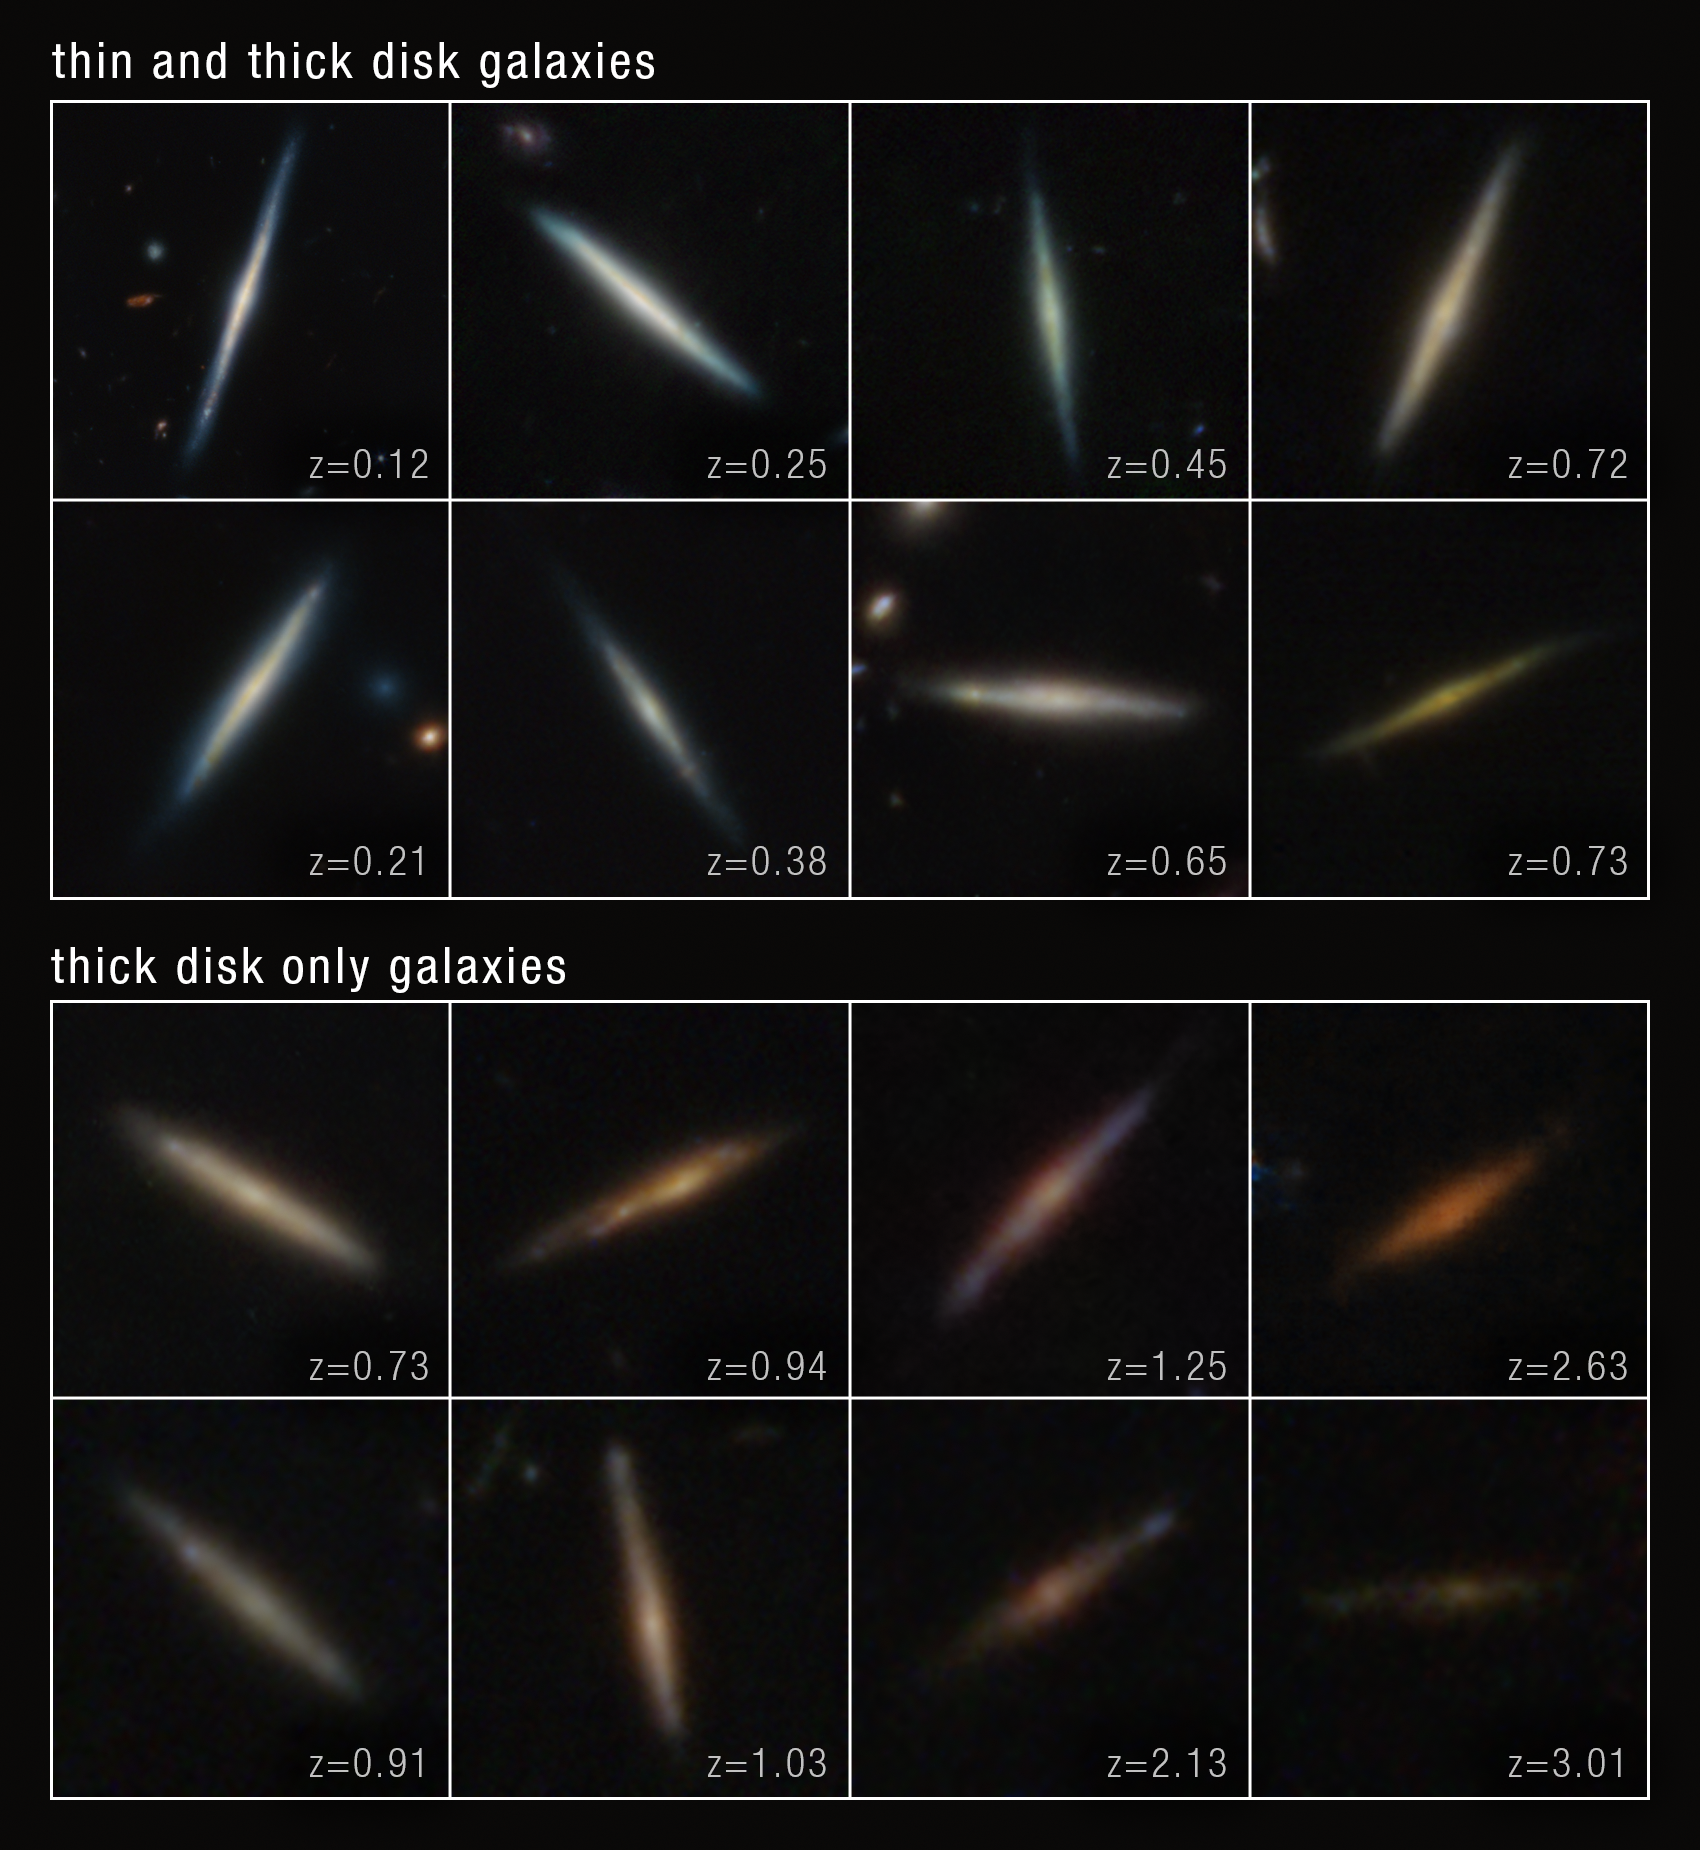
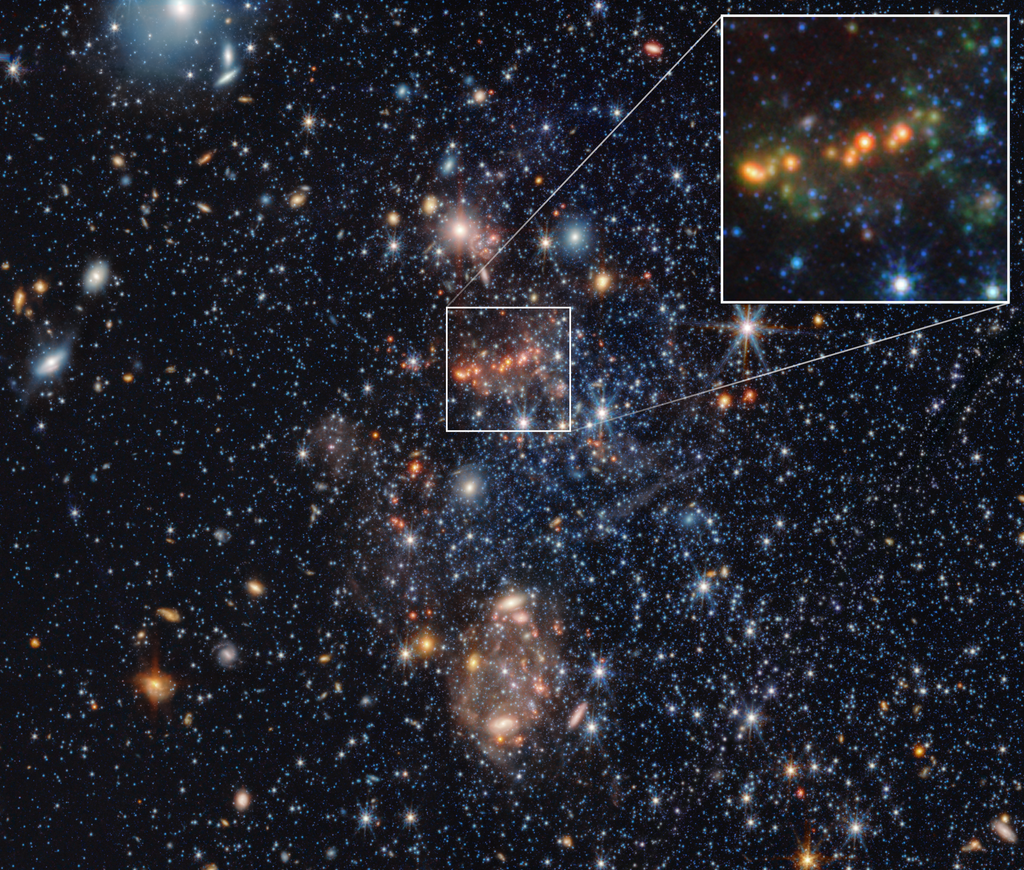
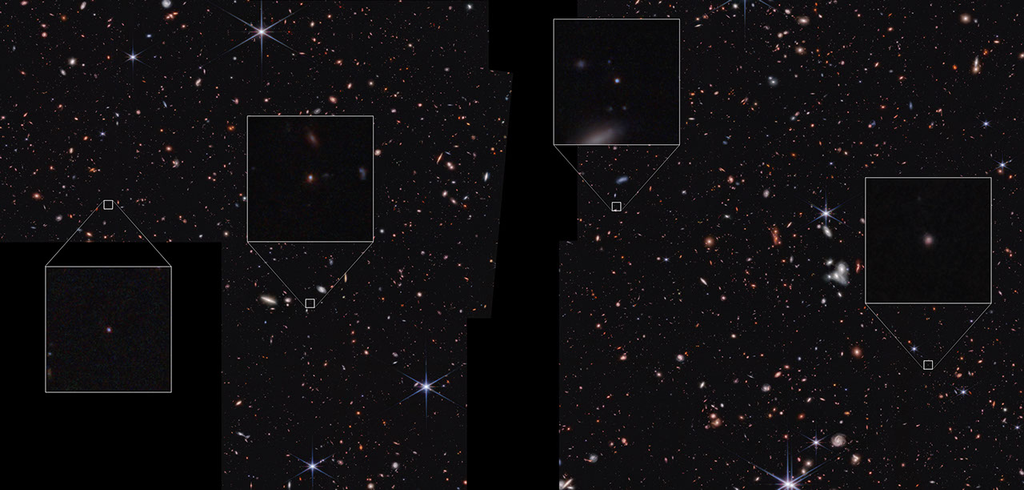
Present-day disk galaxies often contain a thick, star-filled outer disk and an embedded thin disk of stars. Three major theoretical scenarios have been proposed by astronomers to explain how this dual-disk structure comes to be. Using archival data from the James Webb Space Telescope, a team of astronomers is closer to understanding disk galaxies’ origins, and the stellar thick- and thin-disk formation process. The team carefully identified, visually verified, and analyzed a statistical sample of more than 100 edge-on disk galaxies at various periods — up to 11 billion years ago (or approximately 2.8 billion years after the big bang). The results of their analysis suggest that galaxies form a thick disk first, followed by a thin disk. The timing of this process depends on a galaxy’s mass: high-mass, single-disk galaxies transitioned to two-disk structures around 8 billion years ago, while low-mass, single-disk galaxies formed their thin disks about 4 billion years ago.
About the Data
- Data DescriptionData DescriptionProposal: A description of the observations, their scientific justification, and the links to the data available in the science archive.
Science Team: The astronomers who planned the observations and analyzed the data. "PI" refers to the Principal Investigator. - InstrumentInstrumentThe science instrument used to produce the data.NIRCam
- FiltersFiltersThe camera filters that were used in the science observations.These images are a composite of separate exposures acquired by the James Webb Space Telescope using the NIRCam instrument. Several filters were used to sample specific wavelength ranges. The color results from assigning different hues (colors) to each monochromatic (grayscale) image associated with an individual filter.
- Object DescriptionObject DescriptionThe type of astronomical object.Thick and Thin Spiral Galaxy Disks
- Release DateJune 26, 2025
- Science ReleaseNASA’s Webb Digs into Structural Origins of Disk Galaxies
- CreditImage: NASA, ESA, CSA, STScI, Takafumi Tsukui (ANU)
Share
Details
Laura Betz
NASA’s Goddard Space Flight Center
Greenbelt, Maryland
laura.e.betz@nasa.gov
NASA, ESA, CSA, STScI, Takafumi Tsukui (ANU)

