


1 min read
Continuous Spectra (Blackbody Curves) of Stars
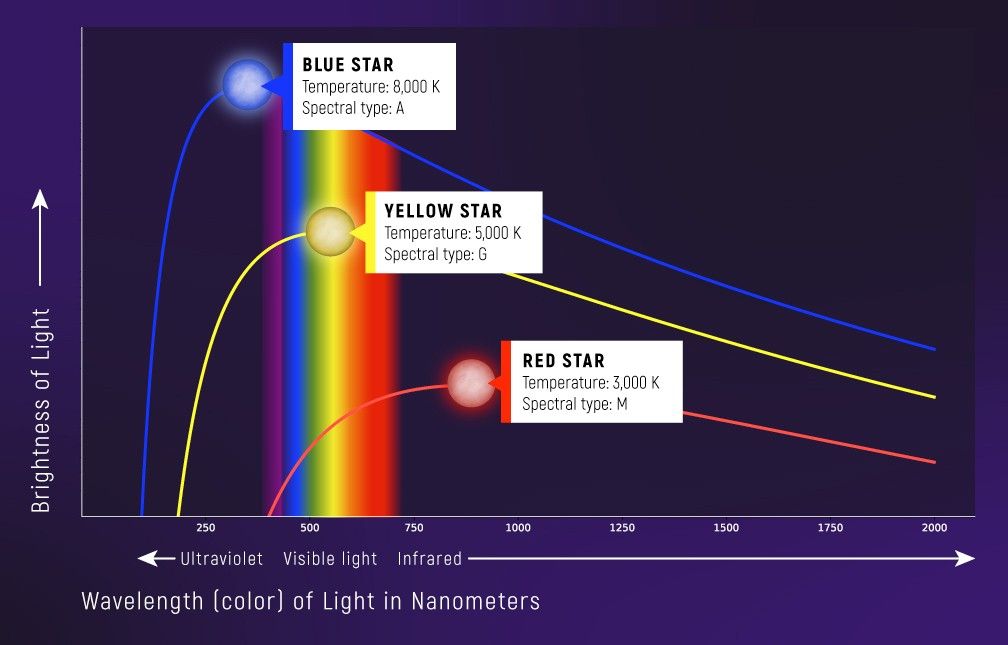
Graphs of brightness vs. wavelength of three objects of different temperature. A blackbody curve is a type of continuous spectrum that is directly related to the temperature of an object. A star with a temperature of 8,000 kelvins (roughly 8,000 degrees Celsius or 14,000 degrees Fahrenheit) is brighter and looks bluer than a star that is 3,000 K (2,700°C or 5,000°F ), which is dimmer and redder. A blackbody spectrum can be used to calculate the temperature of an object. (Although stars are not perfect blackbodies, the blackbody curve describes the shape of a star’s overall spectrum quite well.)
Share
Details
Laura Betz
NASA’s Goddard Space Flight Center
Greenbelt, Maryland
laura.e.betz@nasa.gov
NASA, ESA, CSA, Leah Hustak (STScI), Andi James (STScI)


