


![Request for Information – Potential [Placeholder for Prize]](https://assets.science.nasa.gov/dynamicimage/assets/science/missions/a-step/FFR_Earth_Background_20251120%20.png?w=1024)


1 min read
About Spectroscopy
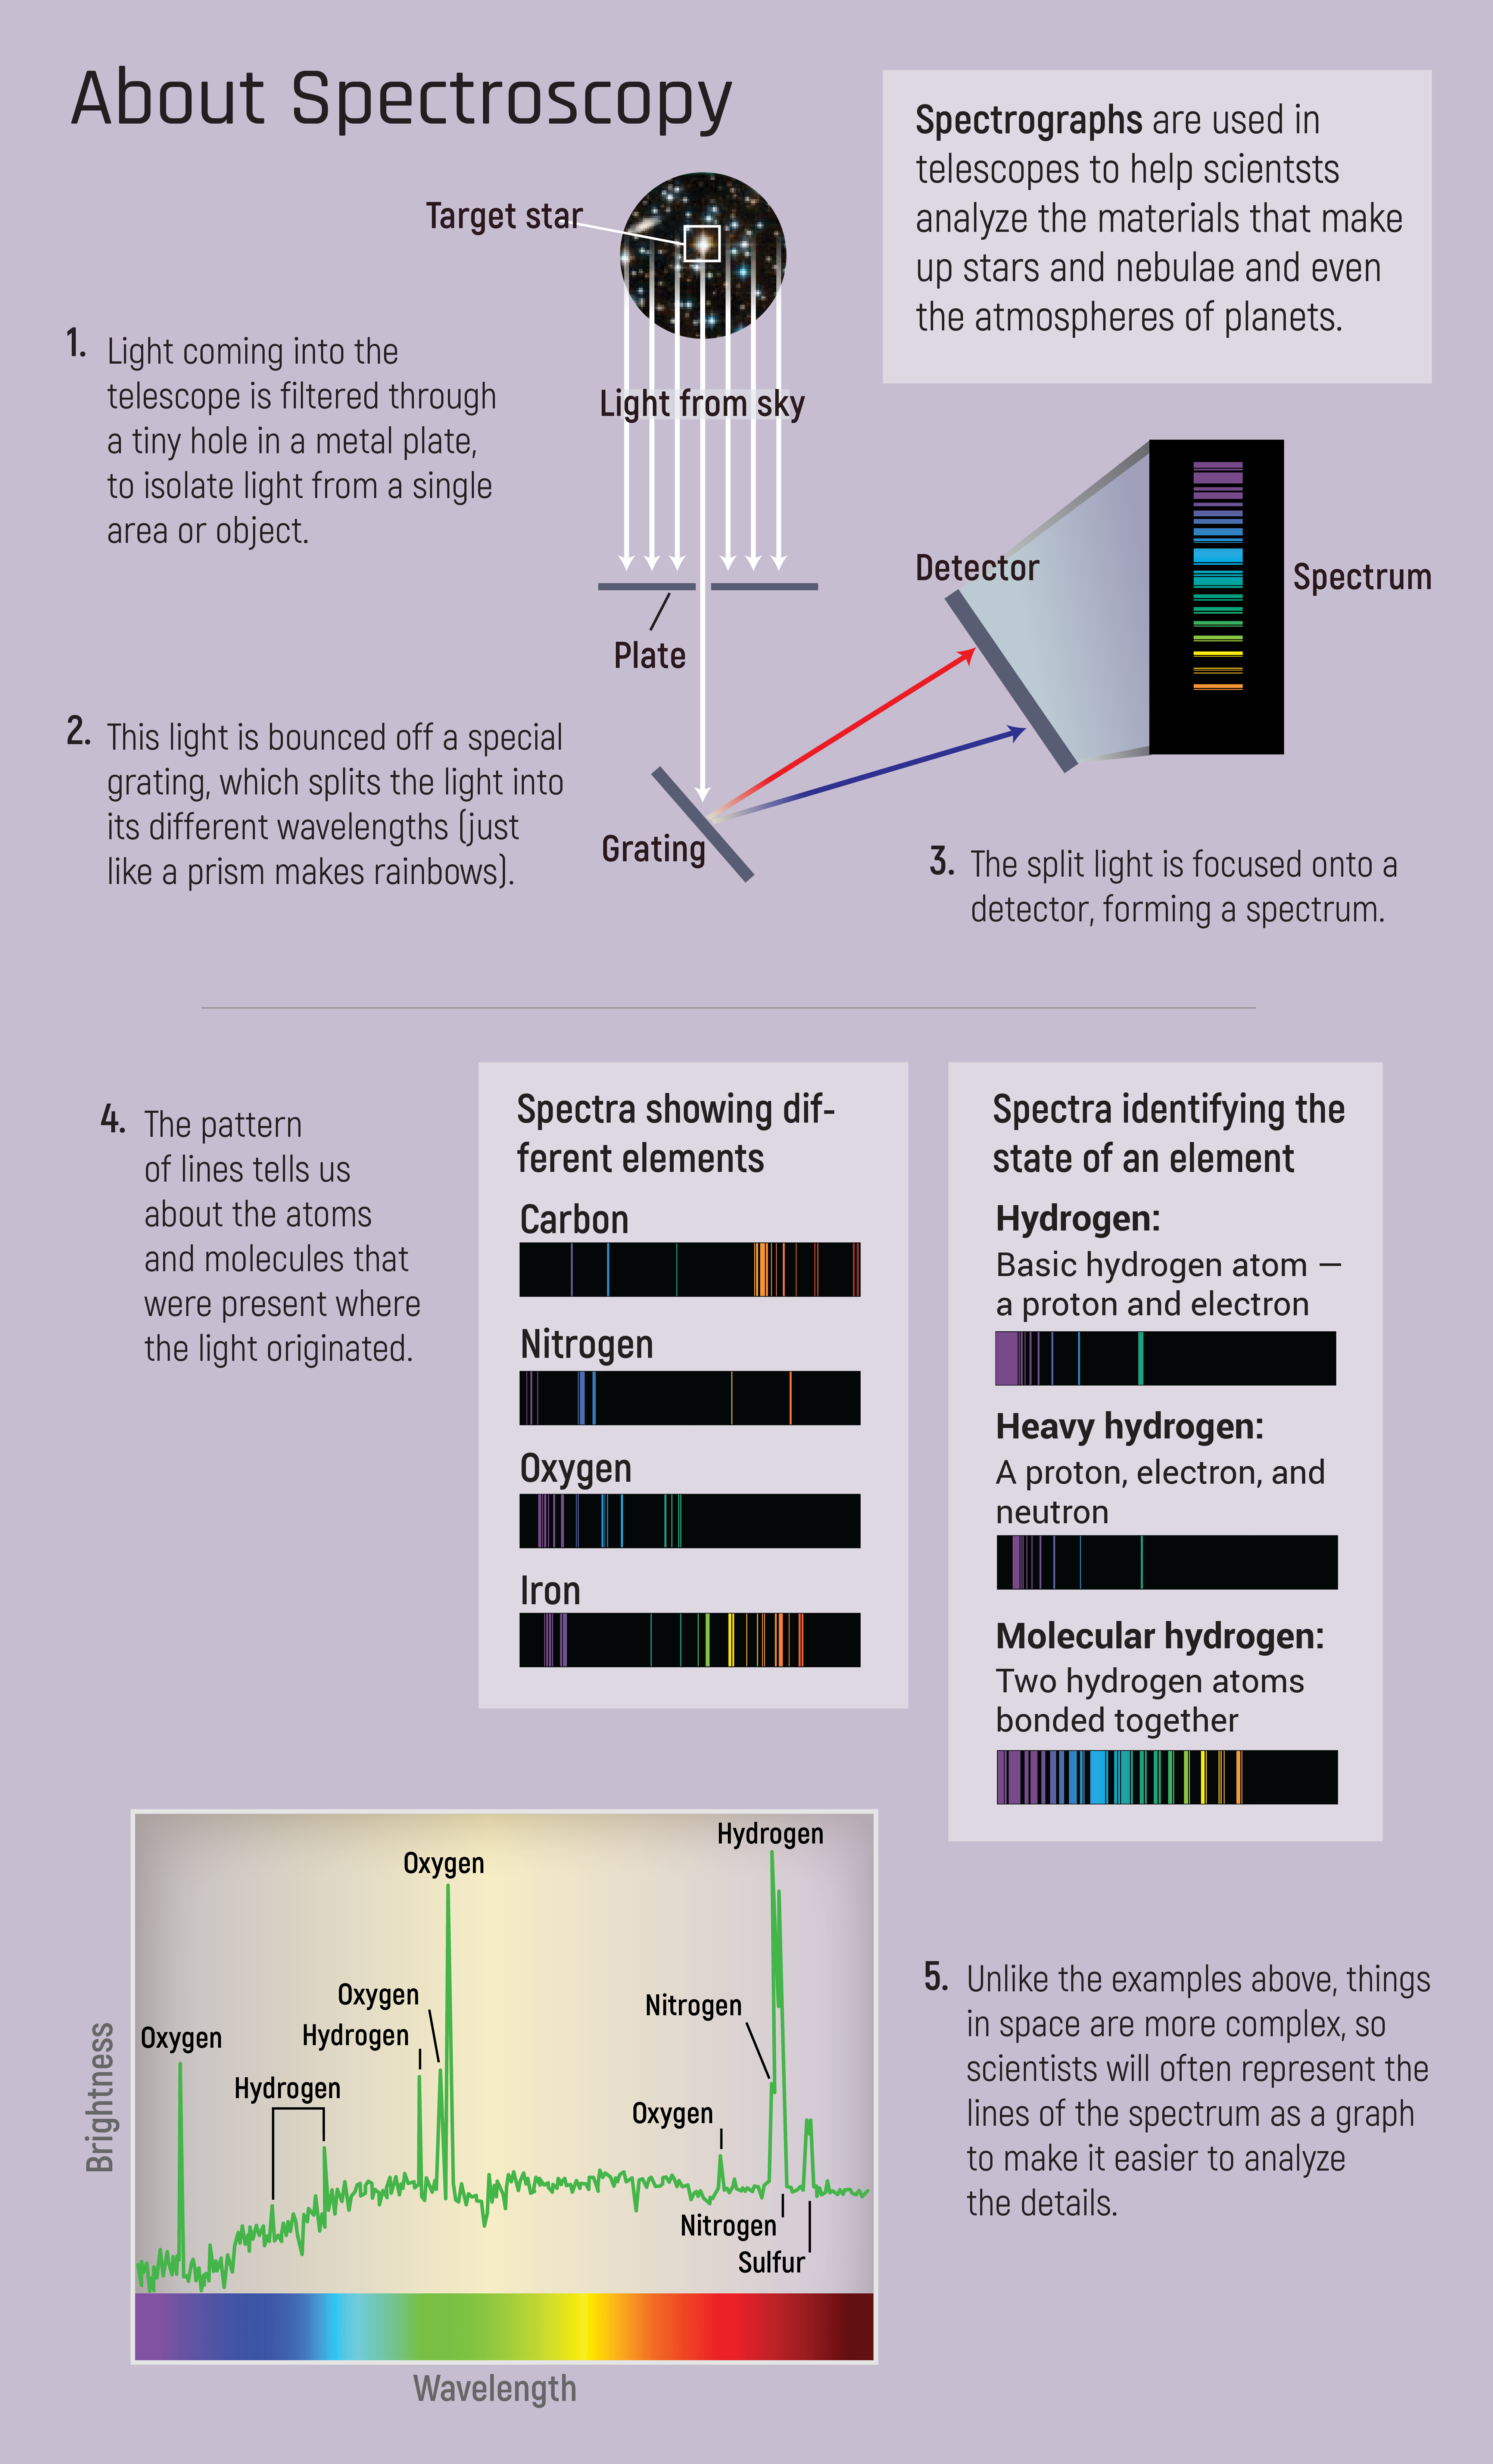
Spectroscopy is the key to revealing details that cannot be revealed through a simple picture.
Astronomical telescopes are famous for the images captured by their cameras, but they often also rely on instruments called spectrographs. Spectrographs — sometimes called spectroscopes or spectrometers — don’t produce beautiful images; their data is expressed as a jagged line on a chart. It doesn’t look like much, but it’s how telescopes like Webb will reveal details of atmospheres on other planets, the composition of stars, the motion of galaxies, and more.
A spectrograph breaks the light from a single object into its component colors the way a prism splits white light into a rainbow, allowing scientists to analyze the light and discover properties of the object emitting it.
Share
Details
Laura Betz
NASA’s Goddard Space Flight Center
Greenbelt, Maryland
laura.e.betz@nasa.gov
NASA, ESA, CSA, Stephanie Smith (STScI), Christine Klicka (STScI)


