


![Request for Information – Potential [Placeholder for Prize]](https://assets.science.nasa.gov/dynamicimage/assets/science/psd/solar/2023/09/s/solarsystem_0.jpg?w=1024)


Instruments
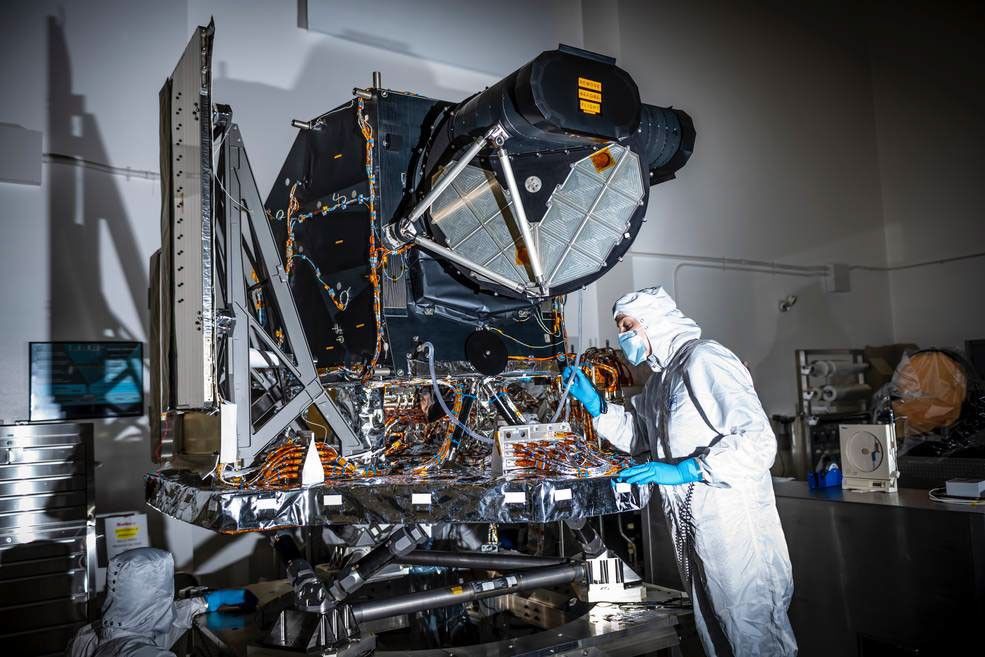
Operational Land Imager (OLI)
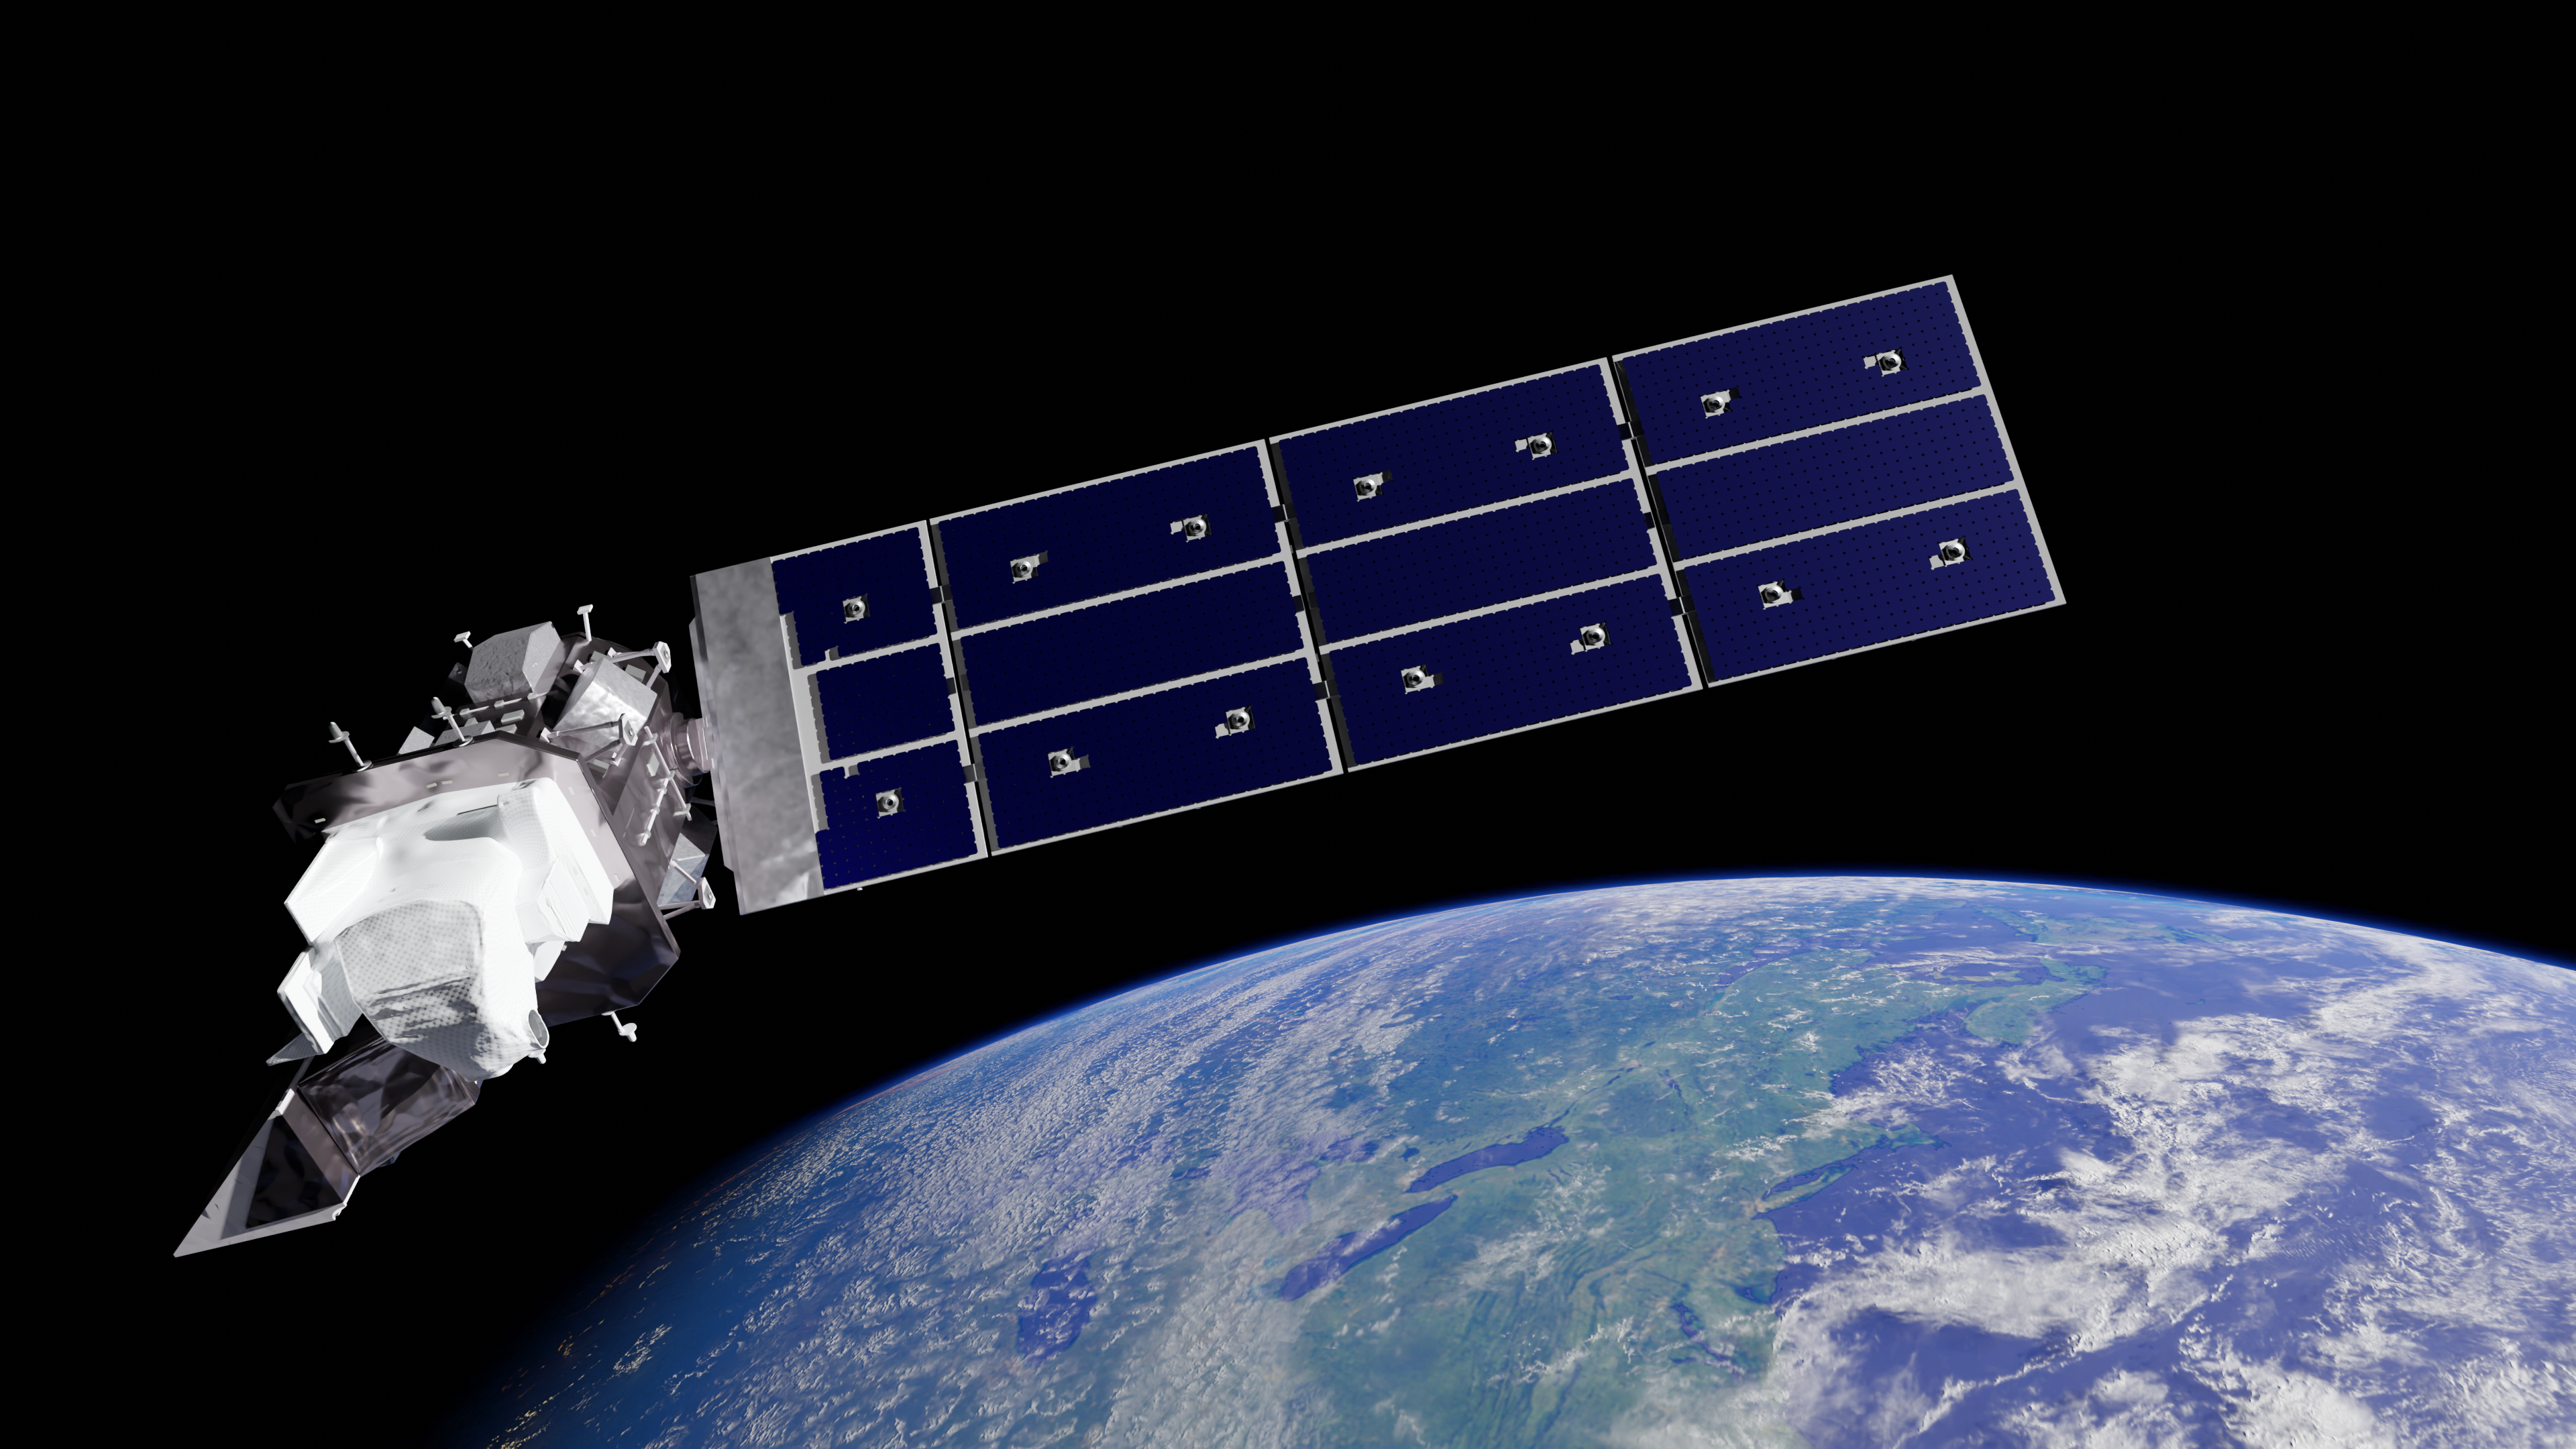
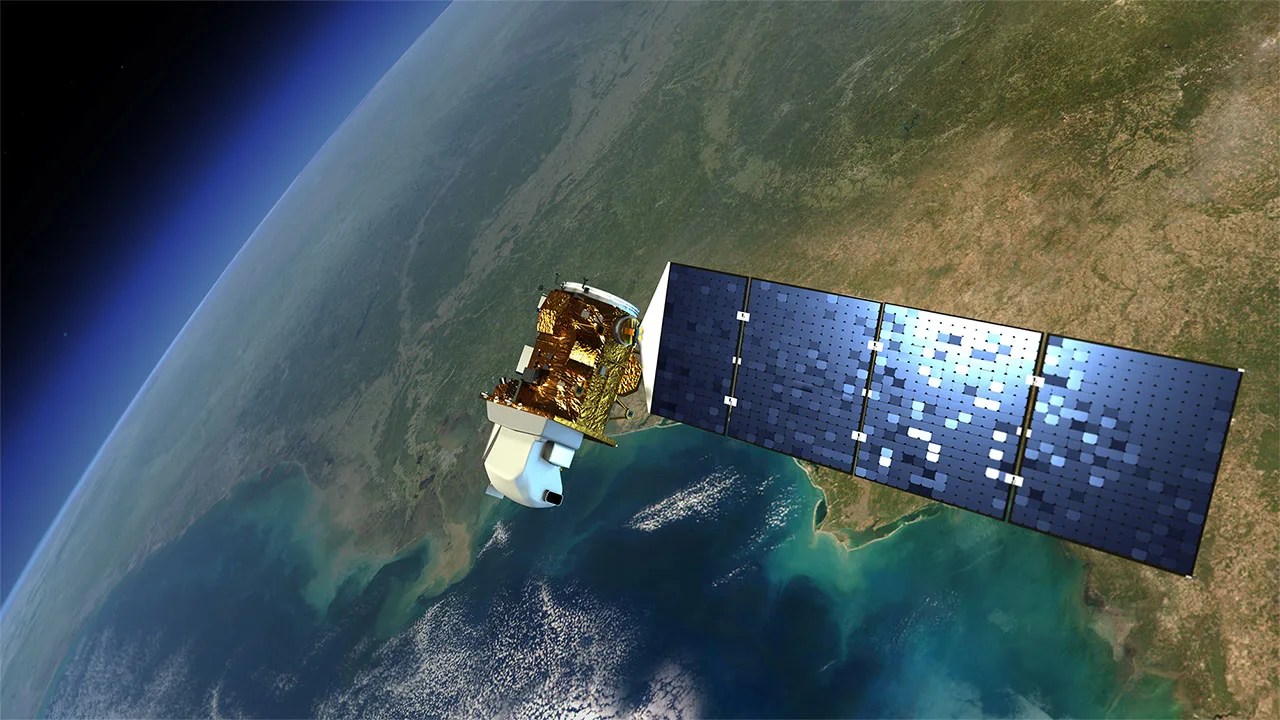
The Operational Land Imager (OLI) marked a major leap in Earth observation technology and performance. It collects comparable measurements with previous Landsat satellites while delivering sharper, more robust data that improves ability to classify images, detect land cover change, and map environmental features and conditions.
Overview
The Operational Land Imager (OLI) is an advanced Earth observation instrument built by Ball Aerospace & Technologies Corporation for both Landsat 8 and Landsat 9. The sensor measures electromagnetic radiation in the visible, near-infrared, and short-wave infrared portions of the spectrum. OLI provides images with 15-meter panchromatic and 30-meter multi-spectral spatial resolutions across a 185 km wide swath, enabling coverage of wide Earth surface areas while maintaining sufficient resolution to distinguish features like urban centers, farms, and forests.
Requirements
OLI was designed with sufficient redundancies to ensure the collection of science-grade data over a 5-year design life and to meet stringent technical specifications:
- Spectral and spatial requirements: collect data in nine spectral bands with 30-meter spatial resolution and one panchromatic band at 15-meter resolution over an 185 km swath from 705 km altitude.
- Radiometric requirements: produce data calibrated to an uncertainty of less than 5% for spectral radiance and less than 3% for top-of-atmosphere spectral reflectance. The instrument must maintain spectral band widths within 3% of specified values across the field-of-view.
- Additional requirements: encompass spectral band co-registration, ground sample distances, edge response, image geometry and geolocation, and delivery of data processing algorithms. The system was also required to collect data for all Enhanced Thematic Mapper Plus (ETM+) shortwave bands to fulfill data continuity mandates.
Requirements for Landsat 9’s OLI increased downlinks to 14-bit data, compared with 12-bit data from OLI on Landsat 8. This improved sensitivity by about 25% and provides benefits for analysis of dark targets such as coastal waters.
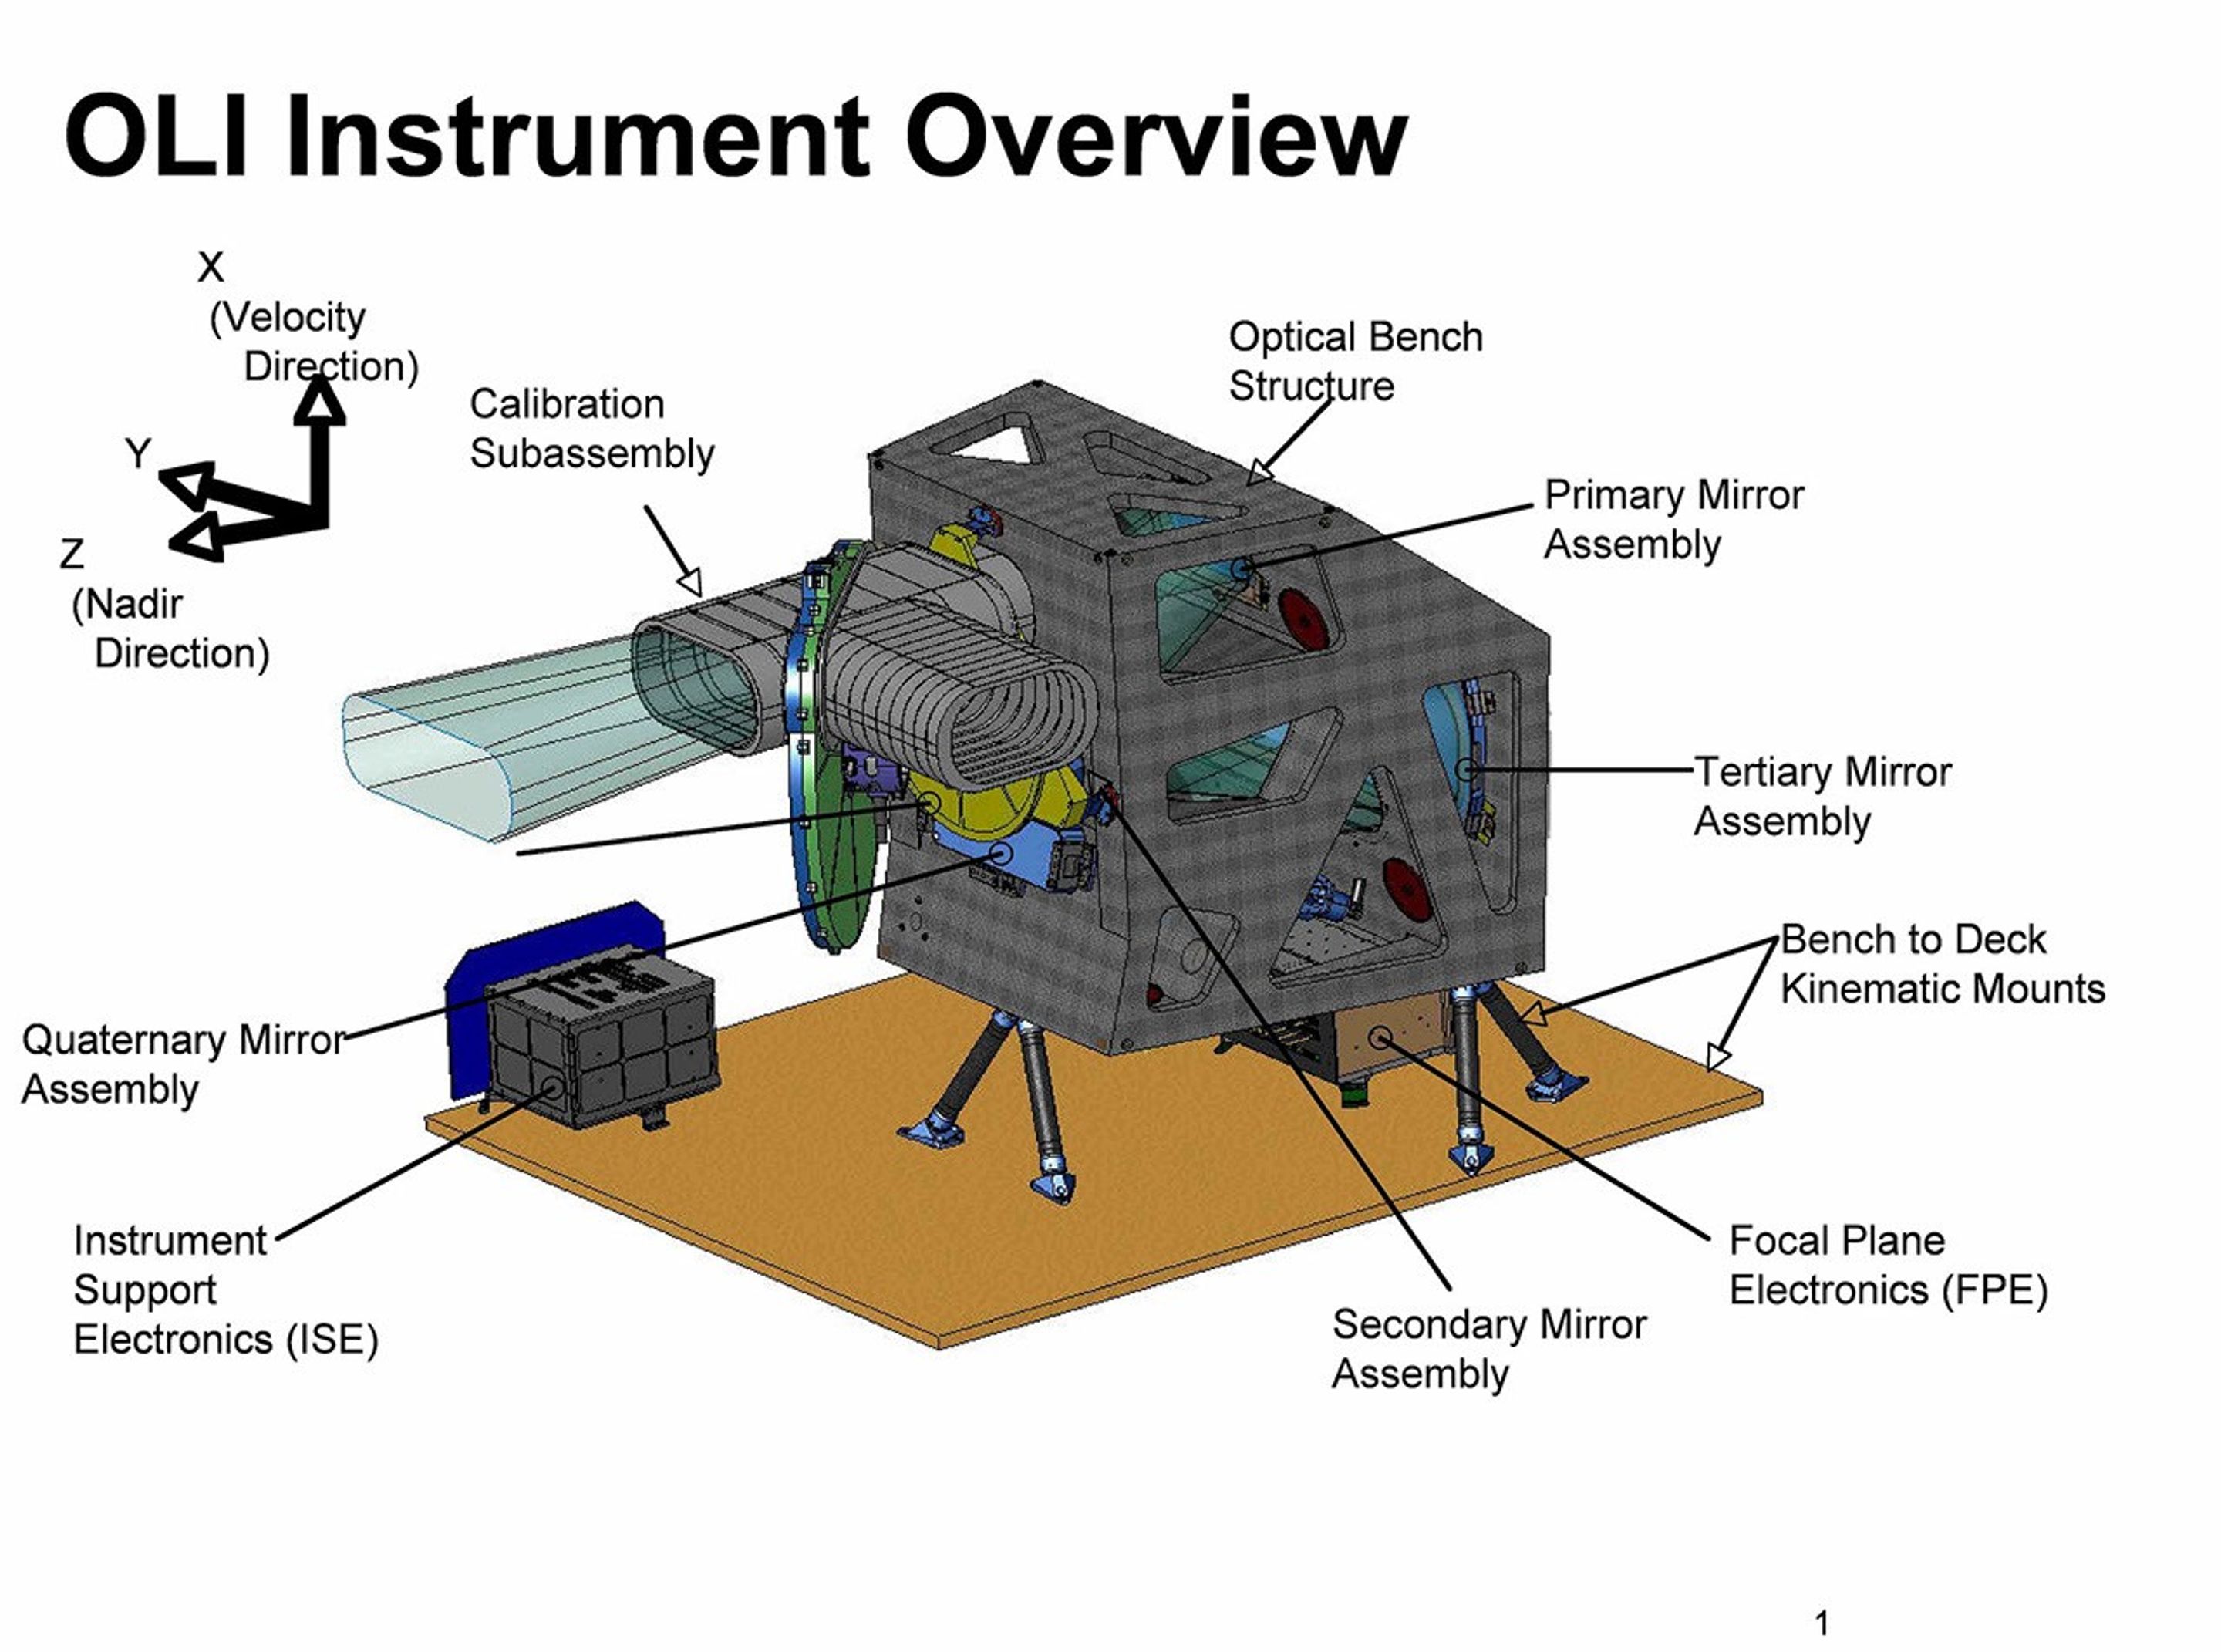
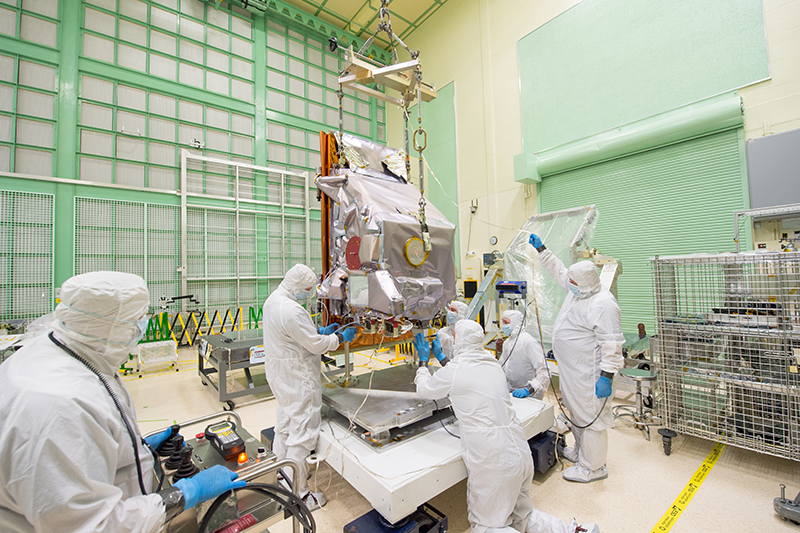
Design
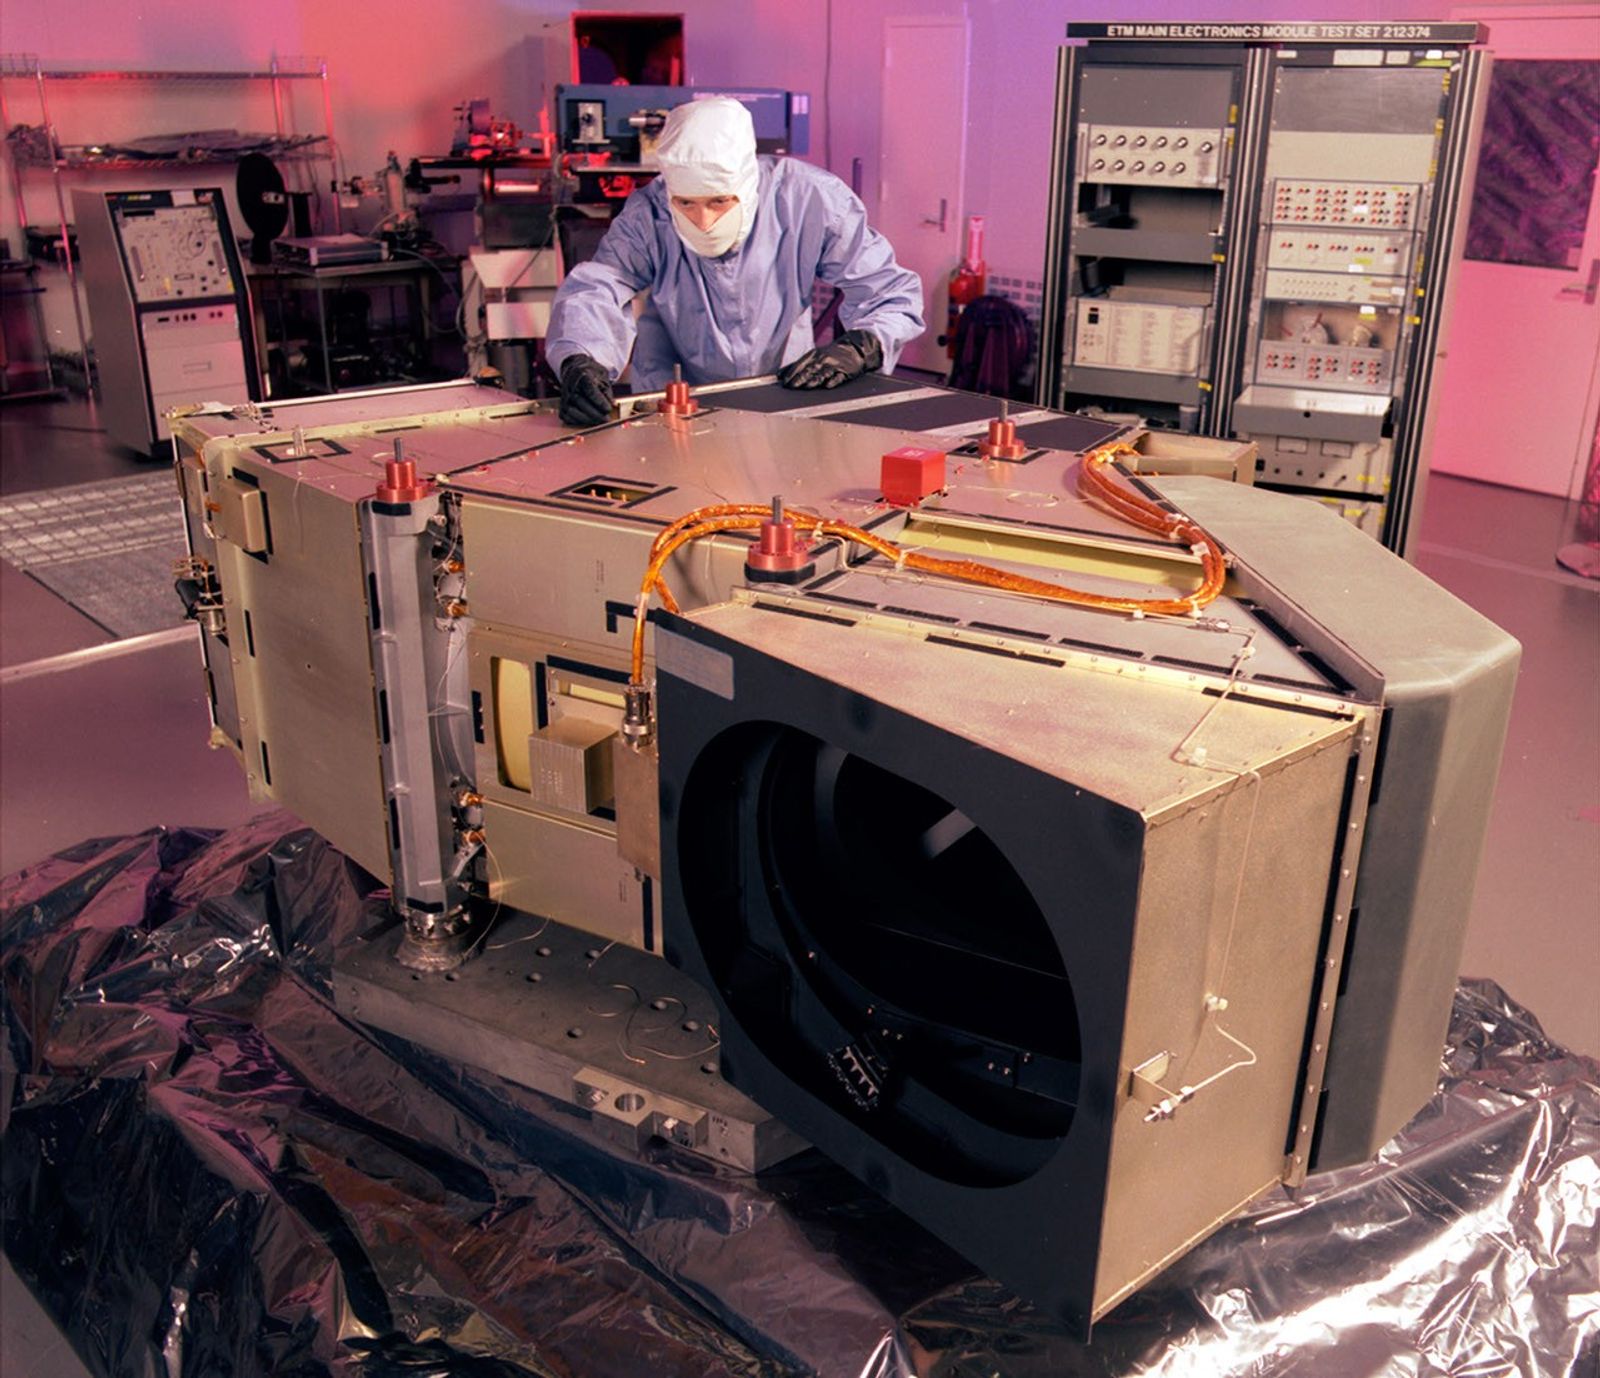
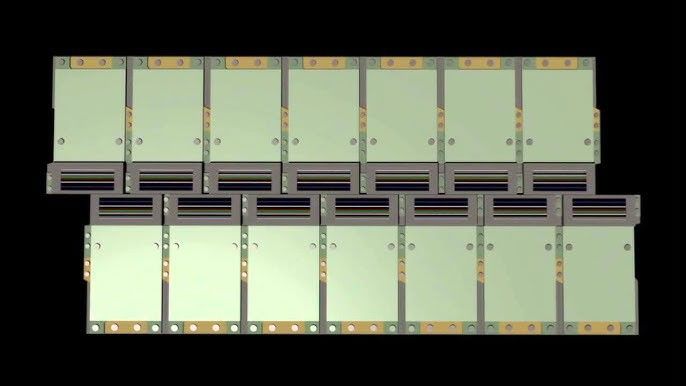
OLI’s design is an advancement in Landsat sensor technology and uses an approach demonstrated by the Advanced Land Imager (ALI) sensor flown on NASA’s experimental EO-1 satellite in 2000. Instruments on earlier Landsat satellites employed scan mirrors to sweep the instrument fields of view across the surface swath width and transmit light to a few detectors. OLI instead uses long detector arrays, with over 7,000 detectors per spectral band, aligned across its focal plane to view across the swath. This “push-broom” design results in a more sensitive instrument providing improved land surface information with fewer moving parts. With an improved signal-to-noise ratio compared to past Landsat instruments, OLI is more reliable and provides improved performance.
Signal-to-noise ratio (SNR) refers to the ratio of reflected or emitted energy from the Earth’s surface compared to other noise from the instrument itself or external interference. A higher SNR means that the sensor is able to better distinguish the “true” measurements from noise. This produces clearer, more precise data and improves science algorithms.
OLI’s spectral bands have better SNRs than those on previous Landsat instruments. Several design improvements were made to achieve this:
- Pushbroom architecture: The switch from a whiskbroom to pushbroom architecture reduces moving parts within the sensor, resulting in less mechanical noise
- Narrower spectral bands: Narrower band widths were chosen to minimize atmospheric absorption to improve signal clarity
- Onboard calibration: Multiple internal calibration sources keep measurements consistent
- 14-bit quantization: OLI collects 12-bit and 14-bit data on Landsat 8 and 9, respectively, compared to 8-bit for the TM and ETM+ sensors. This improved radiometric resolution enables finer detection of brightness values
The advanced detector technology uses silicon construction for visible and near-infrared bands and Mercury-cadmium-telluride photodiodes for SWIR bands. It achieved superior signal-to-noise ratios ranging 100-300 at 5% maximum radiance versus ETM+'s 15-50. The design includes a comprehensive calibration subsystem featuring shutter and diffuser wheel assemblies, solar diffuser panels, and stimulation lamp assemblies. These technological advances improved the ability to classify images, detect land cover change, and map environmental features and conditions.
Spectral Bands
OLI incorporates nine spectral bands, including refinements to existing ETM+ bands and two new additions (see Table 1). Several band widths were refined to avoid atmospheric absorption features, with the most significant change occurring in band 5 (0.845–0.885 μm), which excludes a water vapor absorption feature present in the ETM+ near infrared band. The panchromatic band (band 8; 0.50-0.68 μm) was narrowed to create greater contrast between vegetated and non-vegetated surfaces. Two new bands were added: a blue band (band 1; 0.433–0.453 μm) primarily for coastal ocean color observations, and a shortwave infrared band (band 9; 1.360–1.390 μm) positioned over a strong water vapor absorption feature for cirrus cloud detection. The refined near-infrared band and new shortwave infrared band closely match spectral bands collected by the MODIS instruments on Terra and Aqua satellites, enhancing data compatibility and continuity.
Spectral Response
Spectral Characteristics Viewer
The Spectral Characteristics Viewer allows users to evaluate satellite sensor bands that may be best suited for application research related to the available targets.
If you have questions or need further information, please contact us.

Selected Publications
Irons, J. R., Dwyer, J. L., & Barsi, J. A. (2012). The next Landsat satellite: The Landsat Data Continuity Mission. Remote Sensing of Environment, 122, 11–21. https://doi.org/10.1016/j.rse.2011.08.026
Knight, E. J., & Kvaran, G. (2014). Landsat-8 Operational Land Imager Design, Characterization and Performance. Remote Sensing, 6(11), 10286-10305. https://doi.org/10.3390/rs61110286
Markham, B., Anderson, C., Barsi, J., Choate, M., Donley, E., Efremova, B., Hair, J., Jenstrom, D., Kaita, E., Knight, E., Kvaran, G., Mccorkel, J., Montanaro, M., Morland, E., Pedelty, J., Pearlman, A., Sauer, B., Storey, J., & Wenny, B. (2019). Landsat 9: Mission status and prelaunch instrument performance characterization and calibration. https://ntrs.nasa.gov/api/citations/20200000060/downloads/20200000060.pdf
Masek, J. G., Wulder, M. A., Markham, B., McCorkel, J., Crawford, C. J., & Jenstrom, D. T. (2020). Landsat 9: Empowering open science and applications through continuity. Remote Sensing of Environment, 248(111968). https://doi.org/10.1016/j.rse.2020.111968
Schott, J. R., Gerace, A., Woodcock, C. E., Wang, S., Zhu, Z., Wynne, R. H., & Blinn, C. E. (2016). The impact of improved signal-to-noise ratios on algorithm performance: Case studies for Landsat class instruments. Remote Sensing of Environment, 185, 37–45. https://doi.org/10.1016/j.rse.2016.04.015
Wulder, M. A., White, J. C., Goward, S. N., Masek, J. G., Irons, J. R., Herold, M., Cohen, W. B., Loveland, T. R., & Woodcock, C. E. (2008). Landsat continuity: Issues and opportunities for land cover monitoring. Remote Sensing of Environment, 112(3), 955–969. https://doi.org/10.1016/j.rse.2007.07.004