


![Request for Information – Potential [Placeholder for Prize]](https://assets.science.nasa.gov/dynamicimage/assets/science/psd/solar/2023/09/s/solarsystem_0.jpg?w=1024)


World of Change: Sprawling Shanghai
Geographers who have studied the growth of China’s cities over the past four decades tend to sum up the pace of change with one word: unprecedented. In 1960, about 110 million Chinese people—or 16 percent of the population—lived in cities. By 2018, the numbers had increased to 820 million and 59 percent. (For comparison, the entire population of the United States was about 330 million people as of December 2019.)
The surge in urbanization began in the 1980s when the Chinese government began opening the country to foreign trade and investment. As markets developed in “special economic zones,” villages morphed into booming cities and cities grew into sprawling megalopolises.
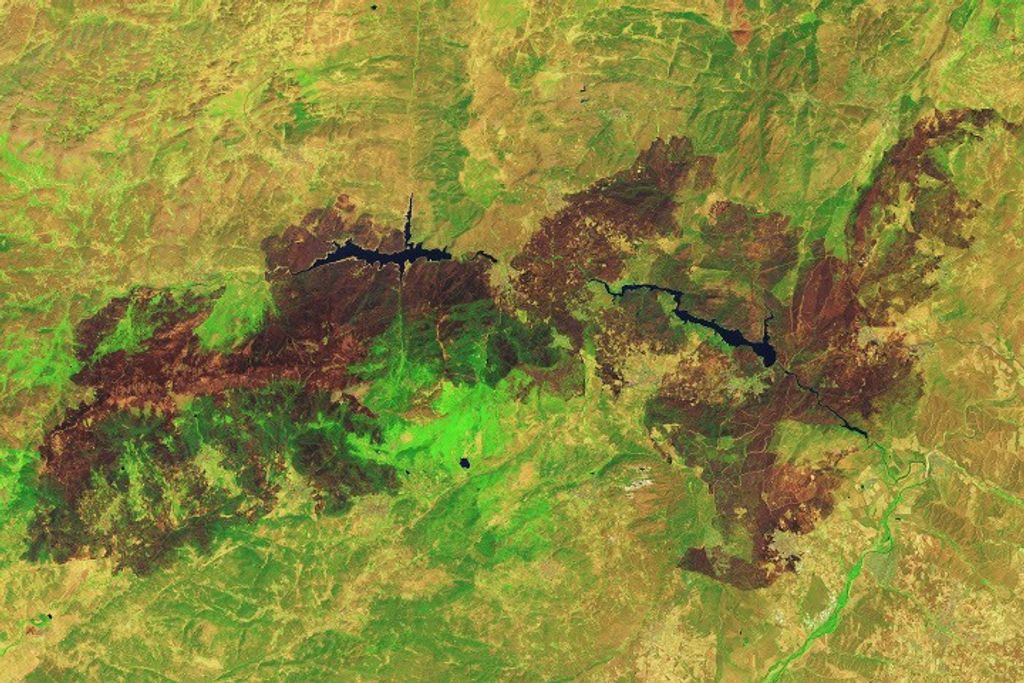
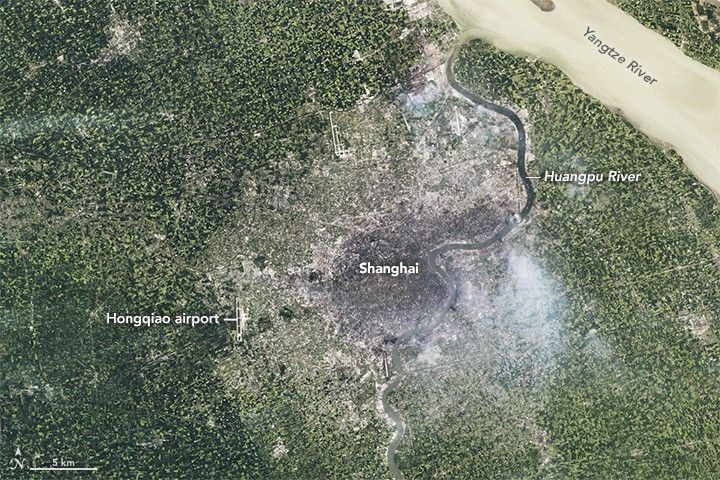
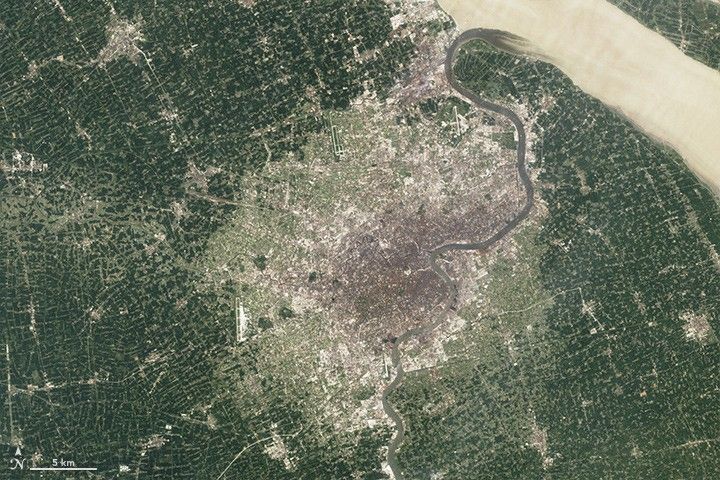
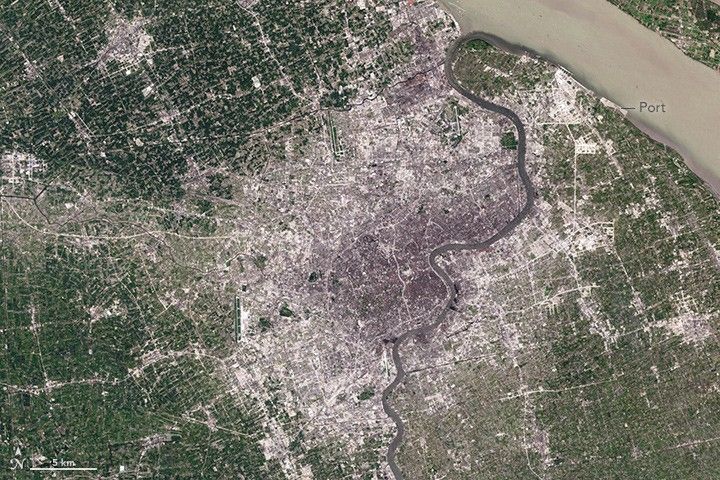
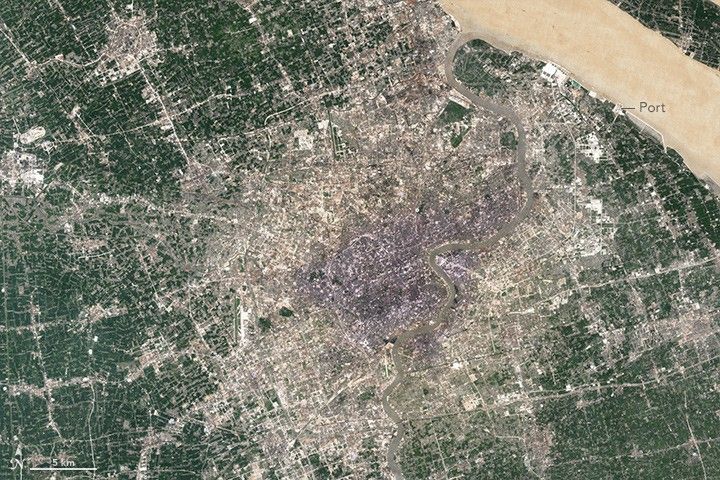
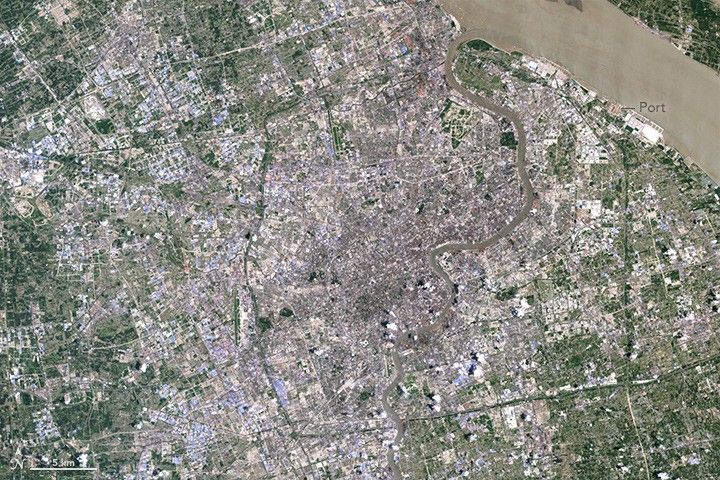
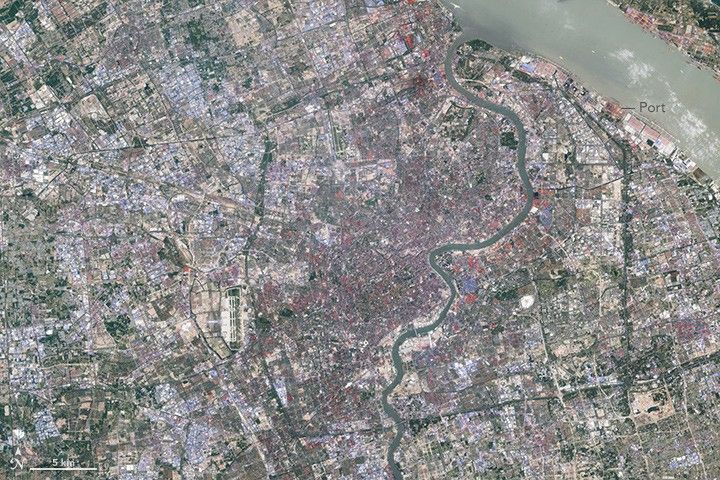
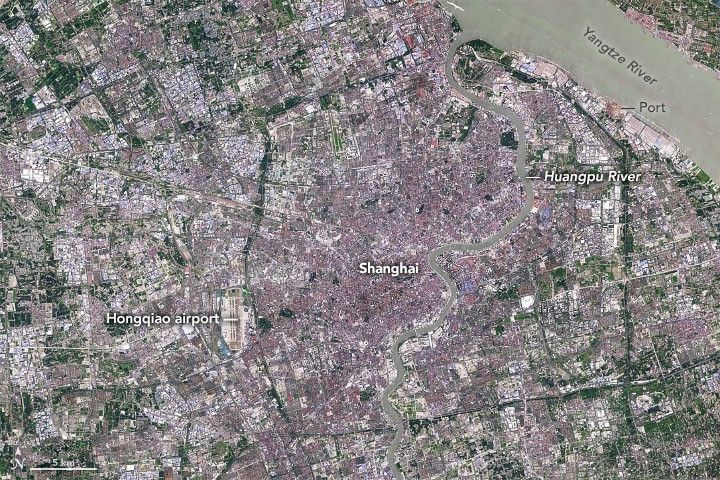
For more than four decades, Landsat satellites have collected images of Shanghai. This series from Landsat 5, 7, and 8 shows the city’s growing footprint between 1984 and 2019. Developed areas appear gray and white; farmland and forests are green; shallow, sediment-filled water is tan.
In 1984, the core of the city was centered on the west bank of the Huangpu River, a manmade tributary of the Yangtze River. Since then, Shanghai has expanded in all directions, filling in what had mainly been farmland with new housing, factories, shopping, parking lots, and roads. Pudong, the once rural district west of Huangpu River, now has a population approaching 6 million people and is home to some of Shanghai’s tallest and most iconic buildings.
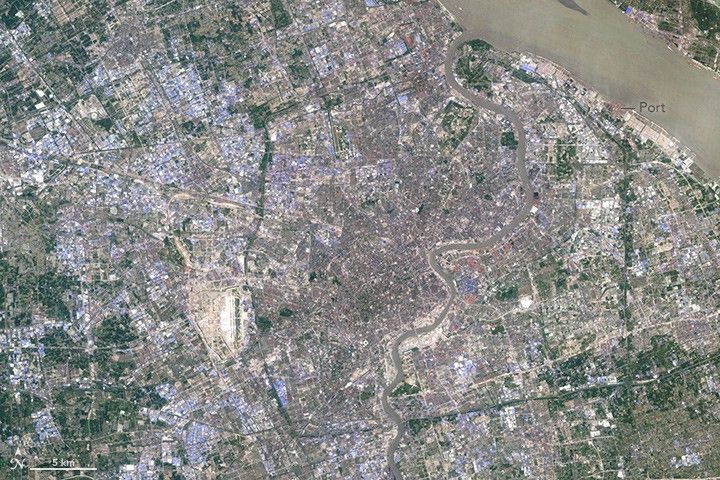
According to one analysis of Landsat imagery, Shanghai had 308 square kilometers (119 square miles) of urban area in 1984. By 2014, the number was 1,302 square kilometers (503 square miles). The core of the city has radiated outward over the decades, but a ring of surrounding towns also expanded and merged with Shanghai. The most rapid expansion occurred between 2000 and 2004, when the city added 243 square kilometers of urban area.
As a point of reference, note the location of Hongqiao International Airport. In 1984, it was bordered by farmland on the westernmost outskirts of the city. Two decades later, development had completely surrounded the airport, which also expanded significantly during that period.
The airport was not the only transportation hub that got an overhaul. Shanghai’s port, which handled less than 1 million twenty-foot equivalent units (TEUs) in 1985, transported more than 42 million TEUs in 2018—enough that it had surpassed Singapore to become the world’s busiest port for container ships.
Though Shanghai’s story has mainly been one of urbanization and paving over open spaces, the images do reveal some signs of greening. Note, for instance, the pentagon-shaped greenway that becomes visible in the 2004 image. The greenway is part of a network of parks and forested areas built around a major highway (S20). City planners established the greenway as part of a broader attempt to give residents some access to green spaces.
The composite images below show how the wider region along the Yangtze River Delta has expanded since 1984. Note how neighboring cities like Suzhou and Wuxi have slowly merged with Shanghai to create one continuous megalopolis.
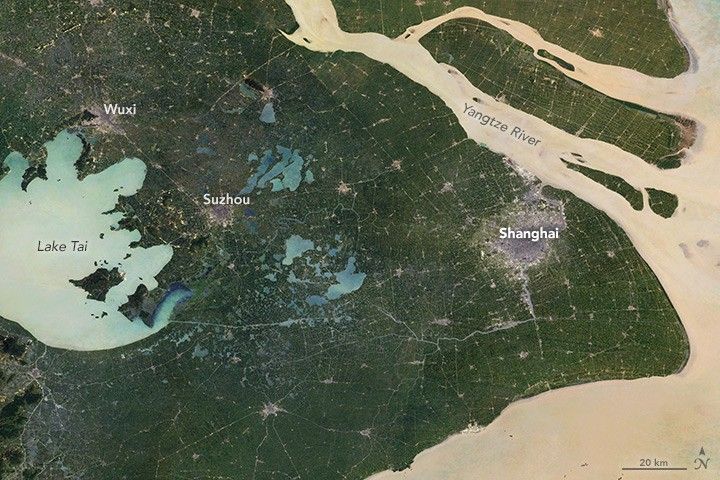

Unlike the images at the top of the page, each of which captures one day roughly every five years, these “best-pixel mosaics” are made up of small parts of many images captured over five-year periods. The first image is a mosaic of scenes captured between 1984 and 1988; the second shows the best pixels captured between 2013 and 2017. This technique makes it possible to strip away clouds and haze, which are common in Shanghai.
Just as Shanghai has expanded rapidly in recent decades, so have towns and cities in the broader Yangtze River Delta. A 2015 World Bank report noted that 7,734 square kilometers in the Yangtze River Delta Economic Zone—which includes Shanghai, Suzhou, Wuxi, and several other cities—became urban between 2000 and 2010. That is an area equivalent to 88 Manhattans. During that period, population in that zone increased by 21 million people.
The rapid pace of development has changed Shanghai’s natural ecosystems, particularly its wetlands. Research shows that sea level rise, erosion, dredging, and the construction of water storage infrastructure have all contributed to wetland loss. The creation of new coastal land—by piling sediment onto tidal flats in a process called land reclamation—also had a major impact on wetlands, destroying them in some areas and creating them in others. In the mosaics, note the new land that emerges along the eastern side of the islands and along the nose-shaped peninsula.
Replacing forests and farmland with concrete has raised the city’s temperature—a phenomenon known as the urban heat island effect. Chinese researchers working with thermal sensors on Landsat showed that the parts of Shanghai with elevated temperatures increased 81 percent between 1984 and 2014, though they also found that urban greening efforts had slowed the growth of heat islands.
Despite the dizzying pace of urbanization, there are signs that Shanghai’s growth is tapering off. In recent years, officials have said that they will cap the city’s population at 25 million in the hopes of easing the pressure on the environment, the infrastructure, and city services.
Editor’s Note: In the series of images at the top of the page, there are slight differences in the color of the vegetation, the river, and the city. Since the images were taken over three decades by three different sensors, achieving a perfect color match is not possible.
References
- Atlas of Urban Expansion (2015) Shanghai. Accessed December 9, 2019.
- The Atlantic (2016, August 7) 26 Years of Growth: Shanghai Then and Now. Accessed December 9, 2019.
- Cui, L. & Shi, J. (2012, December) Urbanization and its environmental effects in Shanghai, China. Urban Climate, 2, 1-15.
- New Geography (2019, March 27) Beijing and Shanghai Limit Population Growth. Accessed December 9, 2019.
- Schneider, A. et al. (2015, March 3) A new urban landscape in East–Southeast Asia, 2000–2010. Environmental Research Letters, 10 (3).
- Tan, J. et al. (2010, January) The urban heat island and its impact on heat waves and human health in Shanghai. International Journal of Biometeorology, 54 (1), 75–84.
- Tian, B. et al. (2016, March 5) Drivers, trends, and potential impacts of long-term coastal reclamation in China from 1985 to 2010. Estuarine, Coastal, and Shelf Science, 170, 83-90.
- Tian, B. et al. (2015, October) Detecting wetland changes in Shanghai, China using FORMOSAT and Landsat TM imagery. Journal of Hydrology, 529 (1), 1-10.
- The World Bank (2015) China: Urban population (% of total). Accessed December 9, 2019.
- World Bank Group (2015, January 26) East Asia’s Changing Urban Landscape: Measuring a Decade of Spatial Growth. Accessed December 9, 2019.
- World Shipping Council (2019) Top 50 World Container Ports. Accessed December 9, 2019.
- Zhao, S. et al. (2015, July 27) Spatial and Temporal Dimensions of Urban Expansion in China. Environmental Science & Technology, 49, 9600-9609.
- Zhao, M. et al. (2016, April 26) Influence of urban expansion on the urban heat island effect in Shanghai. International Journal of Geographical Information Science, 30 (12), 1-21.


