


1 min read
Centaur 29P Outgassing (NIRSpec)
NASA’s James Webb Space Telescope observed Centaur 29P/Schwassmann-Wachmann 1, one of the most active objects in the outer solar system. Centaurs are “hybrid” objects in the sense that they share characteristics with trans-Neptunian objects from the Kuiper Belt reservoir and short-period comets.
A team of scientists used Webb’s NIRSpec (Near-Infrared Spectrograph) instrument to study Centaur 29P. While data from previous radio-wavelength observations of Centaur 29P showed a carbon monoxide (CO) gas jet pointed toward Earth, Webb parsed the jet’s composition in greater detail, and also detected multiple never-before-seen features of the centaur: two jets of carbon dioxide (CO2) emanating in the north and south directions, and another jet of CO pointing toward the north.
Centaur 29P’s different CO and CO2 abundances suggest that the body may be composed of different pieces that coalesced together during its formation. However, other scenarios to explain Centaur 29P’s outgassing activity are still being considered.
Extended Description and Image Alt Text
Extended Description
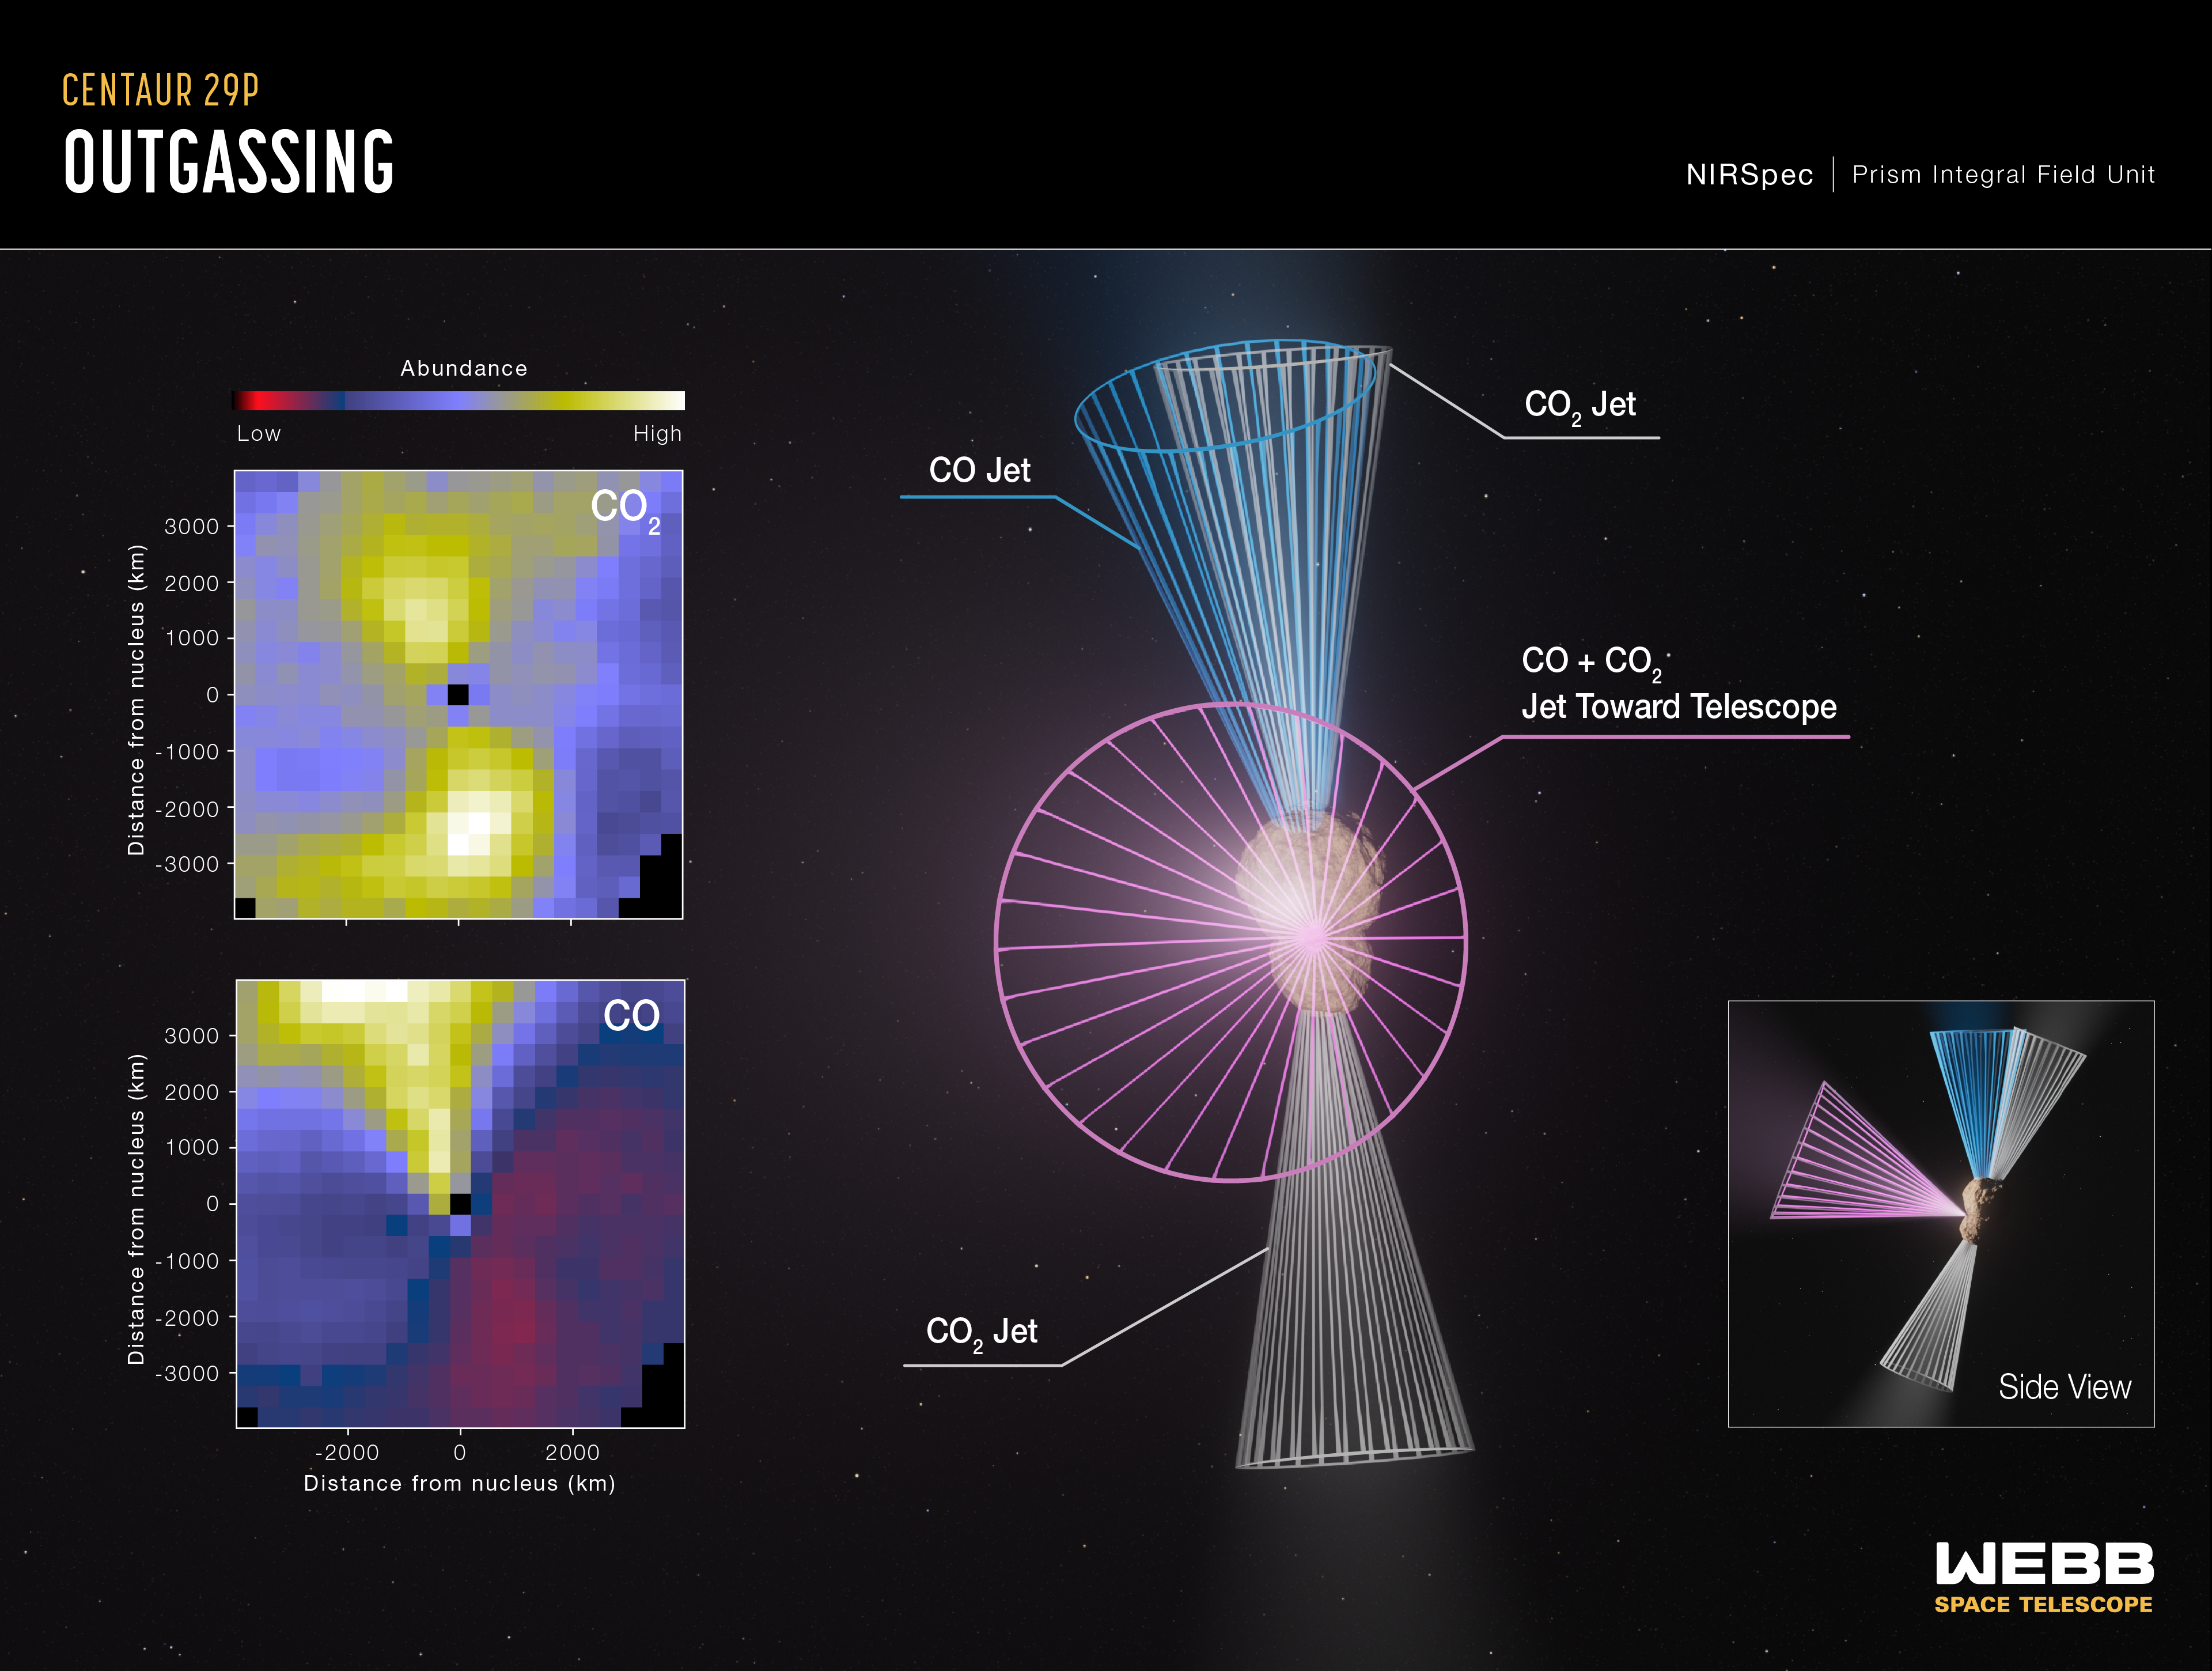
Graphic titled “Centaur 29P Outgassing: NIRSpec, Prism Integral Field Unit” with maps showing the abundances of carbon dioxide and carbon monoxide surrounding Centaur 29P/Schwassmann-Wachmann 1 at the left, and two artist’s concepts with graphic overlays showing jets of CO2 and CO emanating from the centaur at the right. White and yellow logo text in the bottom right corner reads “Webb Space Telescope.”
Maps
The two maps are arranged vertically, with the map labeled CO2 at the top and the map labeled CO at the bottom. Both maps are square, with both the vertical and horizontal axes labeled “Distance from nucleus (km).” On both maps, the vertical scale ranges from negative 4,000 kilometers at the bottom to positive 4,000 kilometers at the top, labeled in even increments of 1,000 kilometers, beginning at negative 3,000 and ending at positive 3,000. The horizontal scale ranges from negative 4,000 kilometers at the left to positive 4,000 kilometers at the right, with labels at negative 2,000, 0, and positive 2,000.
At the center of each map (coordinates 0, 0) is a black square representing Centaur 29P’s nucleus.
Above the maps is a color scale bar titled “Abundance” that starts as dark red at the left before gradually changing to blue, then yellow, and ends as white at the right. The left end (dark red) is labeled “Low” while the right end (white) is labeled “High.” The blue area of the bar represents low-intermediate abundance, while the yellow area is high-intermediate abundance.
The top map shows the distribution and abundance of CO2 gas around Centaur 29P’s nucleus. Two yellow-white (high abundance of CO2) bulbous plumes extend from the black square on the map, one reaching above and one below. The regions to the left and right of the nucleus on the map are purple-blue in color (low-intermediate to low abundance of CO2). The lower left and right corners of the map are black.
The bottom map is similar to the top map, but shows the distribution and abundance of CO around Centaur 29P’s nucleus. A single yellow-white (high-intermediate to high abundance of CO) bulbous plume extends from the black square toward the top left corner. The regions immediately to the left and right of the gas plume on the map are purple-blue (low-intermediate to low abundance of CO), while the lower diagonal half of the map is dark blue and red (very low abundance of CO). The lower left and right corners are black.
Artist's Concepts
At right is an artist’s concept of Centaur 29P with graphic overlays and labeled features. Centaur 29P is depicted as a light brown body with a rocky surface. The centaur’s nucleus is bilobed, resembling the simplified shape of a peanut. Emanating from the central surface area of Centaur 29P are many purple lines that connect to a large purple circle, similar to a wheel with spokes. The purple circle is labeled “CO and CO2 Jet Toward Telescope.” Two gray cones extend from the top (north) and bottom (south) ends of the nucleus, one points upward and the other points downward. Both of the gray cones are labeled “CO2 Jet.” The top end of the body also has a blue cone extending upward (in the north direction) and is labeled “CO Jet.”
Toward the lower right corner is a small square labeled “Side View” that shows a side view of the artist’s concept of Centaur 29P with the same graphic overlays. From this perspective, the purple front jet points toward the left. The gray cones that represent the CO2 jets are still pointing in the north and south directions, and the blue CO jet is pointing toward the north.
Image Alt Text
Graphic titled “Centaur 29P Outgassing: NIRSpec Prism Integral Field Unit” with maps showing the abundances of C O and C O 2 surrounding Centaur 29P/Schwassmann-Wachmann 1 at the left, and two artist’s concepts with graphic overlays showing jets of CO and C O 2 emanating from the centaur at the right.
- Release DateOctober 2, 2024
- Science ReleaseNASA’s Webb Reveals Unusual Jets of Volatile Gas from Icy Centaur 29P
- CreditIllustration: NASA, ESA, CSA, Leah Hustak (STScI), Sara Faggi (NASA-GSFC, American University)
Related Images & Videos
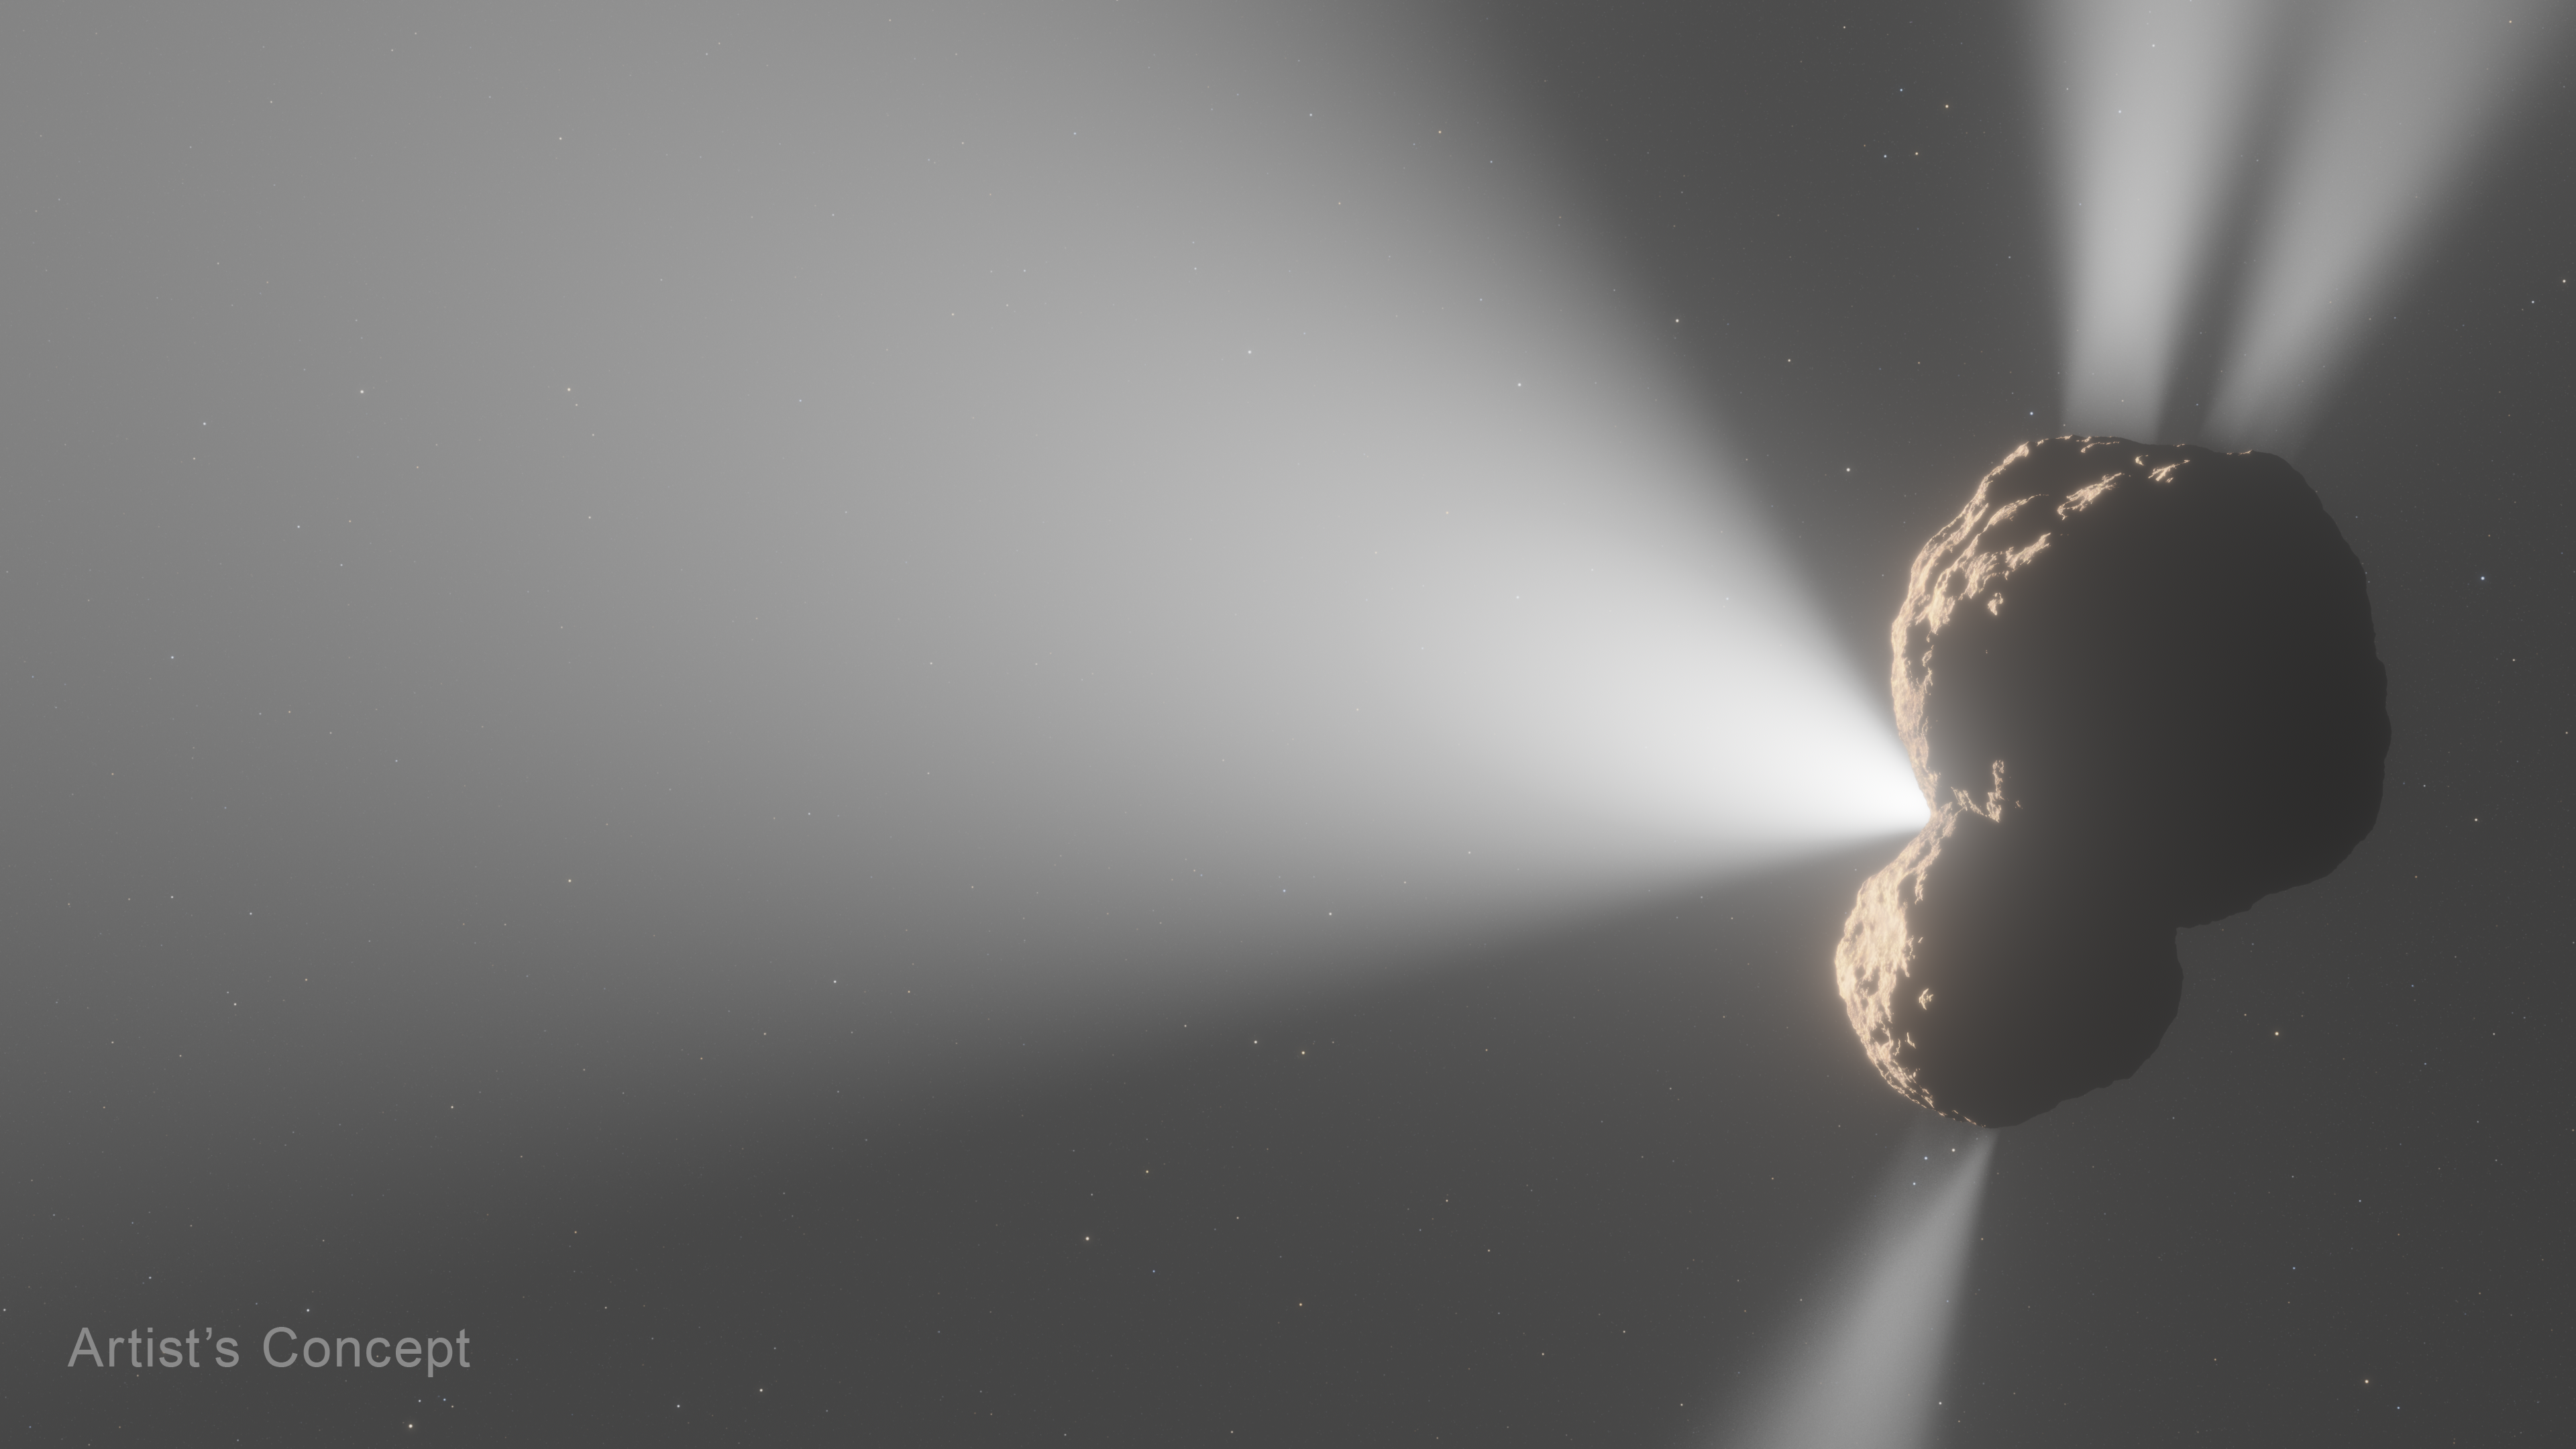
Centaur 29P Outgassing (Artist's Concept)
An artist’s concept of Centaur 29P/Schwassmann-Wachmann 1’s outgassing activity as seen from the side. Prior radio-wavelength observations noted a jet composed of carbon monoxide (CO) gas pointed toward Earth, shown at left from this angle. Astronomers used NASA’s James Webb...
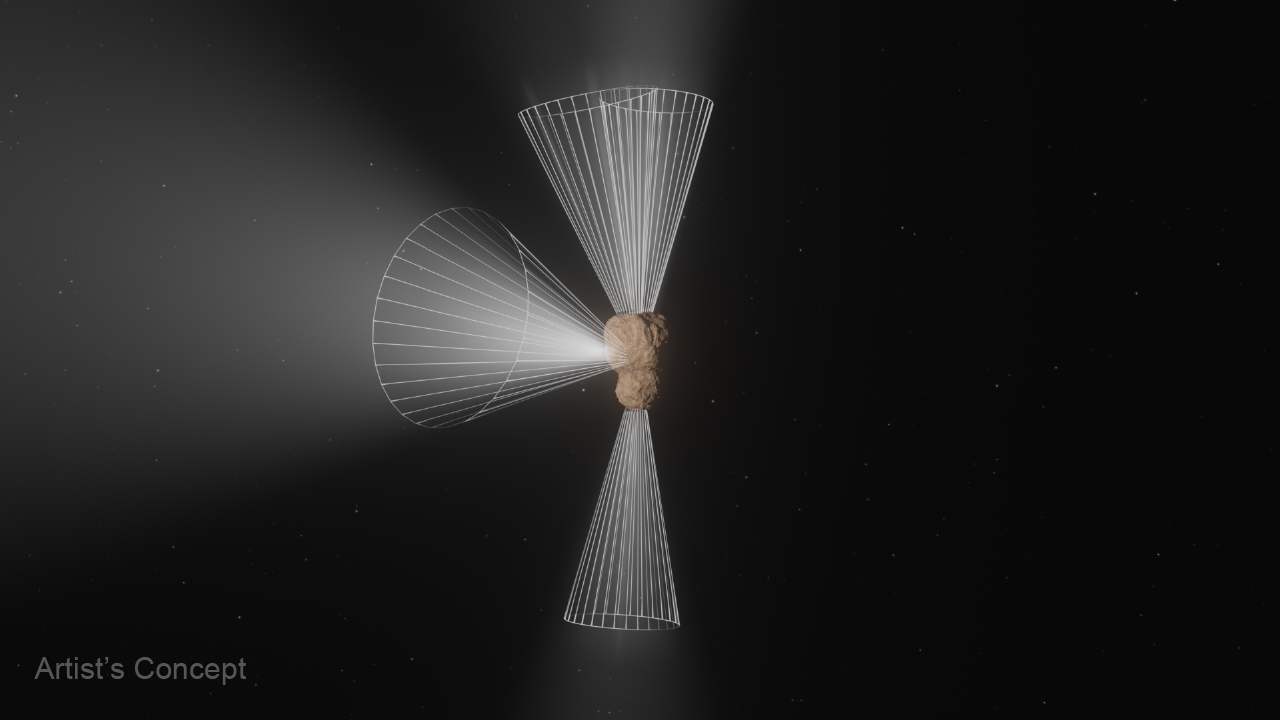
Centaur 29P Outgassing (Artist's Concept)
This is an animation portraying the outgassing activity of Centaur 29P/Schwassmann-Wachmann 1 based on data gathered by NASA’s James Webb Space Telescope’s NIRSpec (Near-Infrared Spectrograph) instrument. Centaur 29P is one of the most active objects in the outer solar system,...
Share
Details
Laura Betz
NASA’s Goddard Space Flight Center
Greenbelt, Maryland
laura.e.betz@nasa.gov
NASA, ESA, CSA, Leah Hustak (STScI), Sara Faggi (NASA-GSFC, American University)


