


1 min read
Exoplanet WASP-39 b (Transmission Spectra)
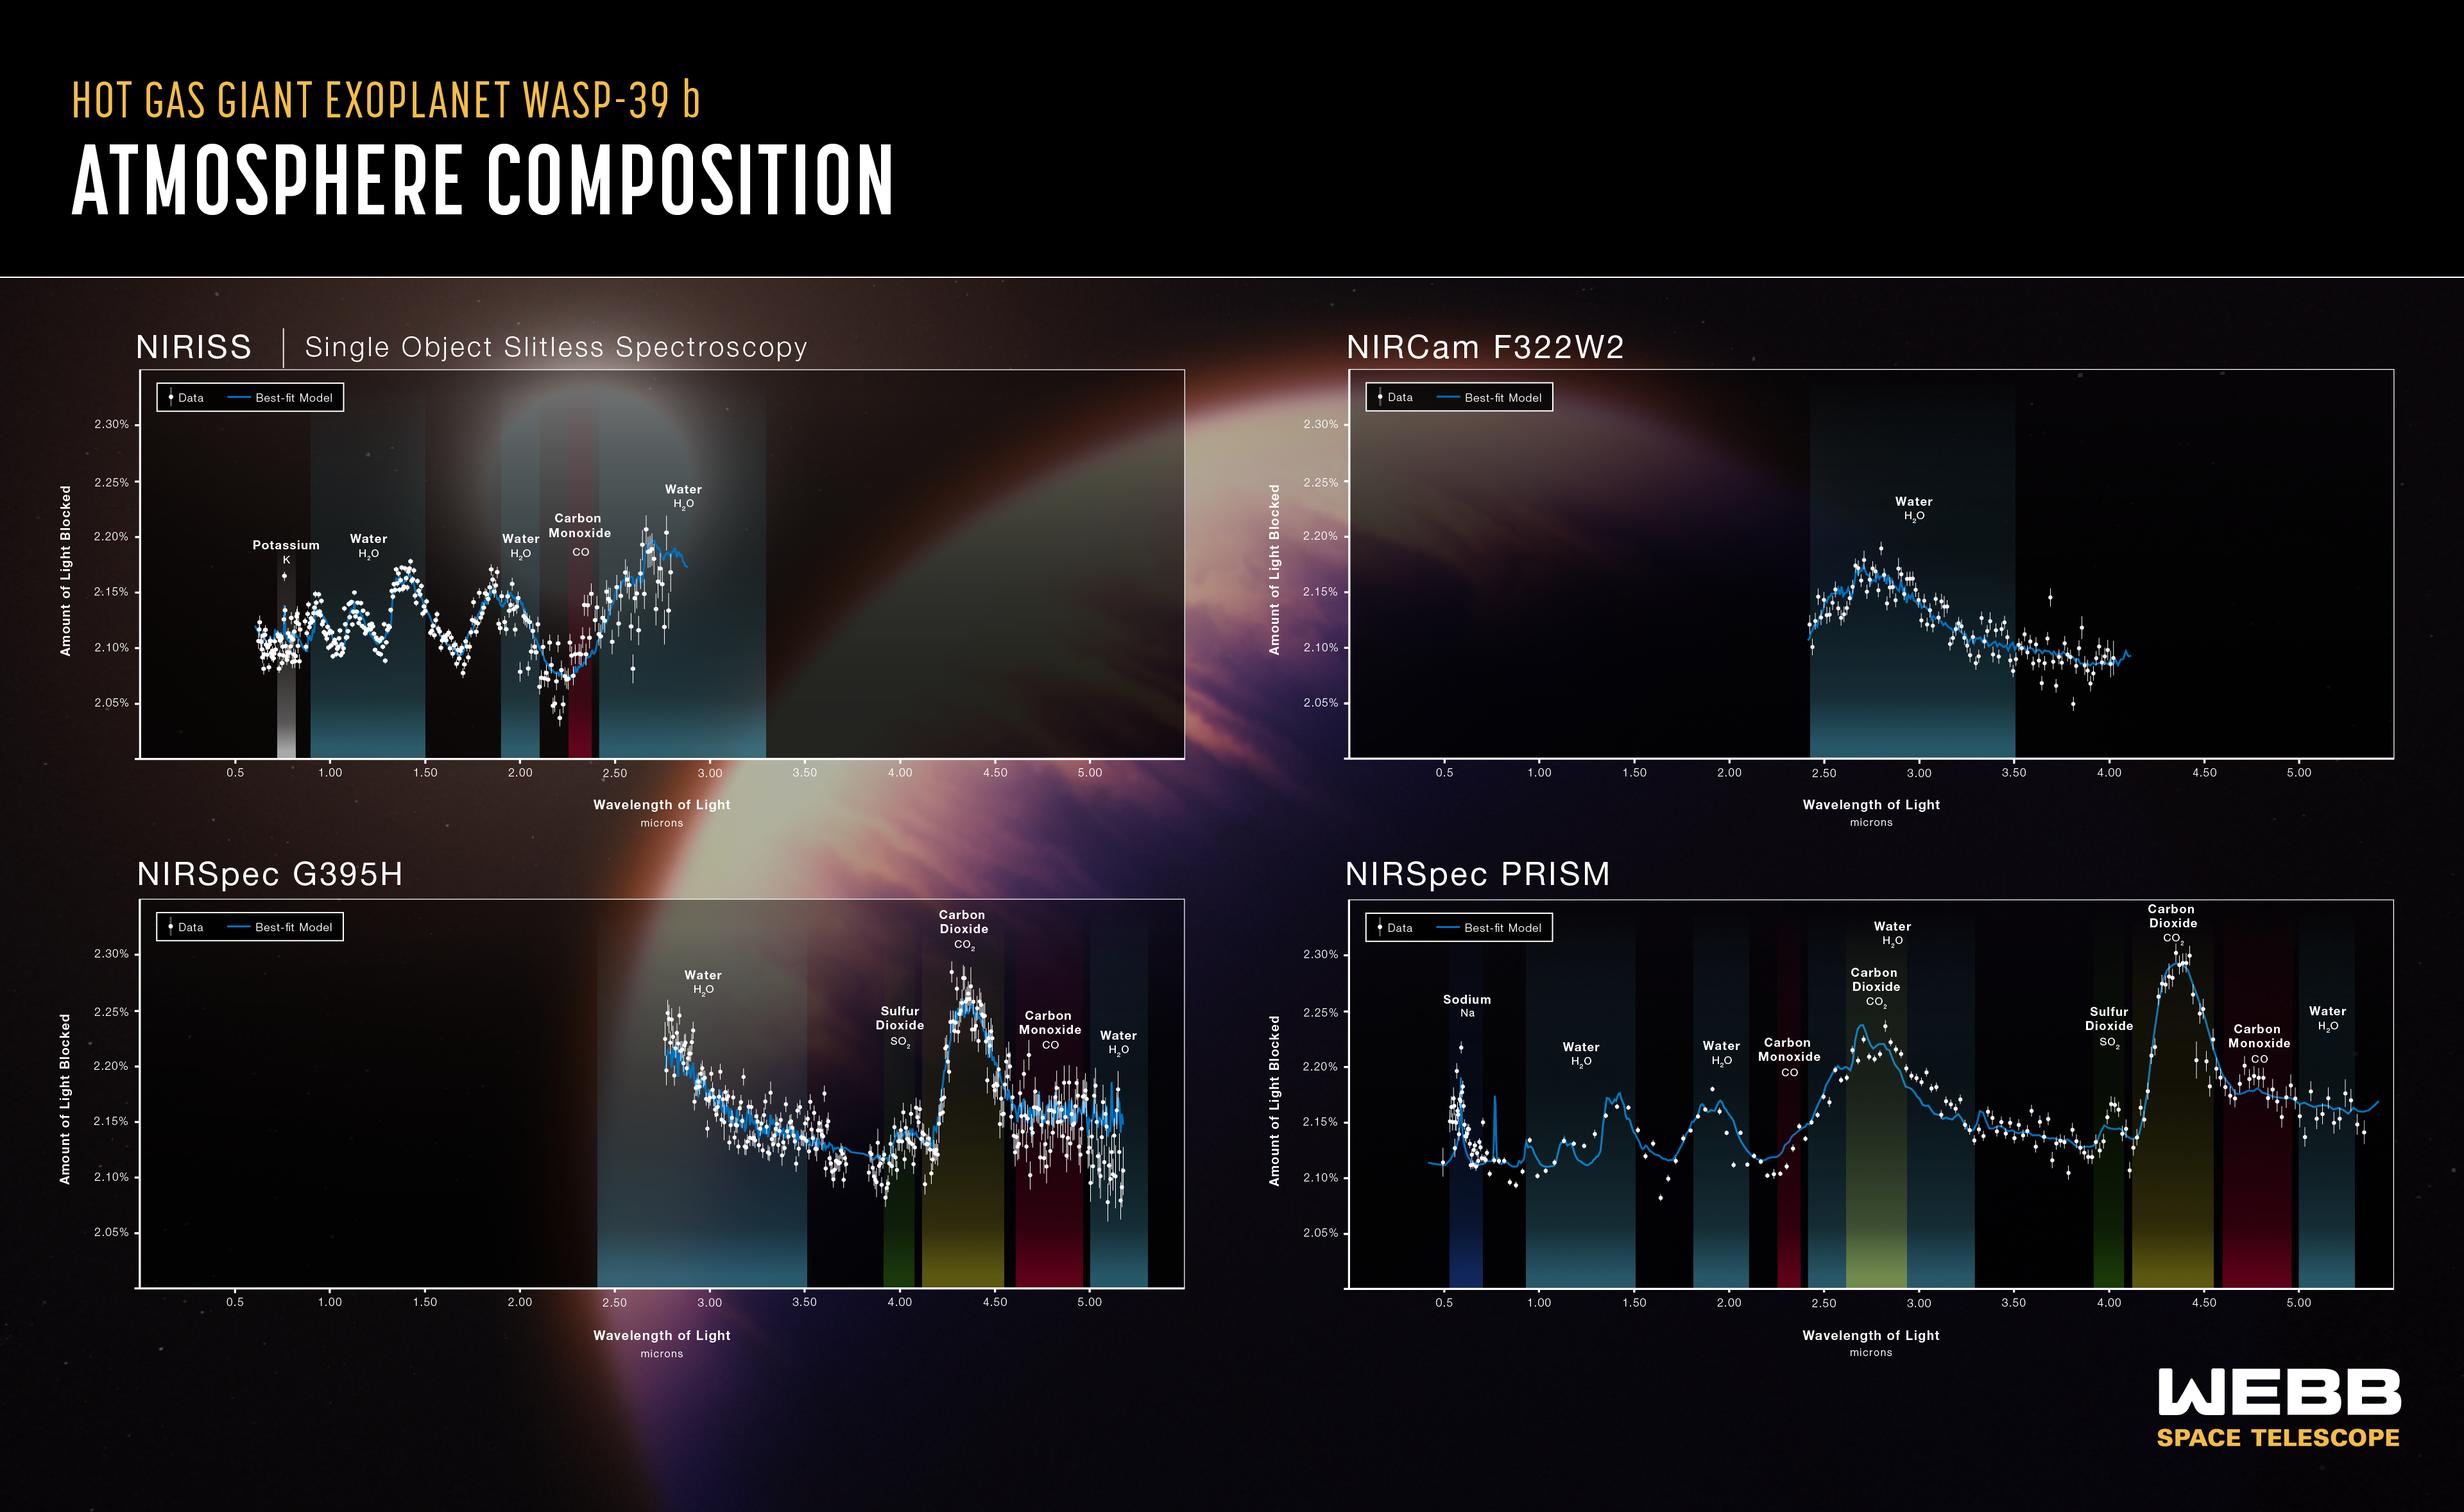
The atmospheric composition of the hot gas giant exoplanet WASP-39 b has been revealed by NASA’s James Webb Space Telescope. This graphic shows four transmission spectra from three of Webb’s instruments operated in four instrument modes. All are plotted on a common scale extending from 0.5 to 5.5 microns. This graphic, as well as all four of the component elements, are available for download from the links at the left side of this page.
A transmission spectrum is made by comparing starlight filtered through a planet’s atmosphere as it moves in front of the star, to the unfiltered starlight detected when the planet is beside the star. Each of the data points (white circles) on these graphs represents the amount of a specific wavelength of light that is blocked by the planet and absorbed by its atmosphere. Wavelengths that are preferentially absorbed by the atmosphere appear as peaks in the transmission spectrum.
The blue line is a best-fit model that takes into account the data, the known properties of WASP-39 b and its star (e.g., size, mass, temperature), and assumed characteristics of the atmosphere. Researchers can vary the parameters in the model – changing unknown characteristics like cloud height in the atmosphere and abundances of various gases – to get a better fit and further understand what the atmosphere is really like.
At upper left, data from NIRISS shows fingerprints of potassium (K), water (H2O), and carbon monoxide (CO). At upper right, data from NIRCam shows a prominent water signature. At lower left, data from NIRSpec indicates water, sulfur dioxide (SO2), carbon dioxide (CO2), and carbon monoxide (CO). At lower right, additional NIRSpec data reveals all of these molecules as well as sodium (Na).
Extended Description and Image Alt Text
Extended Description
Graphic titled “Hot Gas Giant Exoplanet WASP-39 b Atmosphere Composition.” The graphic includes four graphs—transmission spectra—arranged in a 2 by 2 grid with an illustration of the planet and its star in the background.
All four graphs are identical in scale and design, showing amount of light blocked in percent on the vertical y axis versus wavelength of light in microns on the horizontal x axis.
The y-axis for each graph ranges from 2% (less light blocked) at the origin on the bottom to 2.35% (more light blocked) at the top, with labeled tick marks are labeled every 0.05%, starting at 2.05% and ending at 2.30%.
The x-axis for each graph ranges from less than 0.01 microns on the left to 5.5 microns on the right, with labeled tick marks every 0. 5 microns, starting at 0.5.
Each graph includes a key showing that the solid white circles centered on gray vertical lines represent data points, and a blue solid line represents a best-fit model.
On each graph, one or more prominent peaks or more subtle features visible in the data and model are highlighted and labeled. These include sodium (Na), potassium (K), water (H2O), carbon monoxide (CO), carbon dioxide (CO2), hydrogen sulfide (H2S), and sulfur dioxide (SO2).
Top Left: NIRISS Single Object Slitless Spectroscopy
The graph labeled NIRISS consists of 327 data points, each with a gray error bar. The points range in wavelength from 0.63 to 2.8 microns, and in amount of light blocked from 2.04% to 2.21The data points are not connected. They follow a jagged trend from left to right, with a number of broad peaks and valleys. A solid blue line with several prominent peaks and valleys represents the best-fit model. The blue best-fit model line generally follows the trend of the data. It intersects some data points, but does not match the data perfectly.
Five bands are highlighted with colored semi-transparent vertical bars, each labeled with an element or compound. These correspond to spectral features. Some of the features overlap.
- A potassium (K) feature, highlighted in gray, spans from 0.72 to 0.82 microns.
- Three water (H2O) features, highlighted in light blue, span from 0.9 to 1.5 microns; 1.72 to 2.16 microns; and 2.40 to 3.25 microns.
- One carbon monoxide (CO) feature, highlighted in red, spans from 2.30 to 2.40 microns.
Some of the features—including water and carbon dioxide—are characterized by prominent peaks apparent in the data and model, and others are subtler.
Top Right: NIRCam F322W2
The graph labeled NIRCam F322W2 consists of 107 data points, each with a gray error bar. The points range in wavelength from 2.4 to 4.0 microns, and in amount of light blocked from 2.05% to 2.19%. The data points are not connected. They follow a jagged trend from left to right, with one broad centered at about 2.75 microns. A solid blue line with several prominent peaks and valleys represents the best-fit model. The blue best-fit model line generally follows the trend of the data. It intersects some data points, but does not match the data perfectly.
One water (H2O) feature, highlighted in light blue, spans from 2.40 to 3.5 microns.
Bottom Left: NIRSpec G395H
The graph labeled NIRSpec G395H consists of 344 data points, each with a gray error bar. The points range in wavelength from 2.8 to 5.2 microns, and in amount of light blocked from 2.08% to 2.29%. The data points are not connected. They follow a jagged trend from left to right, with a number of broad peaks and valleys. A solid blue line with several prominent peaks and valleys represents the best-fit model. The blue best-fit model line generally follows the trend of the data. It intersects some data points, but does not match the data perfectly.
Five wavelength bands are highlighted with colored semi-transparent vertical bars, each labeled with an element or compound. These correspond to spectral features. Some of the features overlap.
- Two water (H2O) features, highlighted in light blue, span from 2.40 to 3.5 microns and 5.00 to 5.35 microns.
- One sulfur dioxide (SO2) feature, highlighted in green, spans from 3.96 to 4.10 microns.
- One carbon dioxide (CO2) feature, highlighted in yellow, spans from 4.16 to 4.58 microns.
- One carbon monoxide (CO) feature, highlighted in red, spans 4.60 to 4.96 microns.
Some of the features—including water and carbon dioxide—are characterized by prominent peaks in the data and model. The other features are subtler.
Bottom Right: NIRSpec PRISM
The graph labeled NIRSpec PRISM consists of 209 data points, each with a gray error bar. The points range in wavelength from 0.5 to 5.5 microns, and in amount of light blocked from 2.08% to 2.30%. The data points are not connected. They follow a jagged trend from left to right, with a number of broad peaks and valleys. A solid blue line with several prominent peaks and valleys represents the best-fit model. The blue best-fit model line generally follows the trend of the data. It intersects some data points, but does not match the data perfectly.
Ten wavelength bands are highlighted with colored semi-transparent vertical bars, each labeled with an element or compound. These correspond to spectral features. Some of the features overlap.
- A sodium (Na) feature, highlighted in blue, spans from 0.52 to 0.70 microns.
- Four water (H2O) features, highlighted in light blue, span from 0.9 to 1.5 microns; 1.72 to 2.16 microns; 2.40 to 3.25 microns; and 5.00 to 5.35 microns.
- Two carbon monoxide (CO) features, highlighted in red, span from 2.30 to 2.40 microns and 4.60 to 4.96 microns.
- Two carbon dioxide (CO2) features, highlighted in yellow, span from 2.65 to 2.90 microns and 4.16 to 4.58 microns.
- A sulfur dioxide (SO2) feature, highlighted in green, spans from 3.96 to 4.10 microns.
Some of the features—including water, carbon dioxide, and sodium—are characterized by prominent peaks or sets of peaks apparent in the data and model, and others are subtler.
Background
In the background of the graphic is an illustration of the planet and its star. The planet has a fuzzy orange-blue atmosphere with hints of longitudinal cloud bands below. The left quarter of the planet (the side facing the star) is lit, while the rest is in shadow. The star is bright yellowish-white, with no clear features.
Image Alt Text
Four graphs of amount of light blocked versus wavelength of light. Each graph includes data points, a model, and a number of element and compound features labeled.
About the Object
- R.A. PositionR.A. PositionRight ascension – analogous to longitude – is one component of an object's position.14:29:18.42
- Dec. PositionDec. PositionDeclination – analogous to latitude – is one component of an object's position.+03:26:40.2
- ConstellationConstellationOne of 88 recognized regions of the celestial sphere in which the object appears.Virgo
- DistanceDistanceThe physical distance from Earth to the astronomical object. Distances within our solar system are usually measured in Astronomical Units (AU). Distances between stars are usually measured in light-years. Interstellar distances can also be measured in parsecs.700 light-years
About the Data
- Data DescriptionData DescriptionProposal: A description of the observations, their scientific justification, and the links to the data available in the science archive.
Science Team: The astronomers who planned the observations and analyzed the data. "PI" refers to the Principal Investigator.
- Object NameObject NameA name or catalog number that astronomers use to identify an astronomical object.WASP-39 b
- Object DescriptionObject DescriptionThe type of astronomical object.Hot gas giant exoplanet
- Release DateNovember 22, 2022
- Science ReleaseNASA’s Webb Reveals an Exoplanet Atmosphere as Never Seen Before
- CreditIllustration: NASA, ESA, CSA, Joseph Olmsted (STScI)
Downloads
Related Images & Videos
Exoplanet WASP-39 b and its Star (Illustration)
This illustration shows what exoplanet WASP-39 b could look like, based on current understanding of the planet. WASP-39 b is a hot, puffy gas giant with a mass 0.28 times Jupiter (0.94 times Saturn) and a diameter 1.3 times greater than Jupiter, orbiting just 0.0486 astronomical...
Share
Details
Laura Betz
NASA’s Goddard Space Flight Center
Greenbelt, Maryland
laura.e.betz@nasa.gov
NASA, ESA, CSA, Joseph Olmsted (STScI)


