


1 min read
Infinity Galaxy (NIRCam) with Radio Emission Contour Map (VLA)
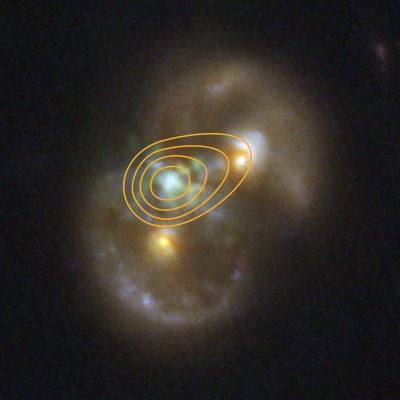
This image of the Infinity Galaxy from NASA’s James Webb Space Telescope’s NIRCam is overlayed with a contour map of data from the Very Large Array radio telescope. The center pinpoint of radio emission perfectly lines up with the center of the glowing gas detected in the infrared in between the two nuclei of the galaxies. The detection of radio emission from supermassive black holes informs researchers about the energetics of the object, specifically how it is pulling in surrounding material.
About the Object
- R.A. PositionR.A. PositionRight ascension – analogous to longitude – is one component of an object's position.10:00:14.2
- Dec. PositionDec. PositionDeclination – analogous to latitude – is one component of an object's position.+02:13:11.7
- ConstellationConstellationOne of 88 recognized regions of the celestial sphere in which the object appears.Sextans
About the Data
- Data DescriptionData DescriptionProposal: A description of the observations, their scientific justification, and the links to the data available in the science archive.
Science Team: The astronomers who planned the observations and analyzed the data. "PI" refers to the Principal Investigator.This image was created with Webb data from proposal 1727 (J. Kartaltepe). Image processing: Alyssa Pagan (STScI).
- InstrumentInstrumentThe science instrument used to produce the data.NIRCam
- FiltersFiltersThe camera filters that were used in the science observations.F090W, F115W, F150W, F200W
- Object NameObject NameA name or catalog number that astronomers use to identify an astronomical object.Infinity Galaxy
- Object DescriptionObject DescriptionThe type of astronomical object.Interacting galaxies
- Release DateJuly 15, 2025
- CreditImage: NASA, ESA, CSA, STScI, VLA, Pieter van Dokkum (Yale)
These images are a composite of separate exposures acquired by the James Webb Space Telescope using the NIRCam instrument. Several filters were used to sample specific wavelength ranges. The color results from assigning different hues (colors) to each monochromatic (grayscale) image associated with an individual filter. In this case, the assigned colors are: Blue: F090W, Green: F115+F150W, Red: F200W
Share
Details
Laura Betz
NASA’s Goddard Space Flight Center
Greenbelt, Maryland
laura.e.betz@nasa.gov
NASA, ESA, CSA, STScI, VLA, Pieter van Dokkum (Yale)


