


1 min read
Kilonova Emission Spectrum

This graphic presentation compares the spectral data of GRB 230307A’s kilonova as observed by the James Webb Space Telescope and a kilonova model. Both show a distinct peak in the region of the spectrum associated with tellurium, with the area shaded in red. The detection of tellurium, which is rarer than platinum on Earth, marks Webb’s first direct look at an individual heavy element from a kilonova.
Though astronomers have theorized neutron star mergers to be the ideal environment to create chemical elements, including some that are essential to life, these explosive events—known as kilonovas—are rare and rapid. Webb’s NIRSpec (Near-Infrared Spectrograph) acquired a spectrum of GRB 230307A’s kilonova, helping scientists secure evidence of the synthesis of heavy elements from neutron star mergers.
With Webb’s extraordinary ability to look further into space than ever before, astronomers expect to find even more kilonovas and acquire further evidence of heavy element creation.
Extended Description and Image Alt Text
Extended Description
Graph titled “GRB 230307A Kilonova Emission Spectrum,” which compares the spectral data of GRB 230307A’s kilonova as observed by the James Webb Space Telescope and a kilonova model, highlighting the detection of tellurium in both. The spectrum is plotted as a line graph of brightness versus wavelength of light (microns). The spectral lines range in wavelength of light along the x-axis, with the first tic labeled as “1.0” and the last tic labeled as “5.0,” and in brightness, with the level of brightness becoming greater moving higher along the y-axis. The Webb spectral line is white and jagged. About a third of the way across the graph, there is a distinct peak between 2.0 and 2.5 microns. After 2.5 microns, the spectral line slopes gradually up to the right. The model spectral line is red and smoother than the Webb data. The model’s spectral line at 1.0 micron begins low (dim) and flat before peaking between 2.0 and 2.5 microns, similar to the Webb data. The area below the model spectral line is shaded red and labeled “Tellurium T E.” The model spectral line then descends after 2.5 microns and follows the general trend of the Webb data.
Image Alt Text
Graph titled “GRB 230307A Kilonova Emission Spectrum,” which compares the spectral data of GRB 230307A’s kilonova as observed by the James Webb Space Telescope and a kilonova model.
About the Object
- R.A. PositionR.A. PositionRight ascension – analogous to longitude – is one component of an object's position.04:03:26.01
- Dec. PositionDec. PositionDeclination – analogous to latitude – is one component of an object's position.-75:22:42.78
- ConstellationConstellationOne of 88 recognized regions of the celestial sphere in which the object appears.Mensa
About the Data
- InstrumentInstrumentThe science instrument used to produce the data.NIRSpec
- Object NameObject NameA name or catalog number that astronomers use to identify an astronomical object.GRB 230307A
- Release DateOctober 25, 2023
- Science ReleaseNASA’s Webb Makes First Detection of Heavy Element from Star Merger
- CreditIllustration: NASA, ESA, CSA, Joseph Olmsted (STScI)
Related Images & Videos
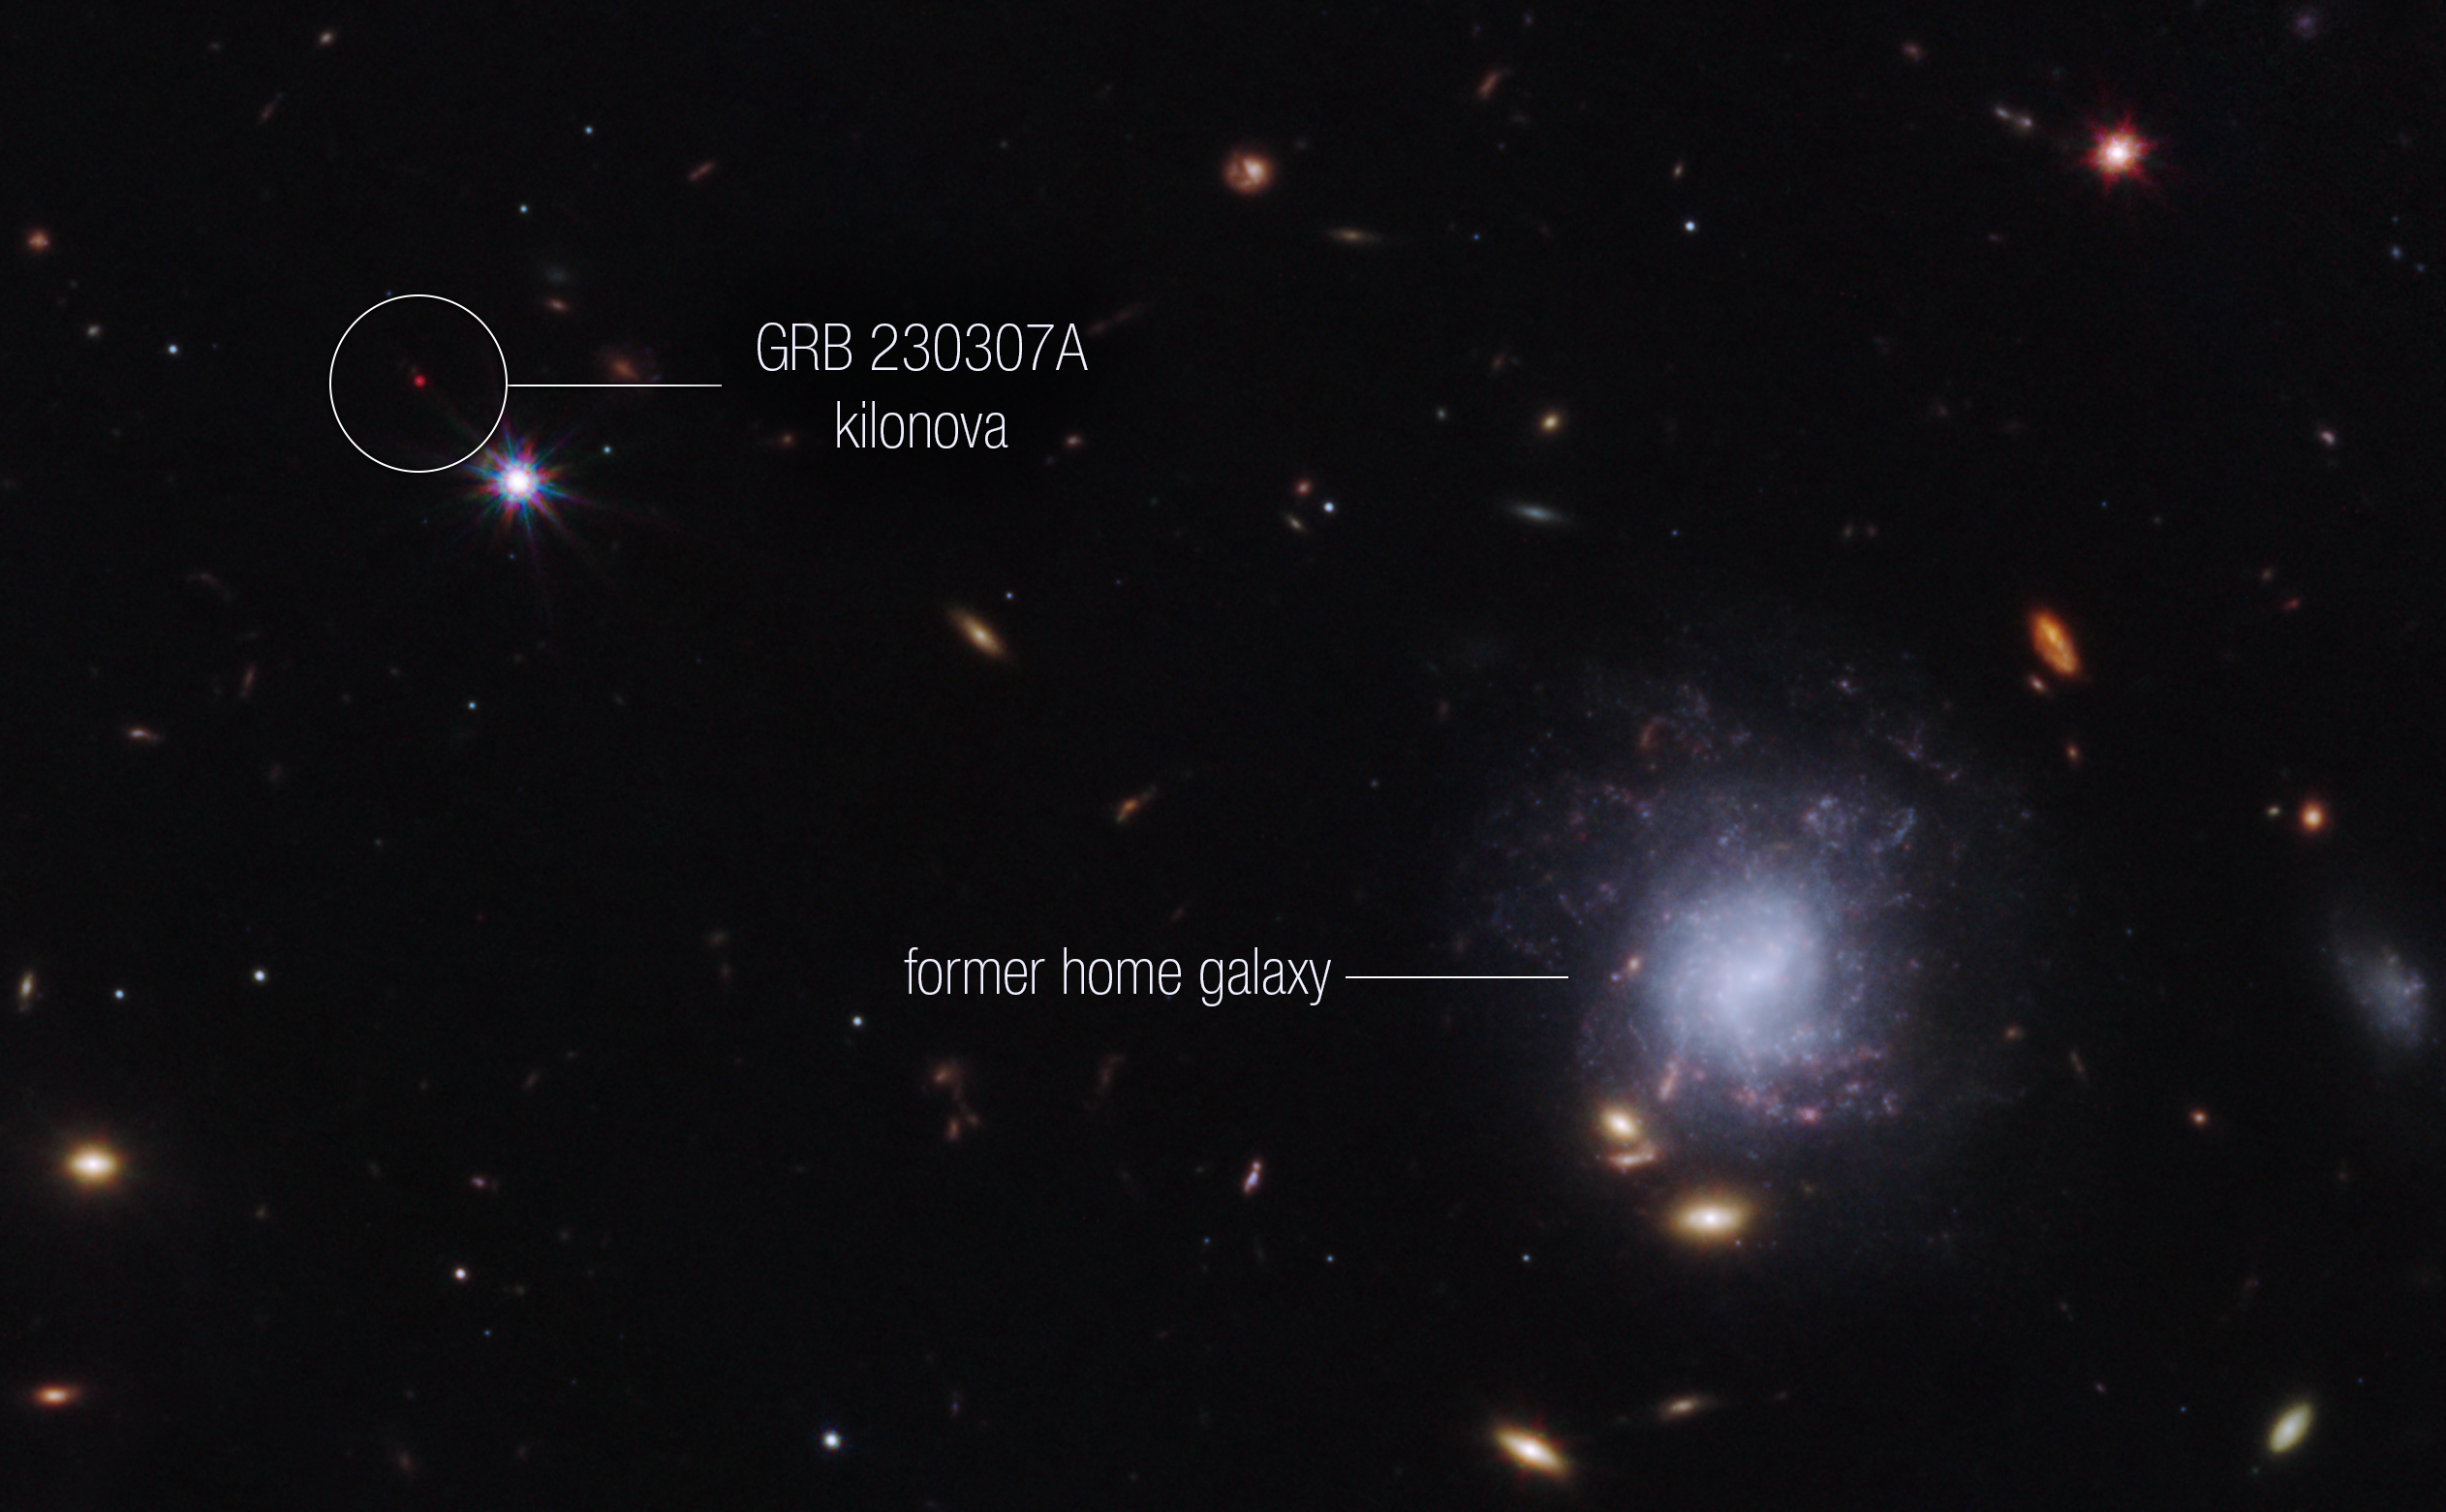
Kilonova and Host Galaxy
A team of scientists has used NASA’s James Webb Space Telescope to observe an exceptionally bright gamma-ray burst, GRB 230307A, and its associated kilonova. Kilonovas—an explosion produced by a neutron star merging with either a black hole or with another neutron star—are...
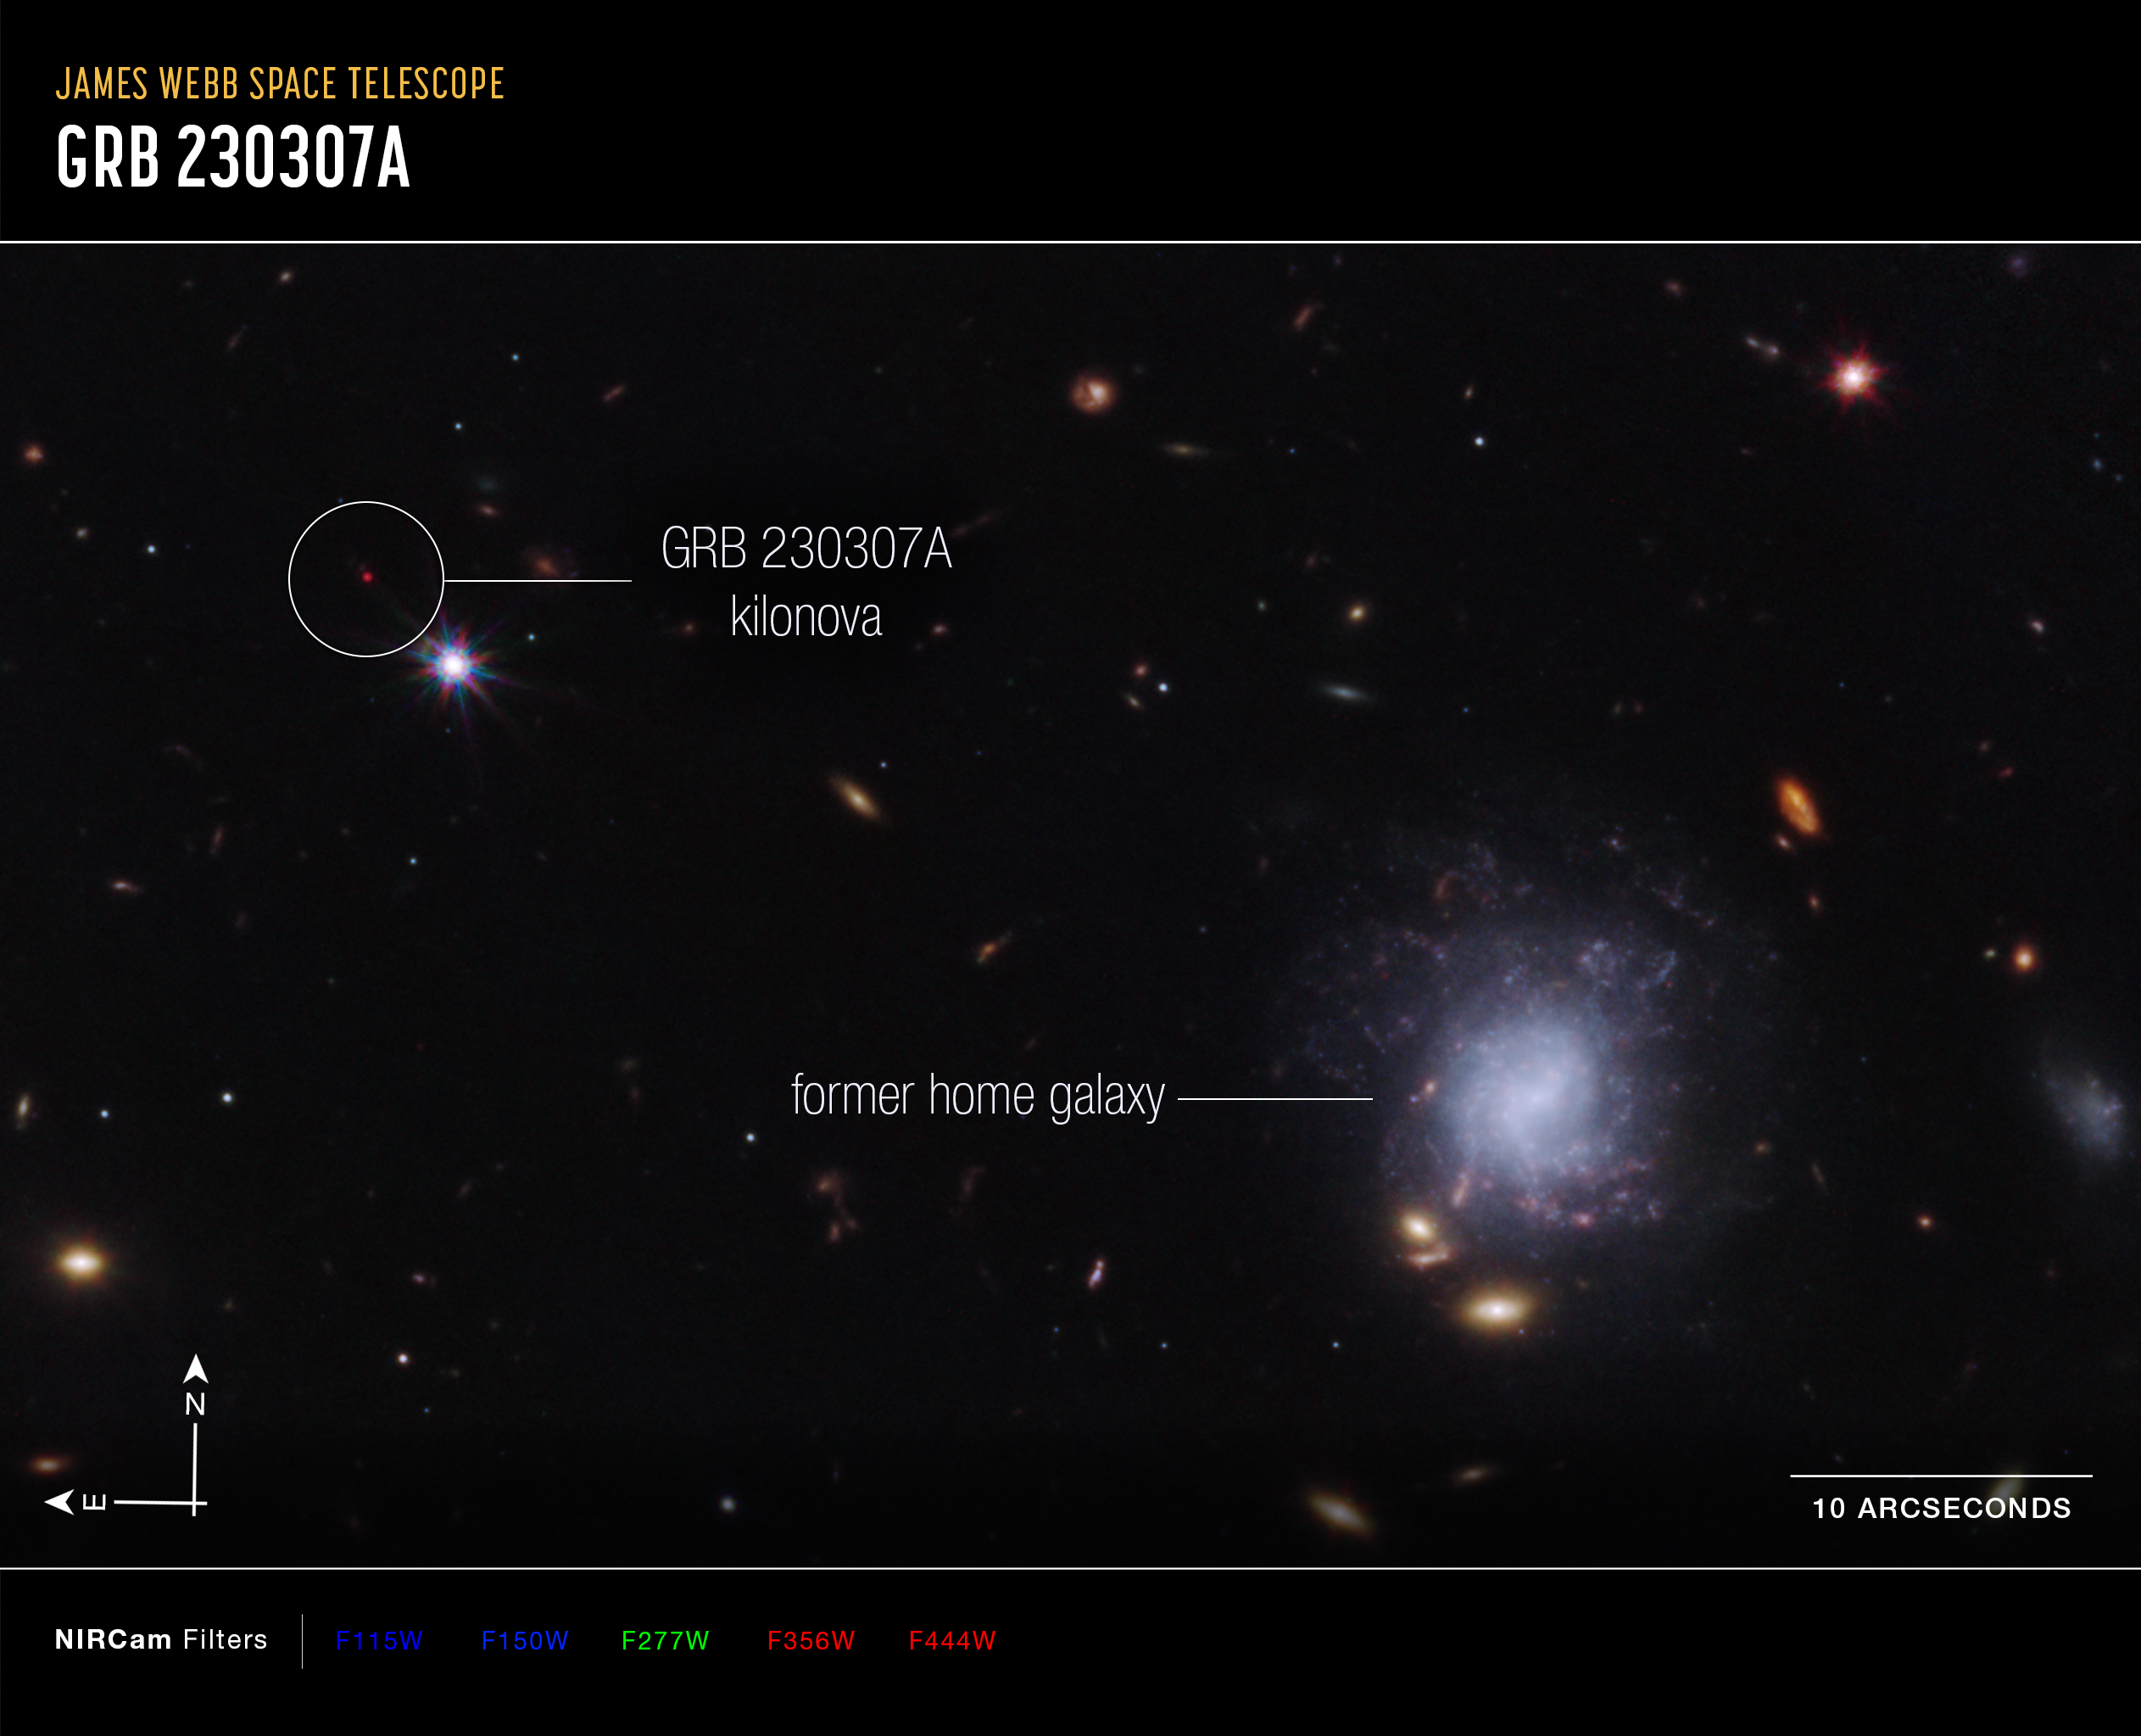
Kilonova and Host Galaxy (Compass Image)
An image of the GRB 230307A kilonova and the former home galaxy of the neutron stars captured by Webb's NIRCam (Near-Infrared Camera), with compass arrows, a scale bar, and color key for reference. The north and east compass arrows show the orientation of the image on the sky....
Share
Details
Laura Betz
NASA’s Goddard Space Flight Center
Greenbelt, Maryland
laura.e.betz@nasa.gov
NASA, ESA, CSA, Joseph Olmsted (STScI)


