


1 min read
Milky Way Center (MeerKAT and Webb), Labeled
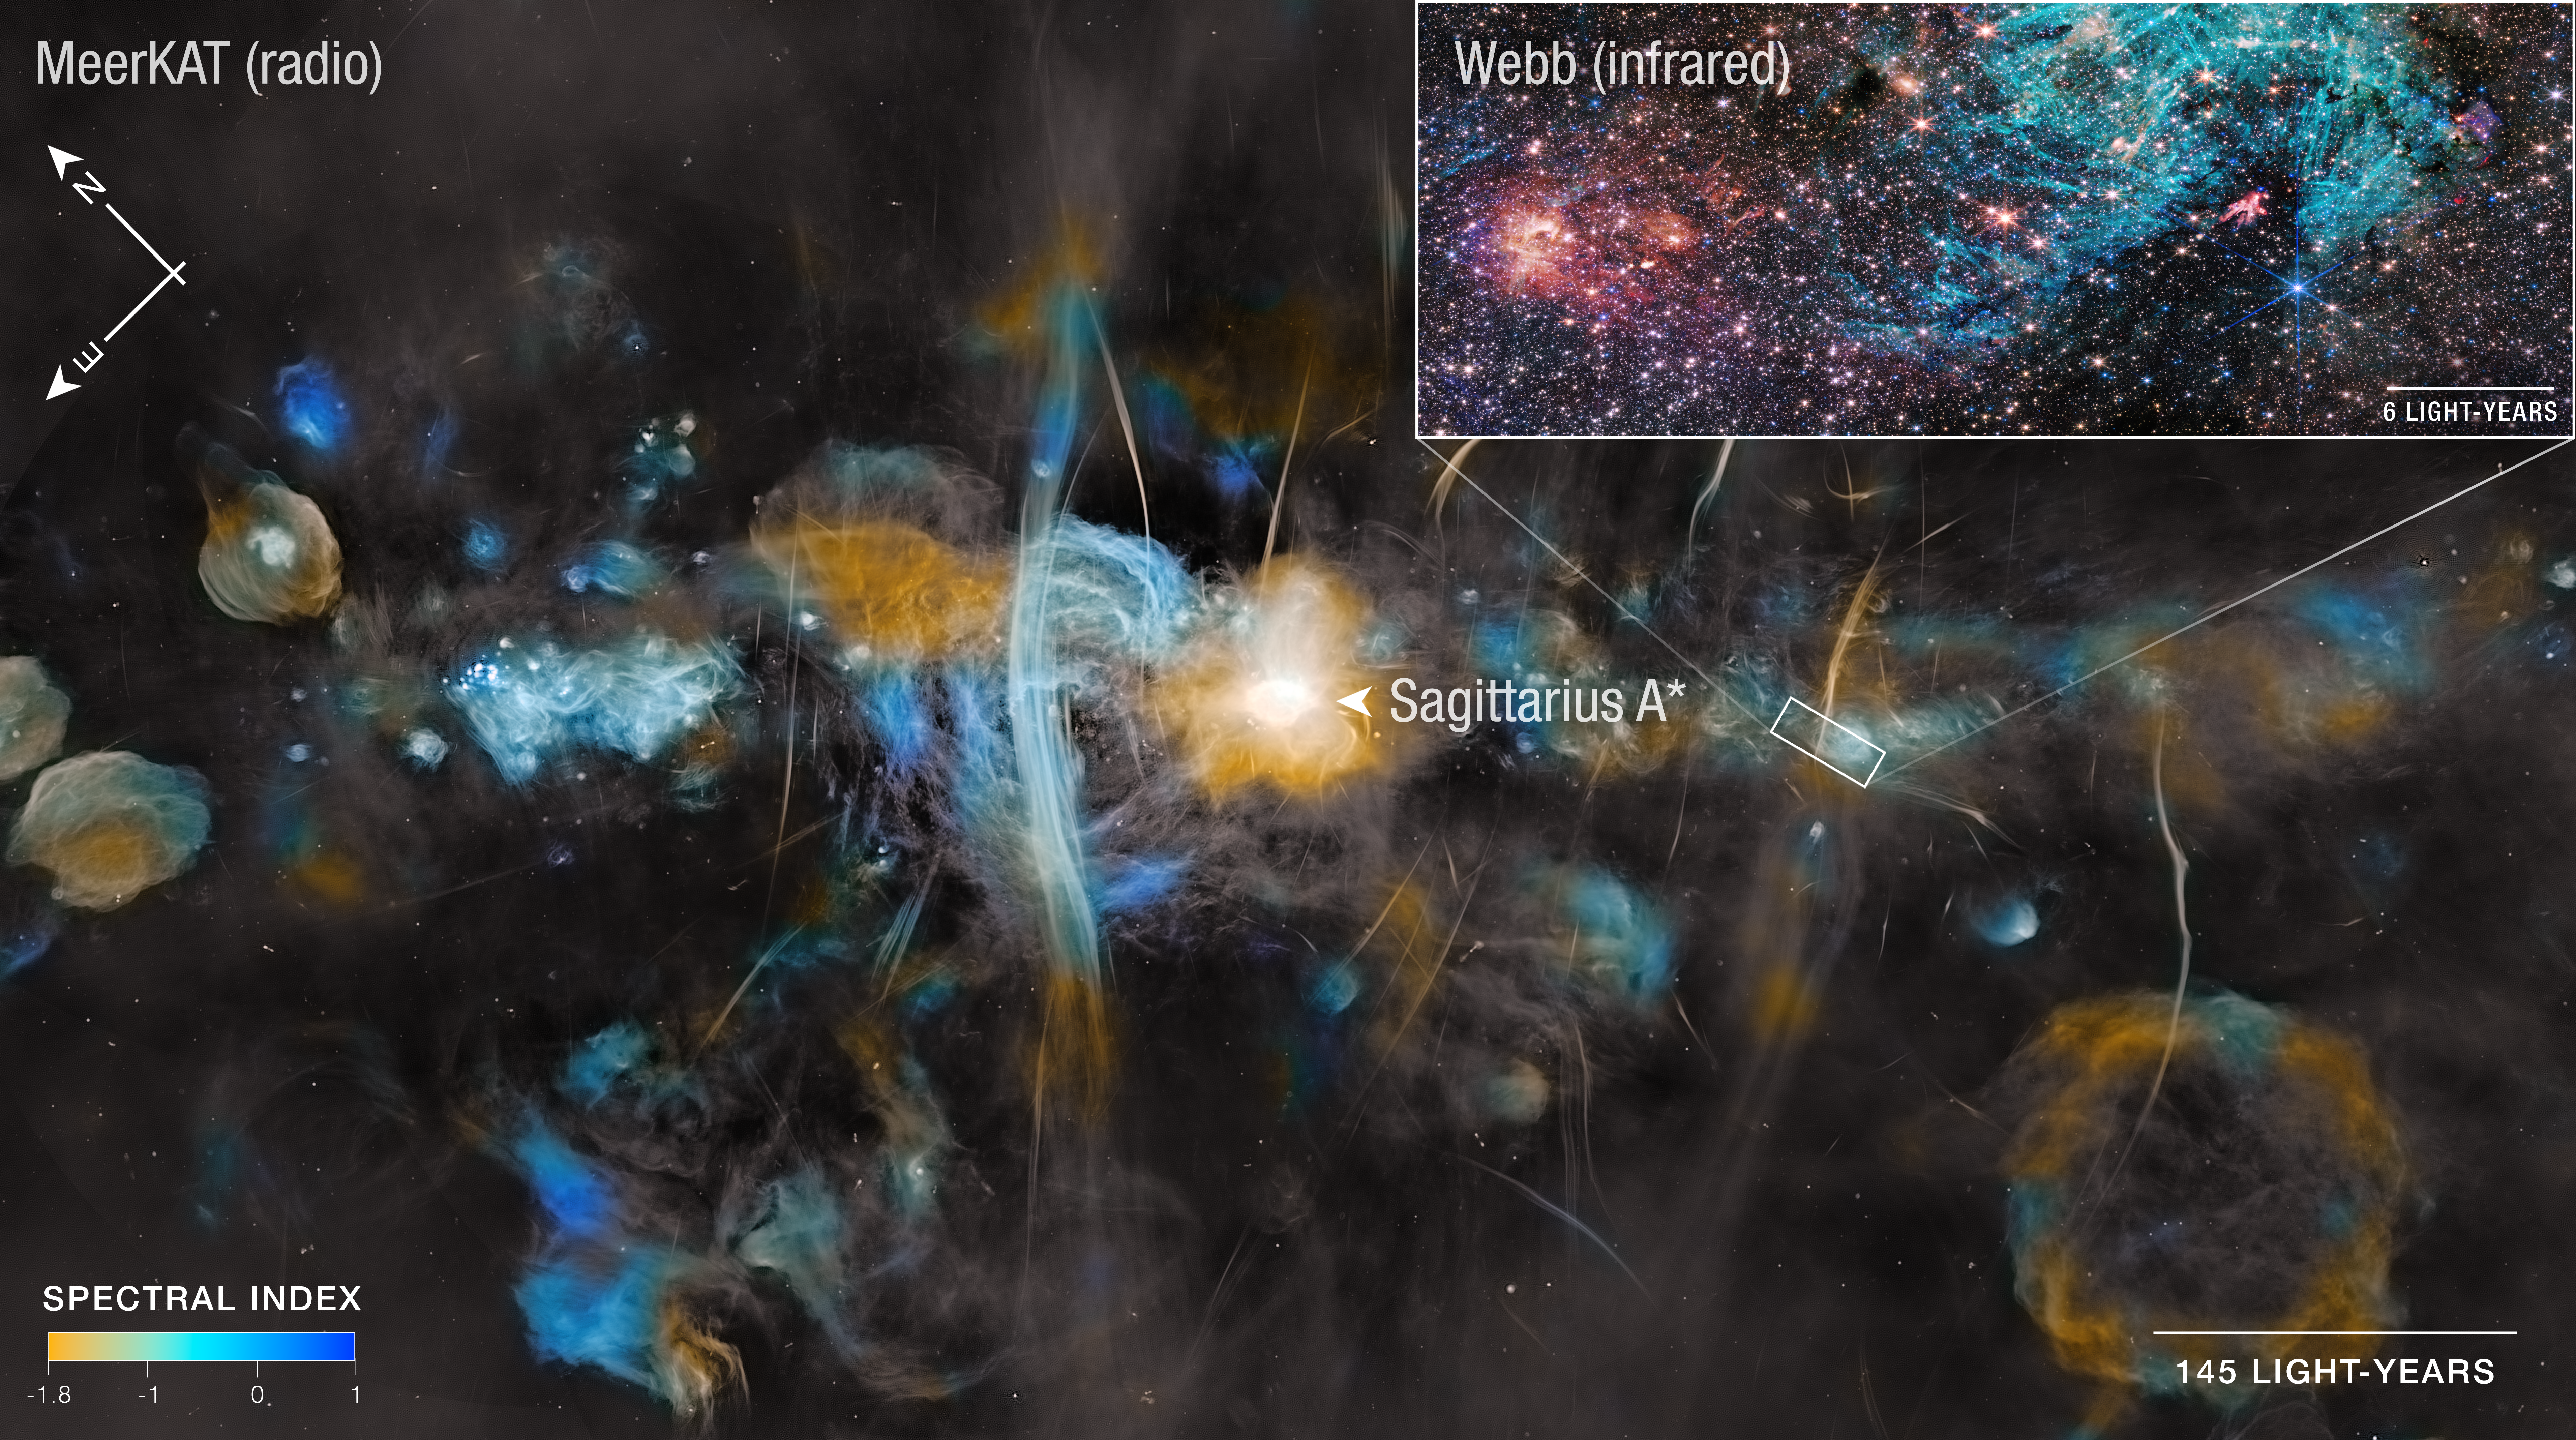
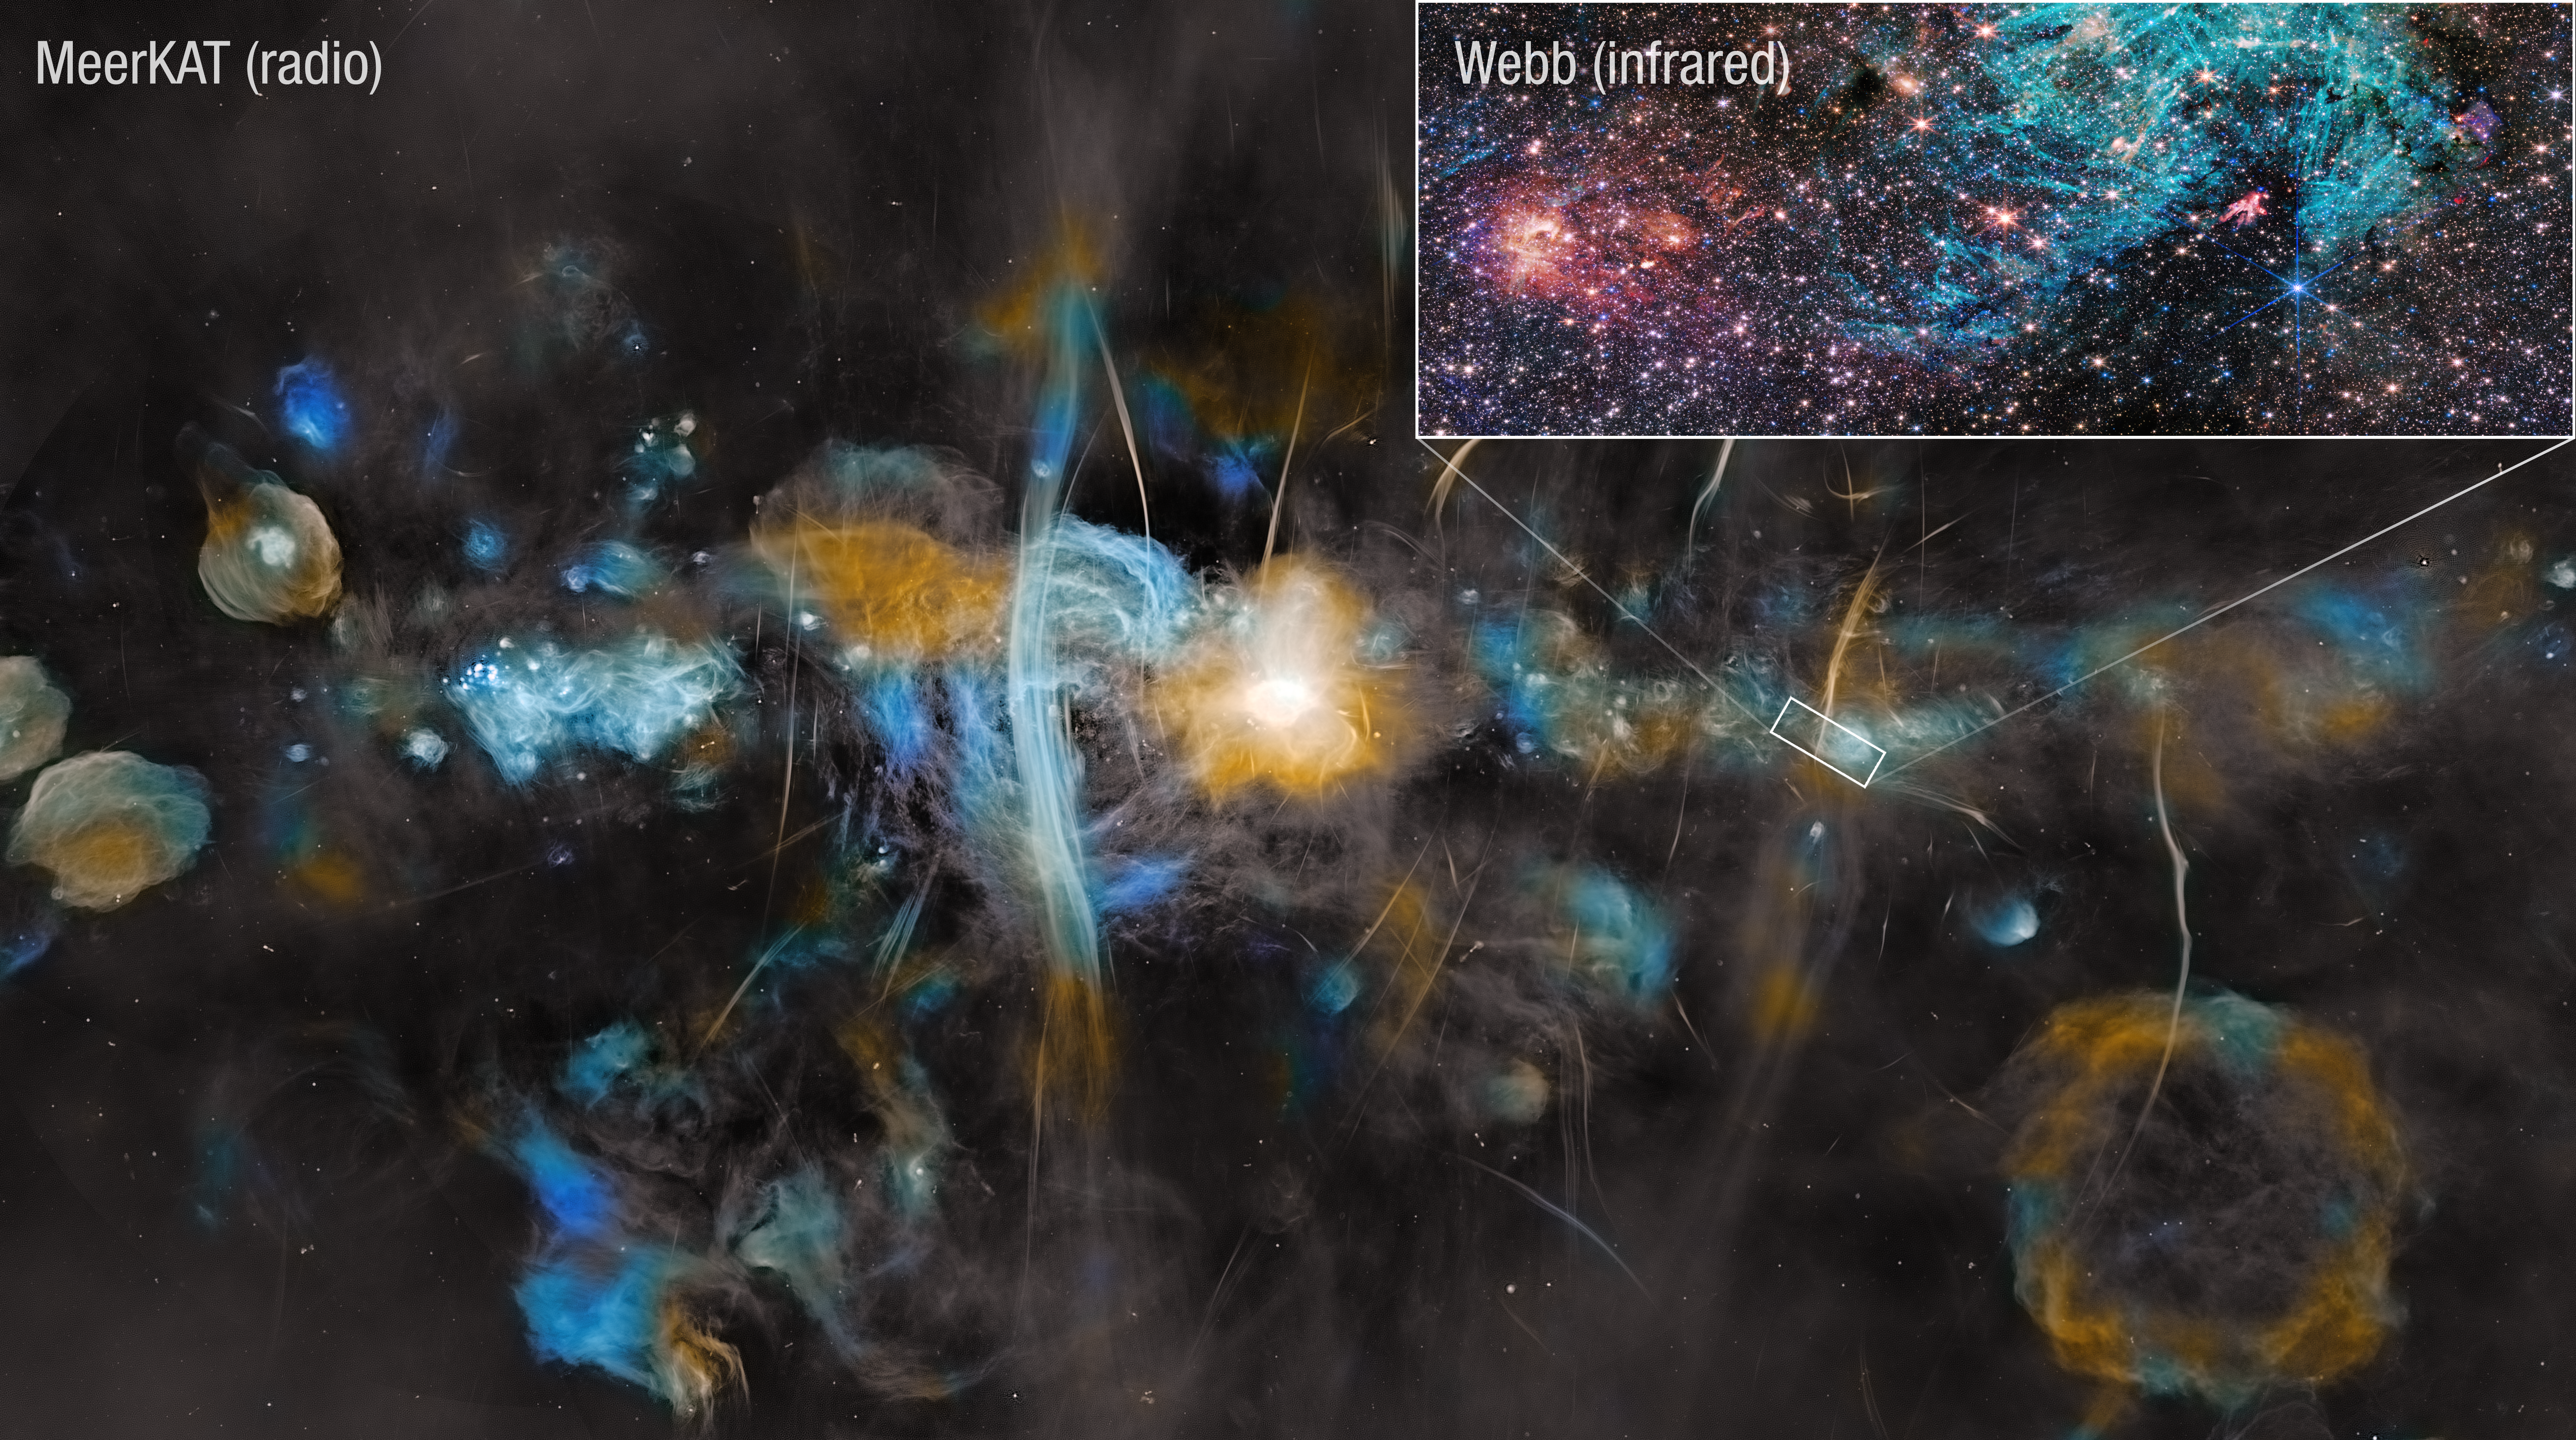
Labeling, compass arrows, and scale bars provide context for these MeerKAT and James Webb Space Telescope images. The star-forming region Sagittarius C, captured by the James Webb Space Telescope, is about 200 light-years from the Milky Way’s central supermassive black hole, Sagittarius A*.
Huge vertical filamentary structures in the MeerKAT radio data echo those Webb captured on a smaller scale, in infrared, in a blue-green hydrogen cloud. Astronomers think the strong magnetic fields in the heart of the galaxy are shaping the filaments.
The spectral index at the lower left shows how color was assigned to the radio data to create the image. On the negative end, there is non-thermal emission, stimulated by electrons spiraling around magnetic field lines. On the positive side, thermal emission is coming from hot, ionized plasma.
For Webb, color is assigned by shifting the infrared spectrum to visible light colors. The shortest infrared wavelengths are bluer, and the longer wavelengths appear more red.
About the Object
- R.A. PositionR.A. PositionRight ascension – analogous to longitude – is one component of an object's position.17:44:40.30
- Dec. PositionDec. PositionDeclination – analogous to latitude – is one component of an object's position.-29:28:14.93
- ConstellationConstellationOne of 88 recognized regions of the celestial sphere in which the object appears.Sagittarius
- DistanceDistanceThe physical distance from Earth to the astronomical object. Distances within our solar system are usually measured in Astronomical Units (AU). Distances between stars are usually measured in light-years. Interstellar distances can also be measured in parsecs.26,000 lightyears
- DimensionsDimensionsThe physical size of the object or the apparent angle it subtends on the sky.This image is about 2.25 degrees across (1,000 light-years).
About the Data
- Data DescriptionData DescriptionProposal: A description of the observations, their scientific justification, and the links to the data available in the science archive.
Science Team: The astronomers who planned the observations and analyzed the data. "PI" refers to the Principal Investigator.This image was created with Webb data from proposal: 4147 (S. Crowe).
Image Processing: Alyssa Pagan (STScI)
The 1.28 GHz MeerKat galactic center mosaic was created by Heywood et al. (2022)
- InstrumentInstrumentThe science instrument used to produce the data.Webb>NIRCam SARAO>MeerKAT
- Exposure DatesExposure DatesThe date(s) that the telescope made its observations and the total exposure time.Webb> 22 Sept 2023
- FiltersFiltersThe camera filters that were used in the science observations.NIRCam> F162M, F360M, F405N, F470N MeerKAT> 1.28 GHz
- Object NameObject NameA name or catalog number that astronomers use to identify an astronomical object.Sagittarius A* (A-star) and Sagittarius C
- Object DescriptionObject DescriptionThe type of astronomical object.Galactic center
- Release DateApril 2, 2025
- Science ReleaseNASA Webb Explores Effect of Strong Magnetic Fields on Star Formation
- CreditImage: NASA, ESA, CSA, STScI, SARAO, Samuel Crowe (UVA), John Bally (CU), Ruben Fedriani (IAA-CSIC), Ian Heywood (Oxford)
The Webb image is a composite of separate exposures acquired by the NIRCam instrument. Several filters were used to sample specific wavelength ranges. The color results from assigning different hues (colors) to each monochromatic (grayscale) image associated with an individual filter. In this case, the assigned colors are: Blue: F162M, Cyan: F405N, Orange: F360M, Red: F470N The MeerKAT image uses the spectral index to colorize the radio continuum image centered at 1.28 GHz.
Related Images & Videos
Milky Way Center (MeerKAT and Webb)
An image of the Milky Way captured by the MeerKAT radio telescope array puts the James Webb Space Telescope’s image of the Sagittarius C region in context. The MeerKAT image spans 1,000 light-years, while the Webb image covers 44 light-years. At the center of the MeerKAT image...
Share
Details
Laura Betz
NASA’s Goddard Space Flight Center
Greenbelt, Maryland
laura.e.betz@nasa.gov
NASA, ESA, CSA, STScI, SARAO, Samuel Crowe (UVA), John Bally (CU), Ruben Fedriani (IAA-CSIC), Ian Heywood (Oxford)


