


1 min read
Phoenix Cluster (Hubble, Chandra, VLA Annotated)
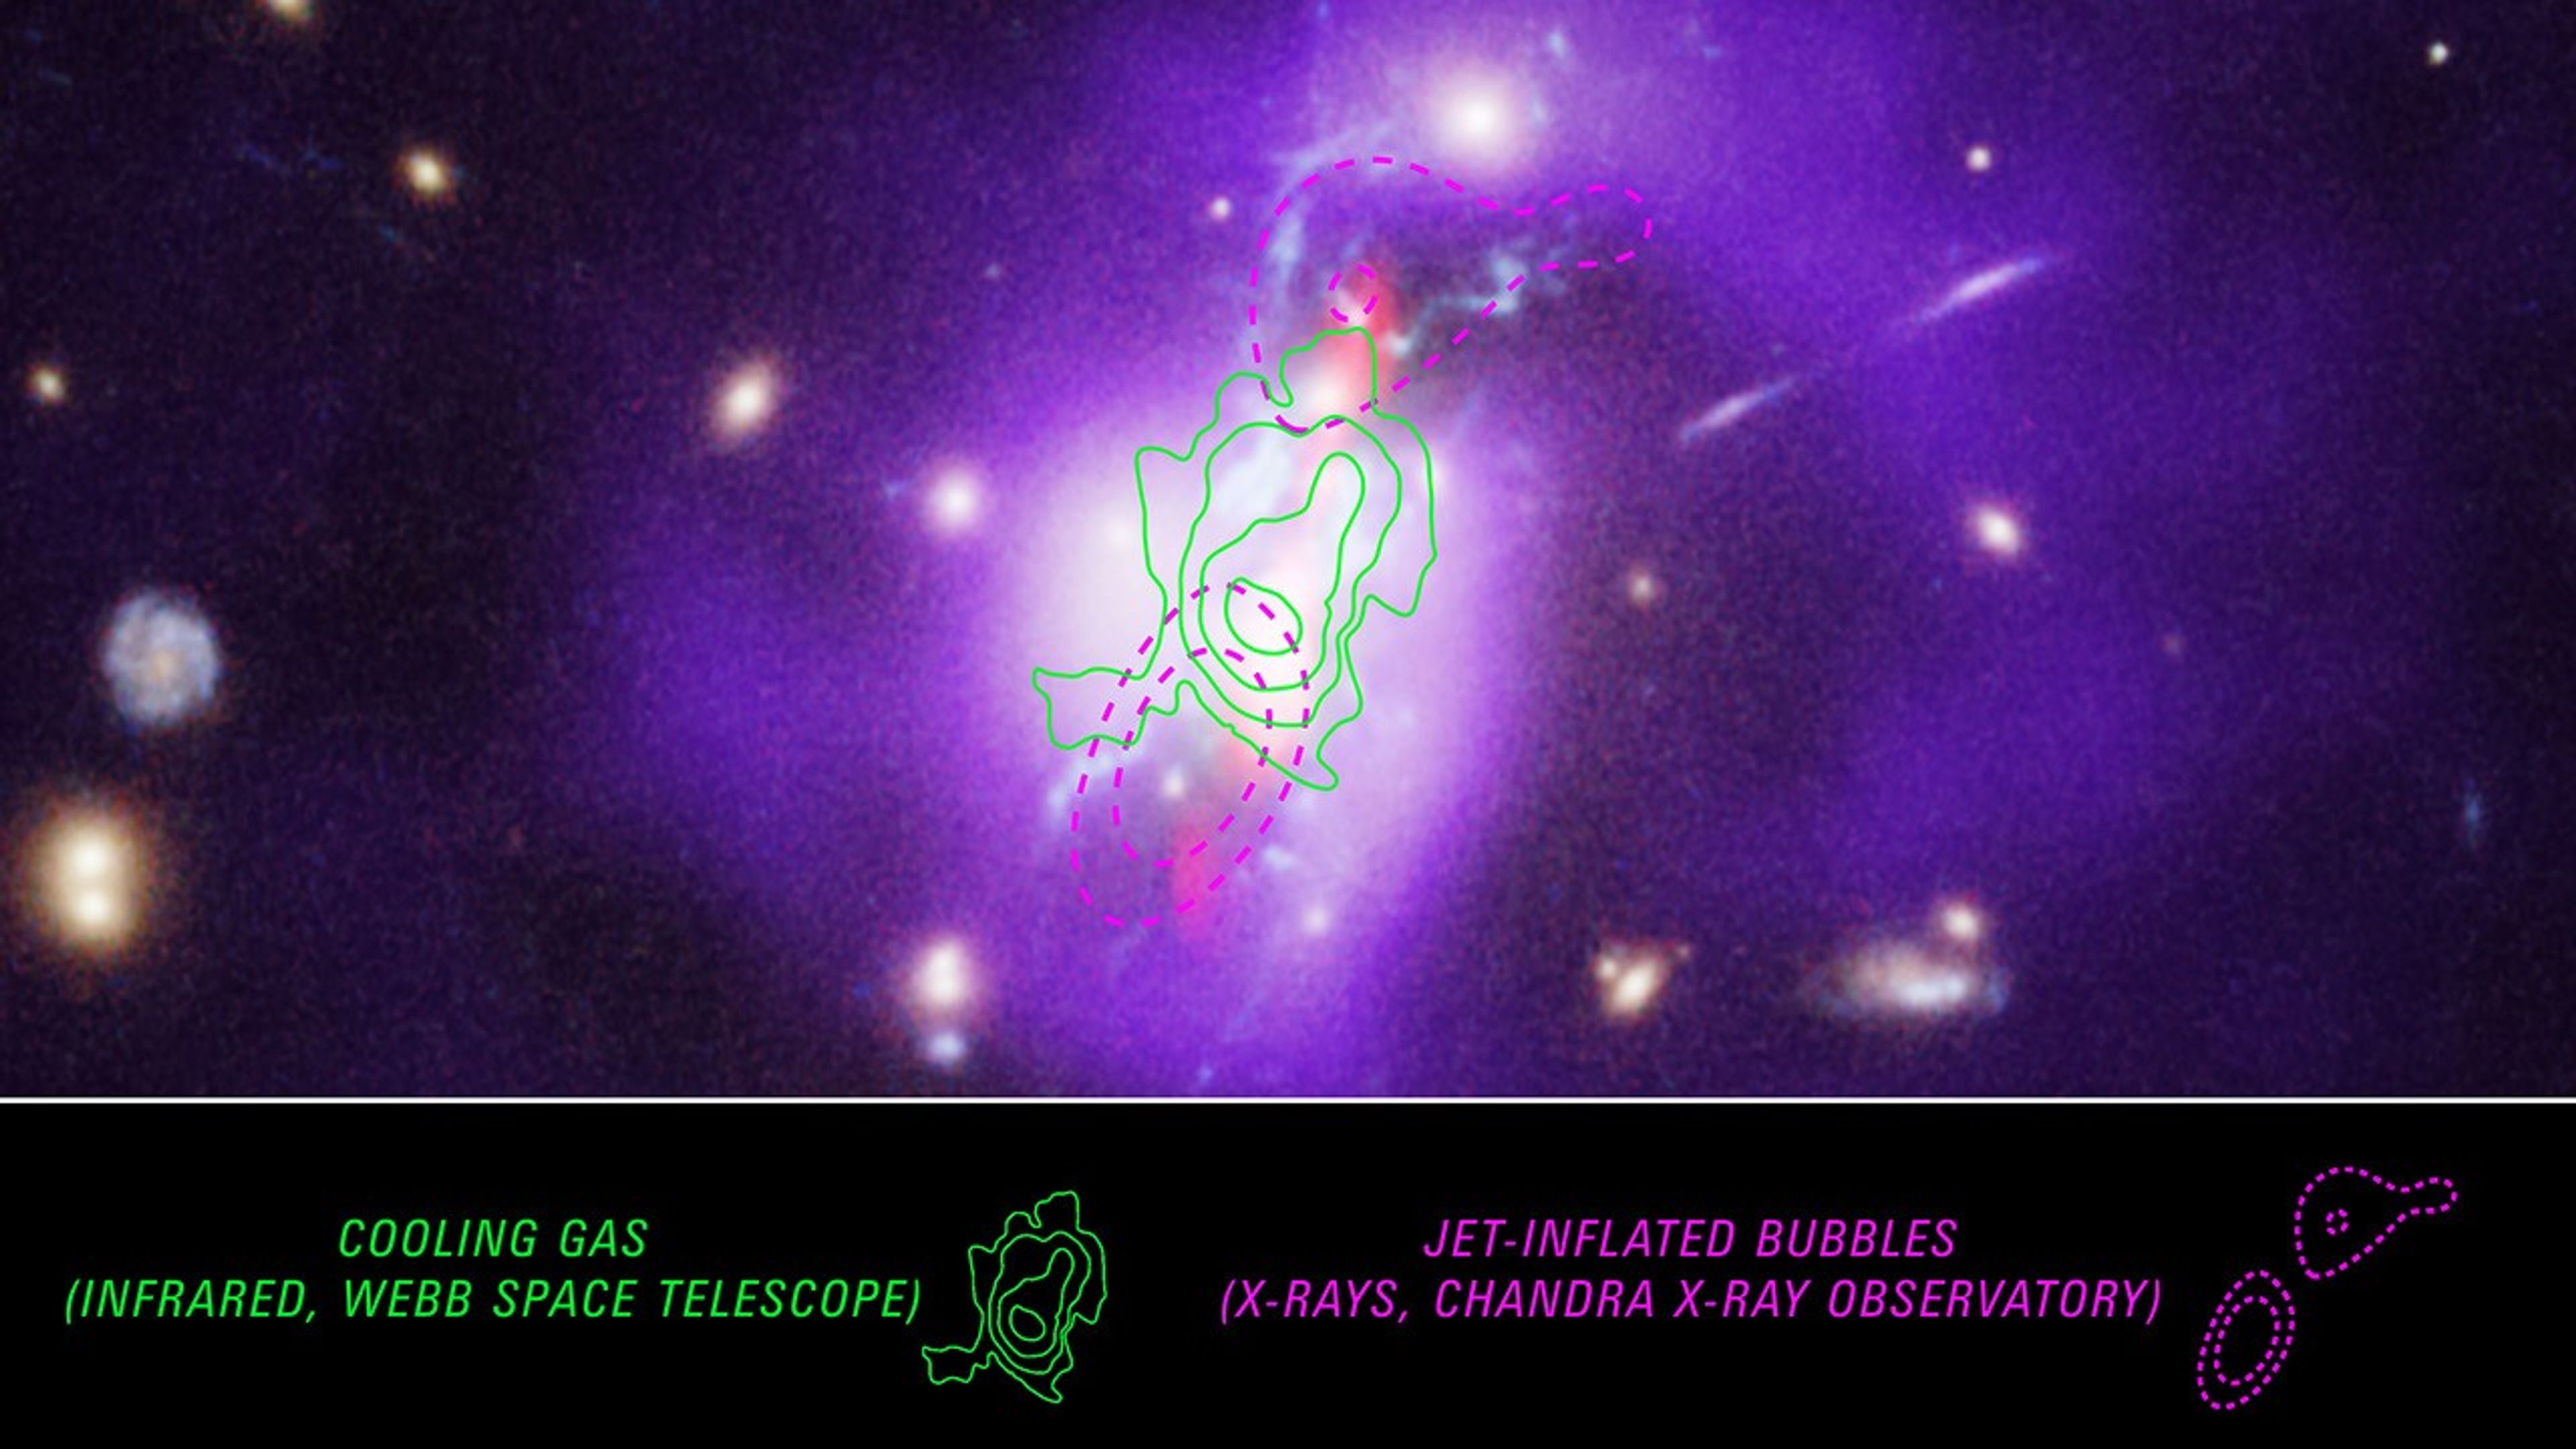
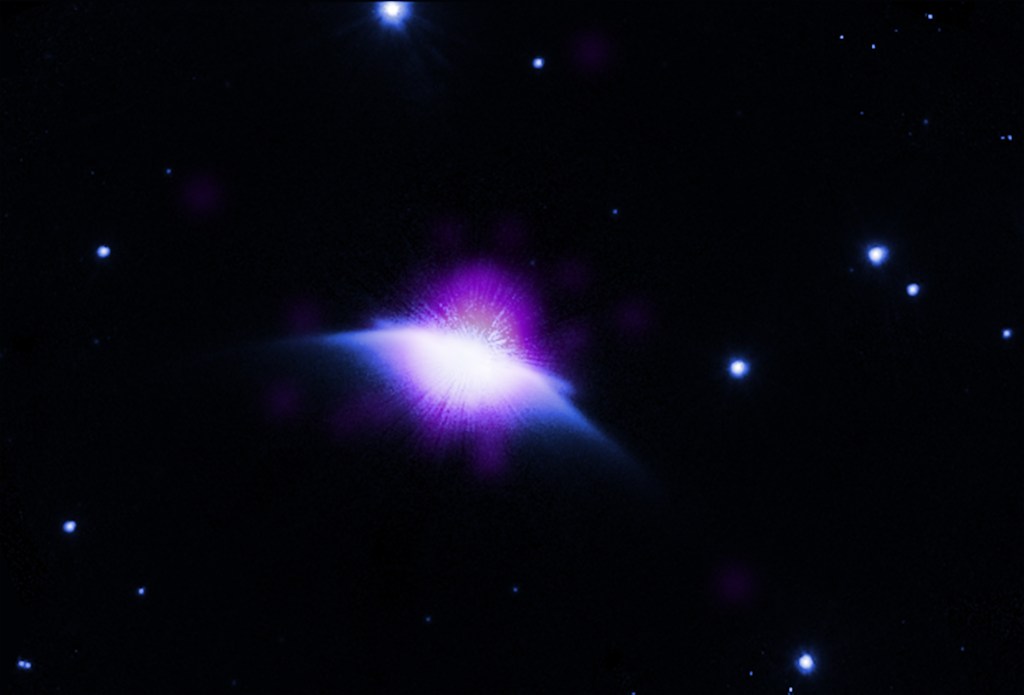
New observations from NASA’s James Webb Space Telescope trace the cooling gas that enables the Phoenix cluster to form stars at such a high rate. Previous studies of the Phoenix cluster using the Hubble Space Telescope, Chandra X-ray Observatory, and the Very Large Array radio telescope showed how the supermassive black hole at the center was feeding an unusually high rate of star formation. This is not typical – in other observed galaxy clusters, a supermassive black hole usually sends out energetic particles and radiation that prevents gas from cooling enough to form stars.
Chandra detects the hottest gas, which is seen in purple in this image. Jets, represented in red, are sent out from the center of the cluster, inflating cavities or bubbles in the hot gas, outlined here in purple dashes. Filaments of cooler gas where stars are forming, observed by Hubble, appear in blue.
Until Webb’s powerful spectroscopic instruments that probe the infrared, the cooling gas remained undetected. In this image, contours tracing the gas, from spectroscopic data collected by Webb, are overlaid. This intermediary warm gas was found between the cavities tracing the very hot gas, a searing 18 million degrees Fahrenheit, and the already cooled gas around 18,000 degrees Fahrenheit.
- Release DateFebruary 13, 2025
- Science ReleaseWebb Maps Full Picture of How Phoenix Galaxy Cluster Forms Stars
- CreditImage: NASA, CXC, NRAO, ESA, Michael McDonald (MIT), Michael Reefe (MIT); Illustration: Joseph Olmsted (STScI)
Related Images & Videos
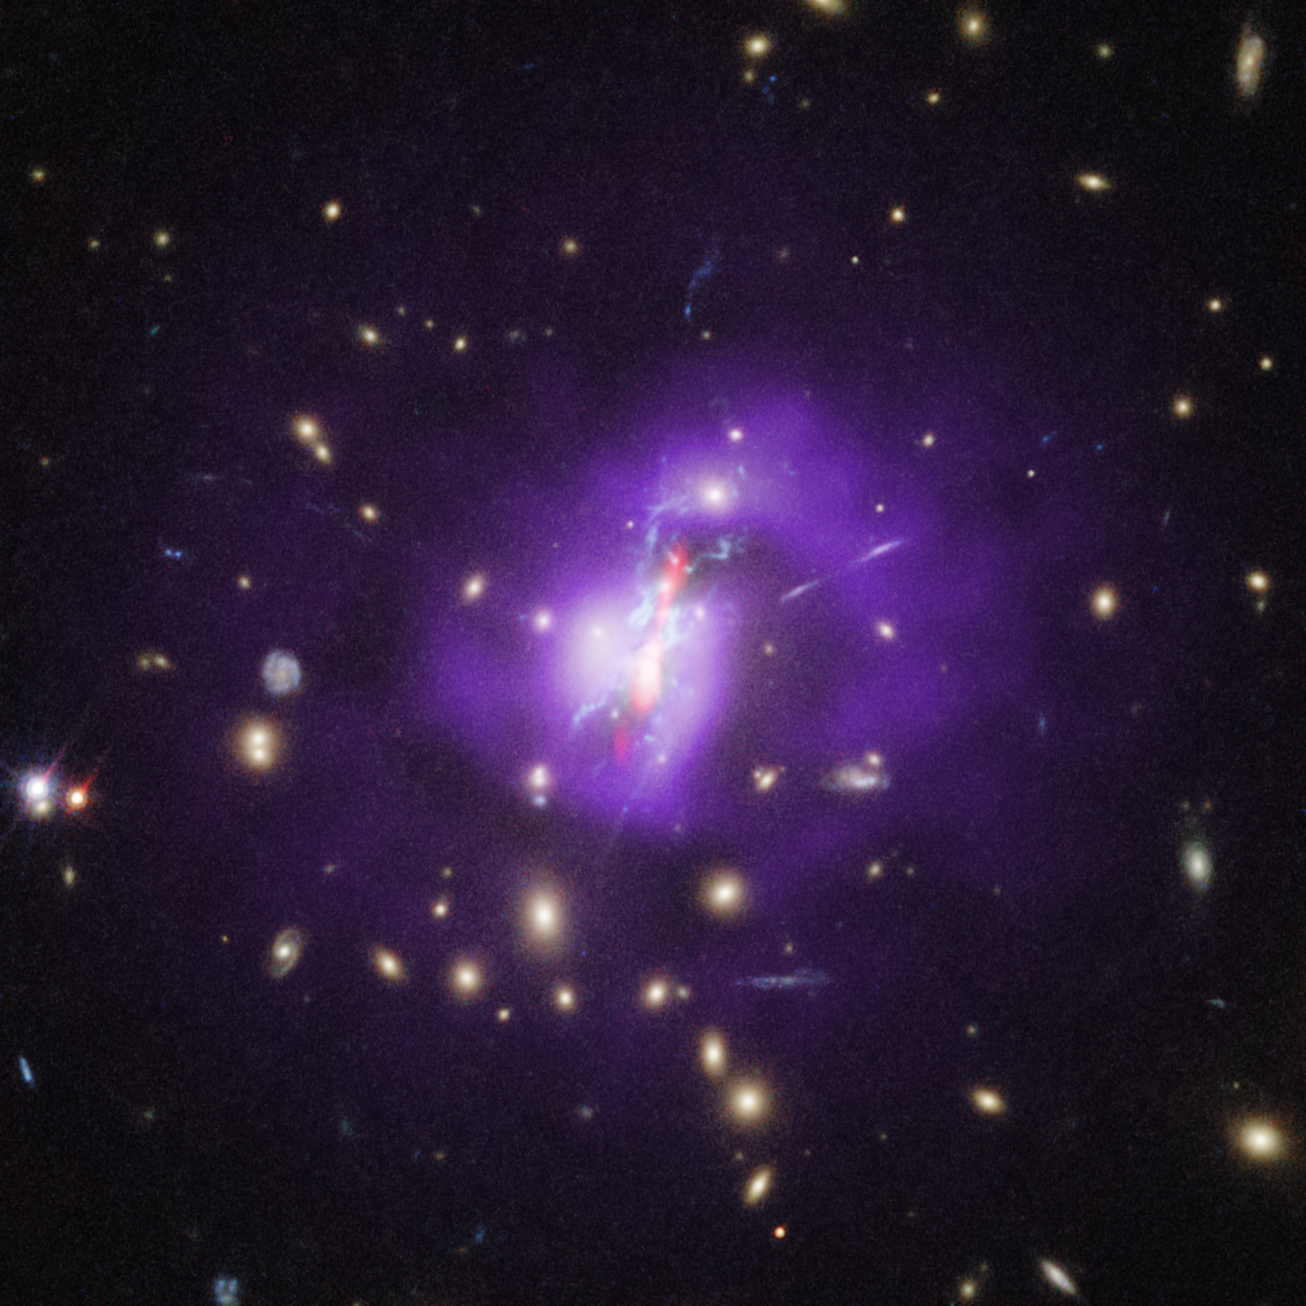
Phoenix Cluster (Hubble, Chandra, VLA)
This image of the Phoenix cluster combines data from NASA’s Hubble Space Telescope, Chandra X-ray Observatory, and the Very Large Array (VLA) radio telescope and shows how the supermassive black hole at the center promotes large amounts of star formation, instead of hinders it....
Share
Details
Laura Betz
NASA’s Goddard Space Flight Center
Greenbelt, Maryland
laura.e.betz@nasa.gov
NASA, CXC, NRAO, ESA, Michael McDonald (MIT), Michael Reefe (MIT)
Joseph Olmsted (STScI)


