


1 min read
Set of Extremely Distant Galaxies (NIRSpec MSA Emission Spectra)
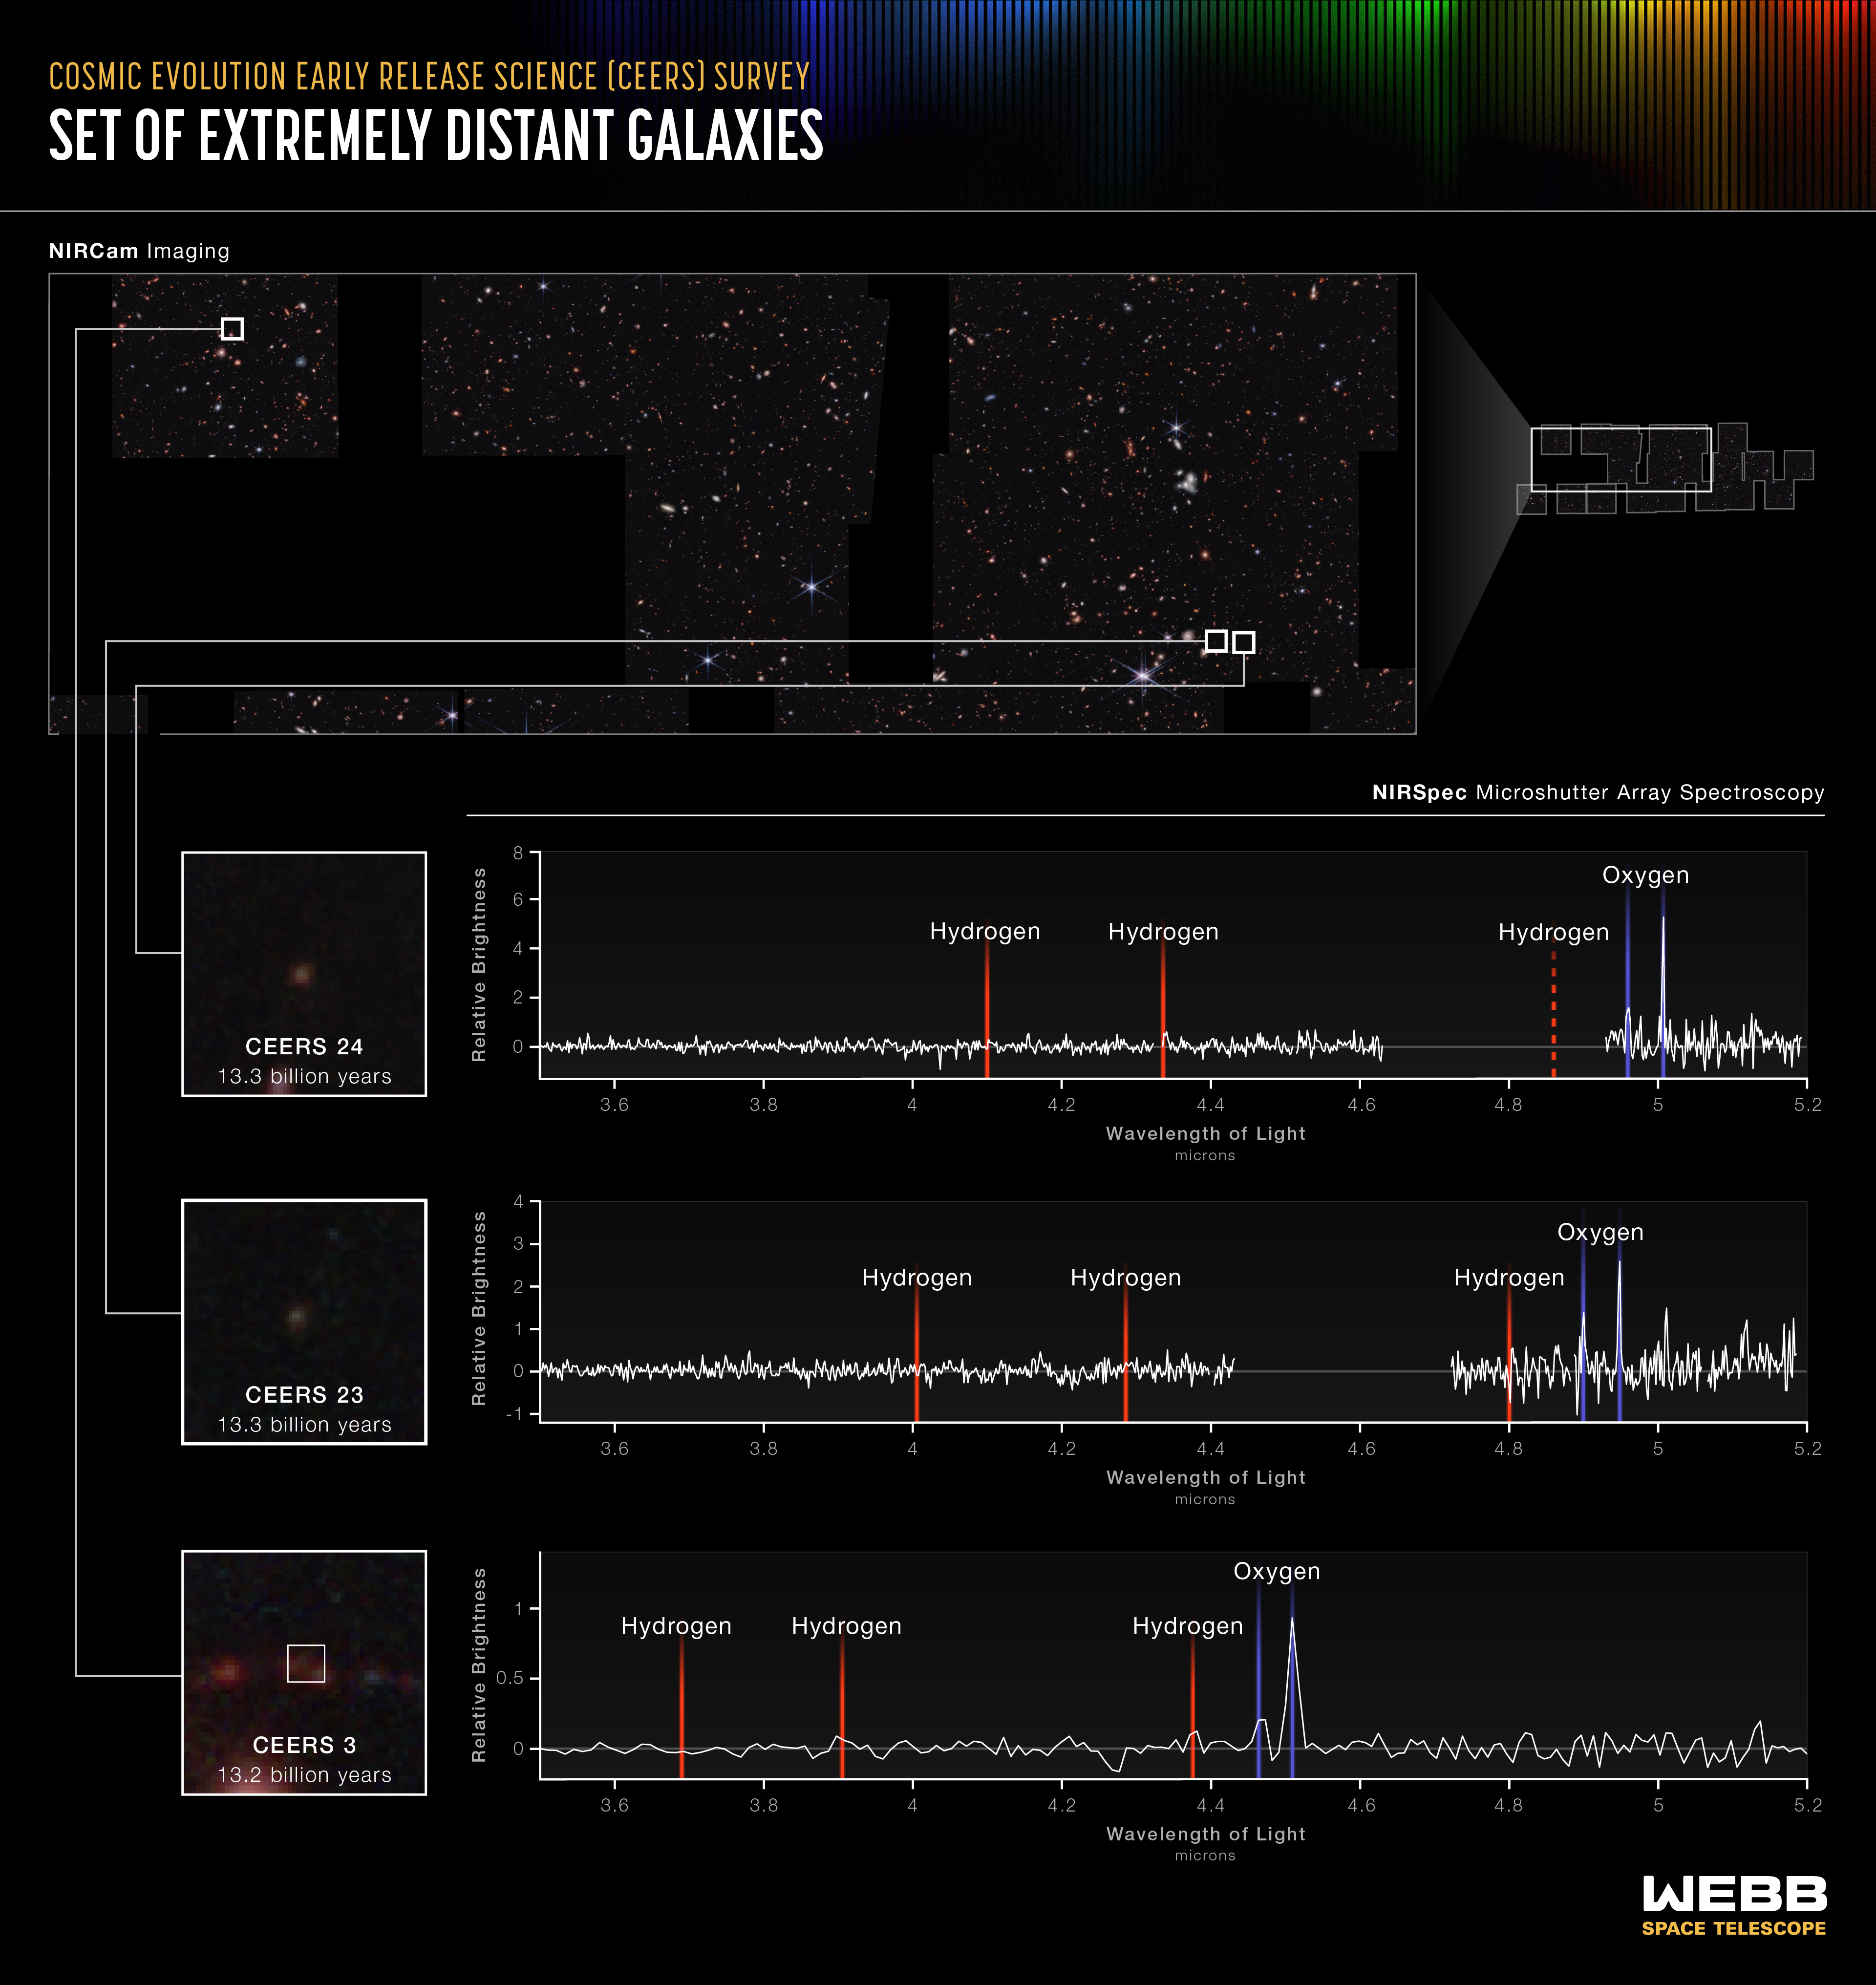
A team investigating data from Webb’s Cosmic Evolution Early Release Science (CEERS) Survey has already identified seven galaxies that existed when the universe was only 540 to 660 million years old. Some of the evidence is displayed above: Three lines appear in the same order – one hydrogen line followed by two ionized oxygen lines in each spectrum. Where this pattern falls reveals the redshift of each galaxy, showing researchers how long ago their light was emitted. CEERS 24 and CEERS 23 emitted their light 13.3 billion years ago, and CEERS 3 emitted its light 13.2 billion years ago.
Webb was not only the first to deliver images of these galaxies, but also the precise, highly detailed data known as spectra that reveal their compositions. “Some of the galaxies weren’t detected in previous deep fields, like the pioneering images from the Hubble Space Telescope,” explained Seiji Fujimoto, the CEERS researcher who led these discoveries and is based at the University of Texas at Austin. “This set, along with other distant galaxies we identify in the future, might change our understanding of star formation and galaxy evolution throughout cosmic history.”
Researchers have long expected to make these discoveries, but until Webb began its operations, they didn’t have sensitive enough space-based infrared instruments to capture extremely distant galaxies, which appear as miniature red dots in Webb’s images. “It’s very exciting to finally begin detailing the precise distances of these galaxies with Webb,” said Steven Finkelstein of the University of Texas at Austin, who leads the CEERS program.
What’s next for the team? “We’ll start characterizing these galaxies in detail, which are much fainter than any we’ve detected before,” Fujimoto added. “There is a lot more research to be done with these data and we are almost guaranteed to run into more surprises.”
Extended Description and Image Alt Text
Extended Description
A graphic titled “Cosmic Evolution Early Release Science (CEERS) Survey, Set of Extremely Distant Galaxies.” The graphic shows the redshift of three distant galaxies.
Reference Image
In the top row, at the far right is an outline made up of a patchwork of squares labeled NIRCam imaging. A large horizontal pull out of a region within CEERS appears over most of this row. It contains galaxies of different colors, shapes, and sizes.
Inset Images
Three white boxes appear over tiny galaxies and white lines link them to larger images at bottom left. The first white box is toward the top right. The second and third are next to one another toward the bottom right. In the inset images are blurry red dots at the center. The top one reads CEERS 24, 13.3 billion years, the second reads CEERS 23, 13.3 billion years. The bottom image reads CEERS 3, 13.2 billion years.
Graphs
Along the bottom of the graphic are three line graphs. They are evenly lined up with the inset galaxy graphics. These are labeled NIRSpec Microshutter Array Spectroscopy.
Graph Axes
Each spectrum is plotted as a line graph. The graphs show relative brightness on the y-axis. Tick marks for CEERS 24 are 0, 2, 4, 6, 8. Tick marks for CEERS 23 are -1, 0, 1, 2, 3, 4. Tick marks for CEERS 3 are 0, 0.5, 1. Wavelength in microns is shown on the x-axis, which has labels on all three graphs for 3.6, 3.8, 4, 4.2, 4.4, 4.6, 4.8, 5, and 5.2 microns.
Graph Data
All three graphs show jagged lines, plotting the brightness of the galaxy at each wavelength. The overall shape of the line is flat with a few prominent spike-like peaks. Some peaks are taller than others.
Shaded areas of color mark the appearance of hydrogen and oxygen on each galaxy’s spectrum. Hydrogen is highlighted in red and oxygen is highlighted in blue.
Light emitted from CEERS 24, 13.3 billion years ago: Two hydrogen emission lines are located between 4 and 4.2-microns, and between 4.2 and 4.4 microns. There is a gap in the data between just after 4.6 microns and around 4.9 microns. A vertical dashed line representing where hydrogen is projected to be appears just after 4.8 microns. Two oxygen lines are located where the data pick up, just before and just after the 5-micron tick mark.
Light emitted from CEERS 23, 13.3 billion years ago: Three hydrogen emission lines are located immediately after 4 microns, between 4.2 and 4.4 microns, and at 4.8 microns. Two oxygen lines are located after that, between the 4.8 and the 5-micron tick mark. There is a gap in the data just after 4.4 microns and around 4.7 microns.
Light emitted from CEERS 3, 13.2 billion years ago: Three hydrogen emission lines are located between 3.6 and 3.8 microns, between 3.8 and 4 microns, and just before 4.4 microns. Two oxygen lines are located after that, both between the 4.4 and 4.6 tick marks.
Image Alt Text
A graphic titled “Cosmic Evolution Early Release Science (CEERS) Survey, Set of Extremely Distant Galaxies.” The graphic, showing three spectra, plot the redshift of three distant galaxies.
- Release DateJuly 6, 2023
- Science ReleaseWebb Detects Most Distant Active Supermassive Black Hole to Date
- CreditImage: NASA, ESA, CSA, Leah Hustak (STScI); Science: Steve Finkelstein (UT Austin), Seiji Fujimoto (UT Austin), Pablo Arrabal Haro (NSF's NOIRLab)
Related Images & Videos
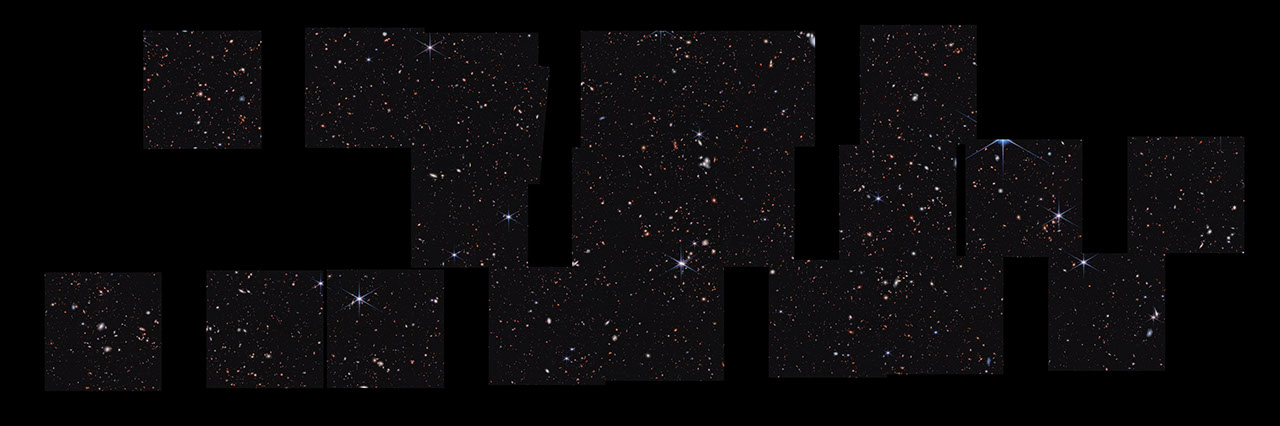
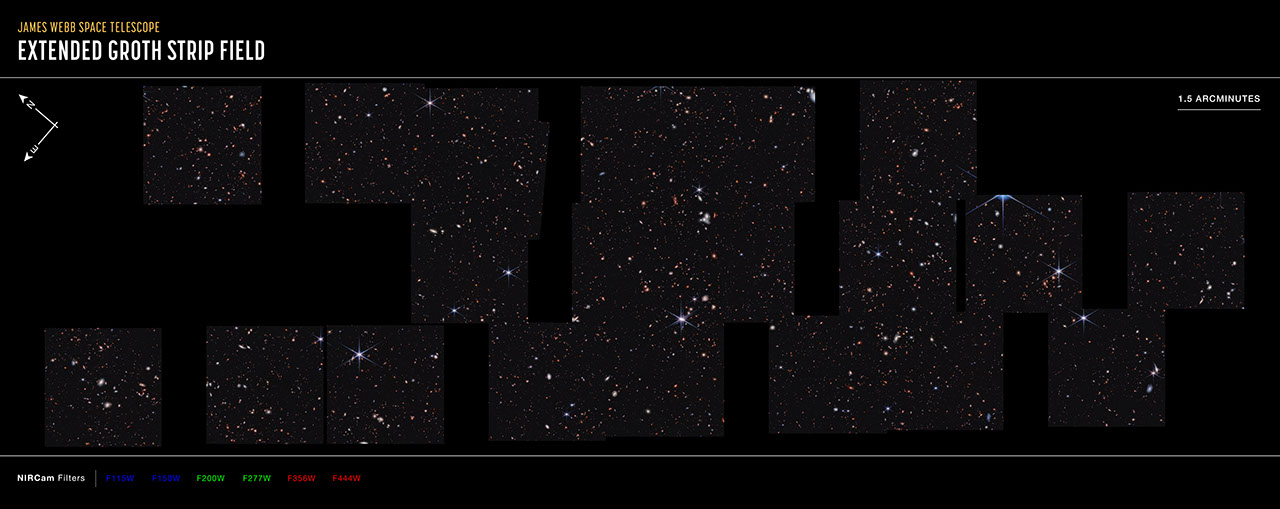
Cosmic Evolution Early Release Science (CEERS) Survey (NIRCam Image)
Stare deeply at this vast landscape. It was stitched together from multiple images captured by the James Webb Space Telescope in near-infrared light – and it is practically pulsing with activity. To the right of center is a clump of bright white spiral galaxies that seem to be...
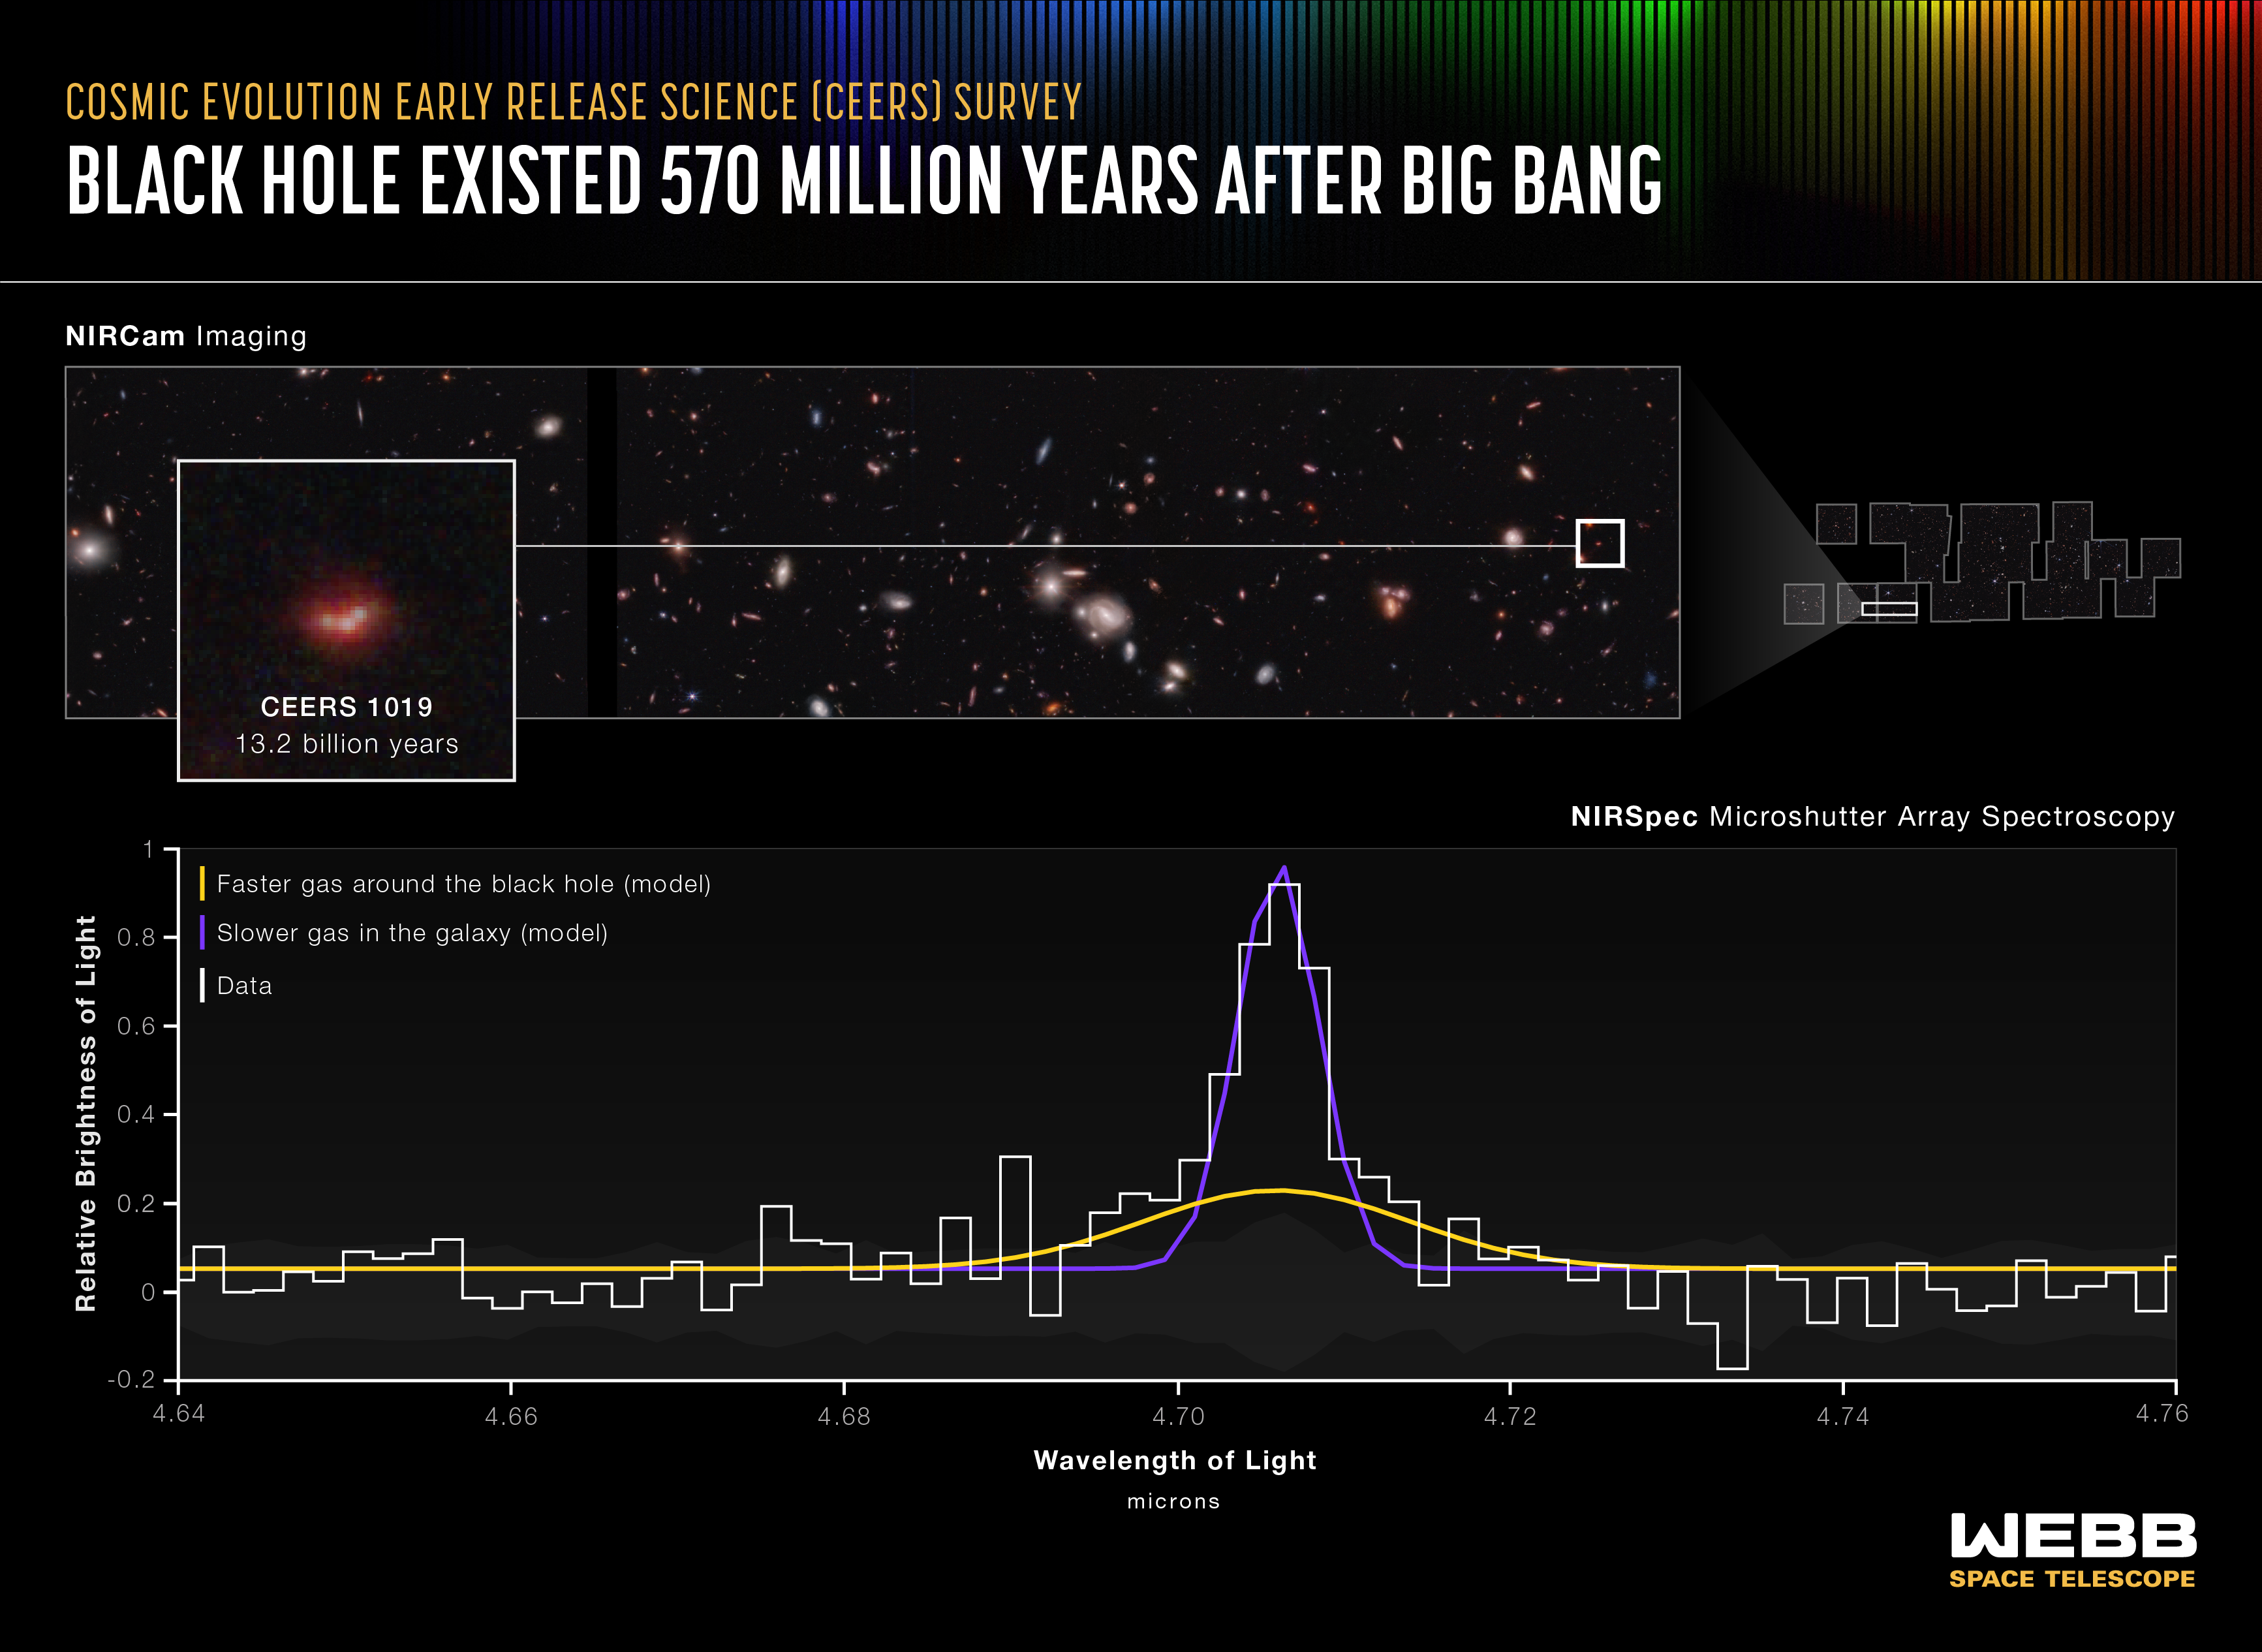
Black Hole Existed 570 Million Years After Big Bang (NIRSpec MSA Emission Spectrum)
Researchers have identified the most distant active supermassive black hole to date in the James Webb Space Telescope’s Cosmic Evolution Early Release Science (CEERS) Survey. The black hole, within galaxy CEERS 1019, existed just over 570 million years after the big bang and...
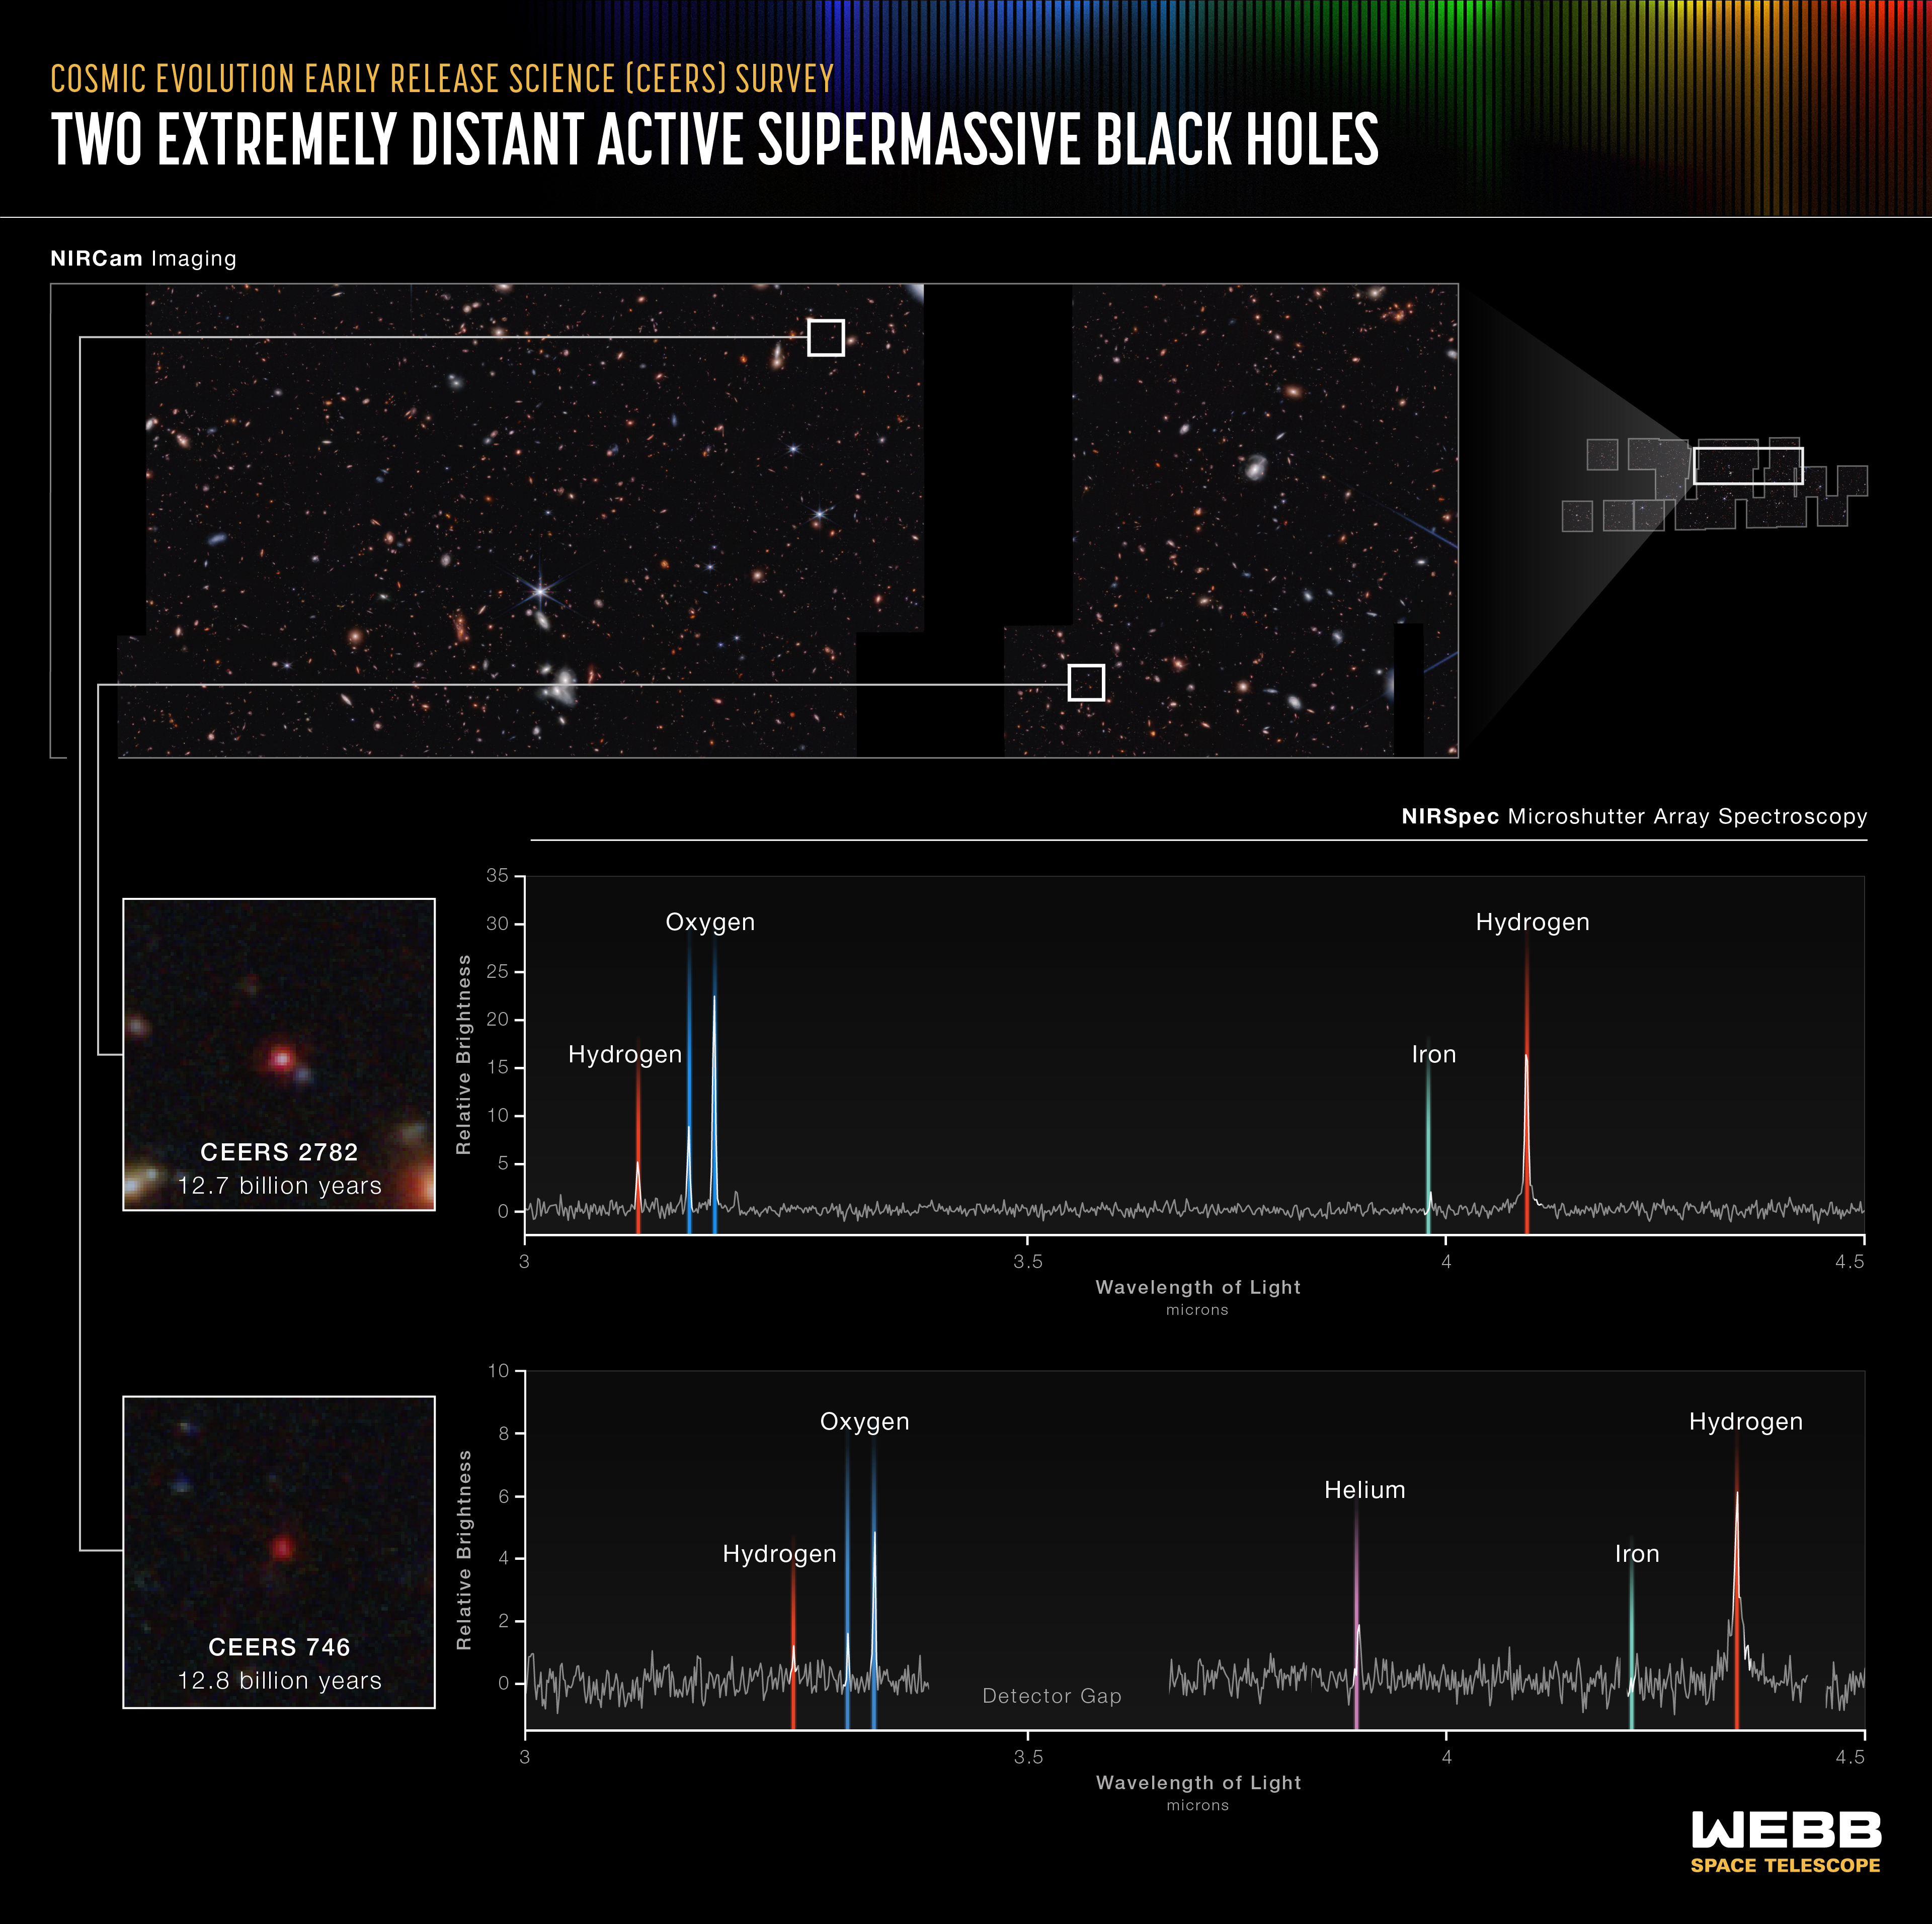
Two Extremely Distant Active Supermassive Black Holes (NIRSpec MSA Emission Spectra)
Researchers using data and images from the James Webb Space Telescope have already captured two of the smallest known supermassive black holes in the early universe. Webb’s spectra show that these black holes weigh only 10 million times the mass of the Sun. Other very distant...
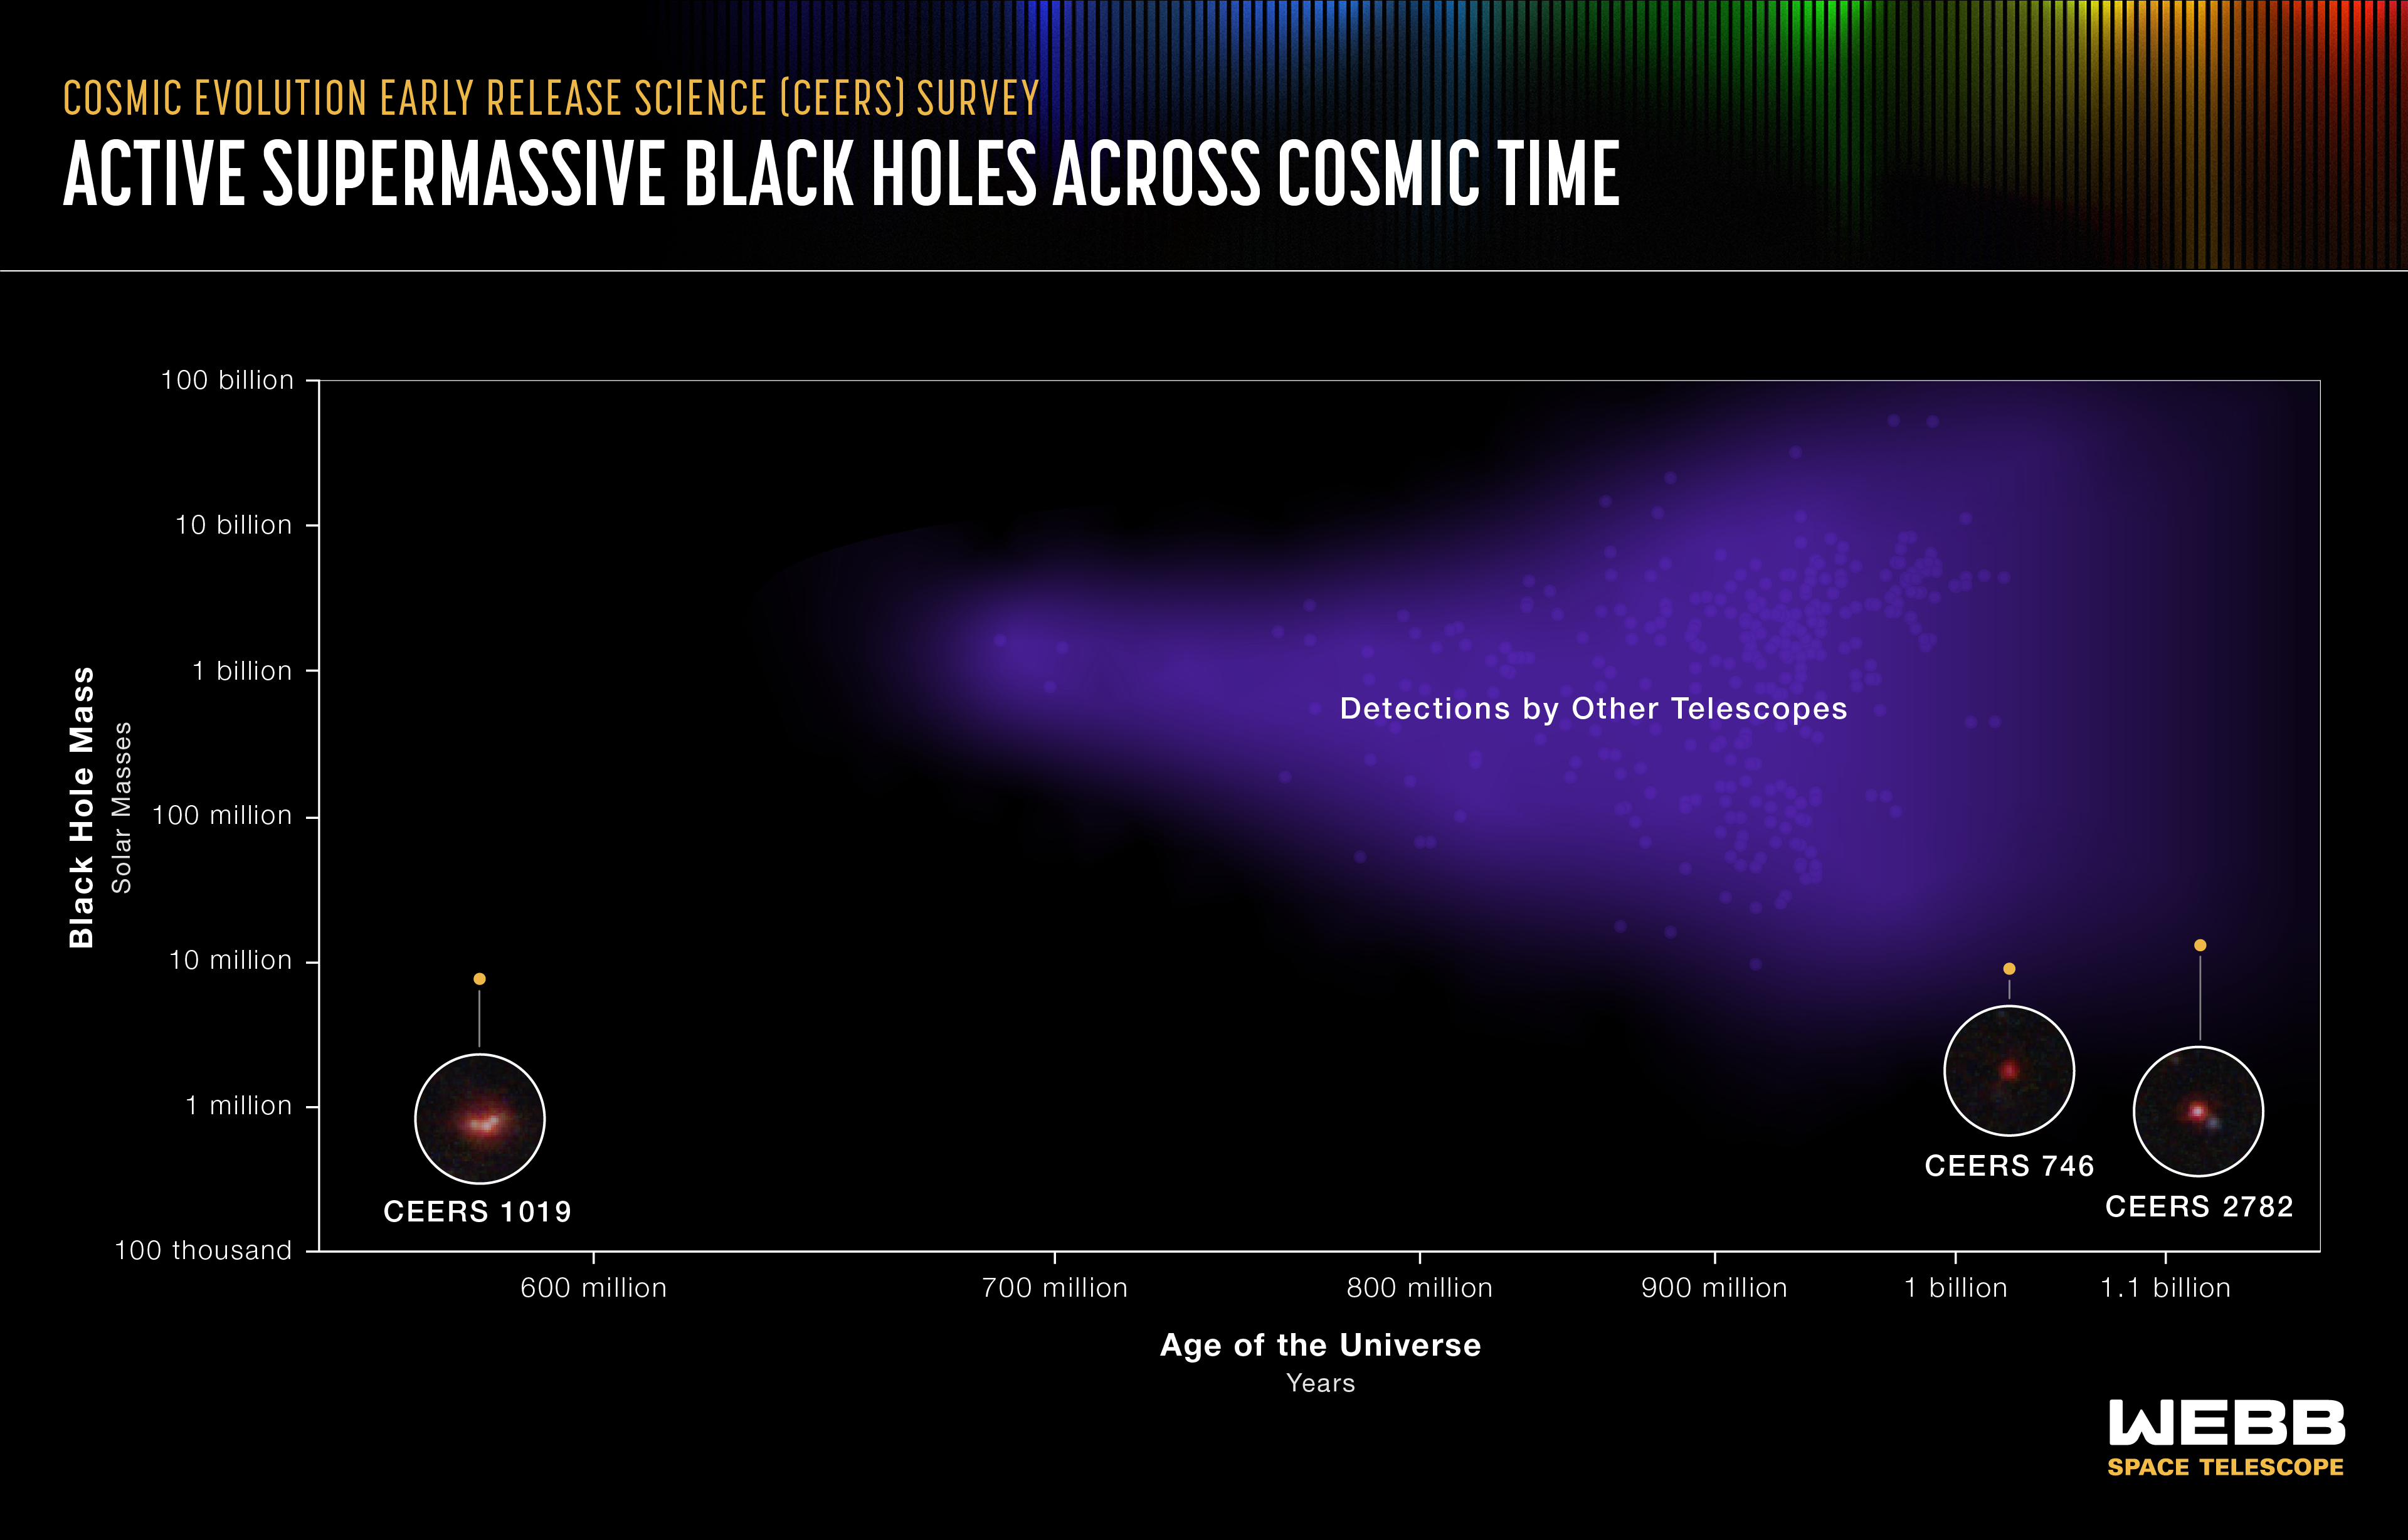
Active Supermassive Black Holes Across Cosmic Time
This graphic shows detections of the most distant active supermassive black holes currently known in the universe. They were identified by a range of telescopes, both in space and on the ground. Three were recently identified by in the James Webb Space Telescope’s Cosmic...
Cosmic Evolution Early Release Science (CEERS) Survey (NIRCam Compass Image)
Ten near-infrared pointings from NIRCam (the Near-Infrared Camera) aboard the James Webb Space Telescope were stitched together to create this mosaic, known as the Cosmic Evolution Early Release Science (CEERS) Survey. These observations are within the same region studied by the...
Share
Details
Laura Betz
NASA’s Goddard Space Flight Center
Greenbelt, Maryland
laura.e.betz@nasa.gov
NASA, ESA, CSA, Leah Hustak (STScI)
Steve Finkelstein (UT Austin), Seiji Fujimoto (UT Austin), Pablo Arrabal Haro (NSF’s NOIRLab)


