1 min read
The Electromagnetic Spectrum (with Hubble, Webb, and Spitzer Highlights)
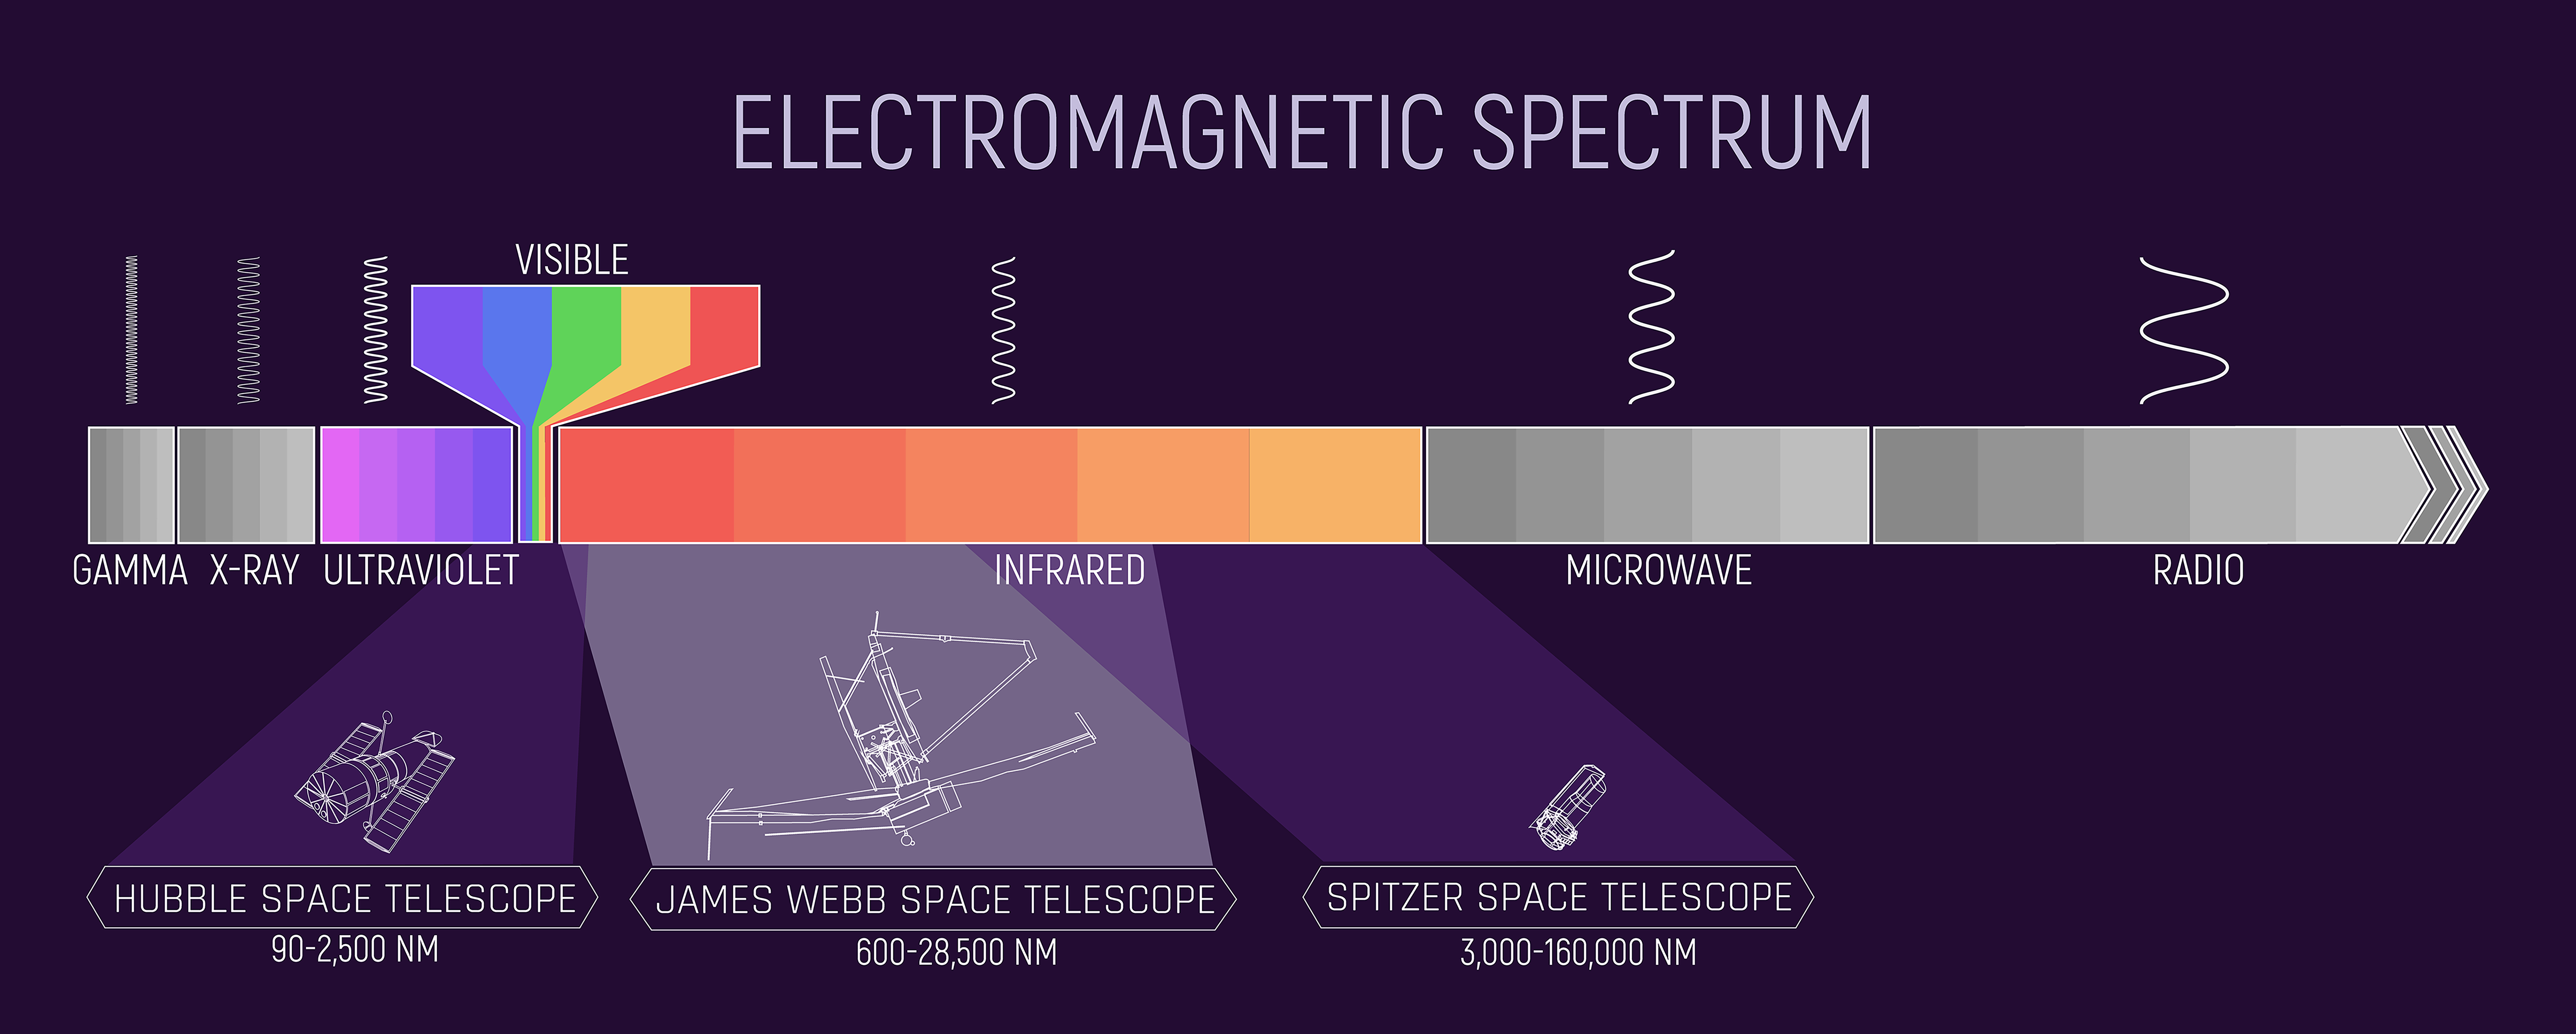
This infographic illustrates the spectrum of electromagnetic energy, specifically highlighting the portions detected by NASA’s Hubble, Spitzer, and Webb space telescopes. The portion of the spectrum labeled “visible,” with the colors of the rainbow, is what humans detect as visible light. Beyond the red end of the visible spectrum, the wavelengths are longer than the human eye can detect. The portion of the spectrum immediately beyond red is called infrared. Humans can feel infrared energy as heat. Each of these telescopes detects portions of the infrared spectrum and astronomers can analyze that data, essentially making the invisible visible. Longer wavelengths like infrared, microwave, and radio waves are able to pass through areas of dense gas clouds and other matter in the universe where shorter wavelengths get trapped. By detecting these longer wavelengths with telescopes, we are able to see things in the universe that we could never see in visible light. The infographic demonstrates how much of the electromagnetic spectrum each of these telescopes covers and also their combined coverage. There are other telescopes that detect other portions of the electromagnetic spectrum, and together these scientific instruments give us a more complete picture of the universe and how it functions.
Share
Details
Last Updated
Aug 28, 2025
Contact
Media
Laura Betz
NASA’s Goddard Space Flight Center
Greenbelt, Maryland
laura.e.betz@nasa.gov
Image Credit
NASA, ESA, CSA, Joseph Olmsted (STScI)


