


1 min read
Transmission Spectrum of an Earth-like Atmosphere
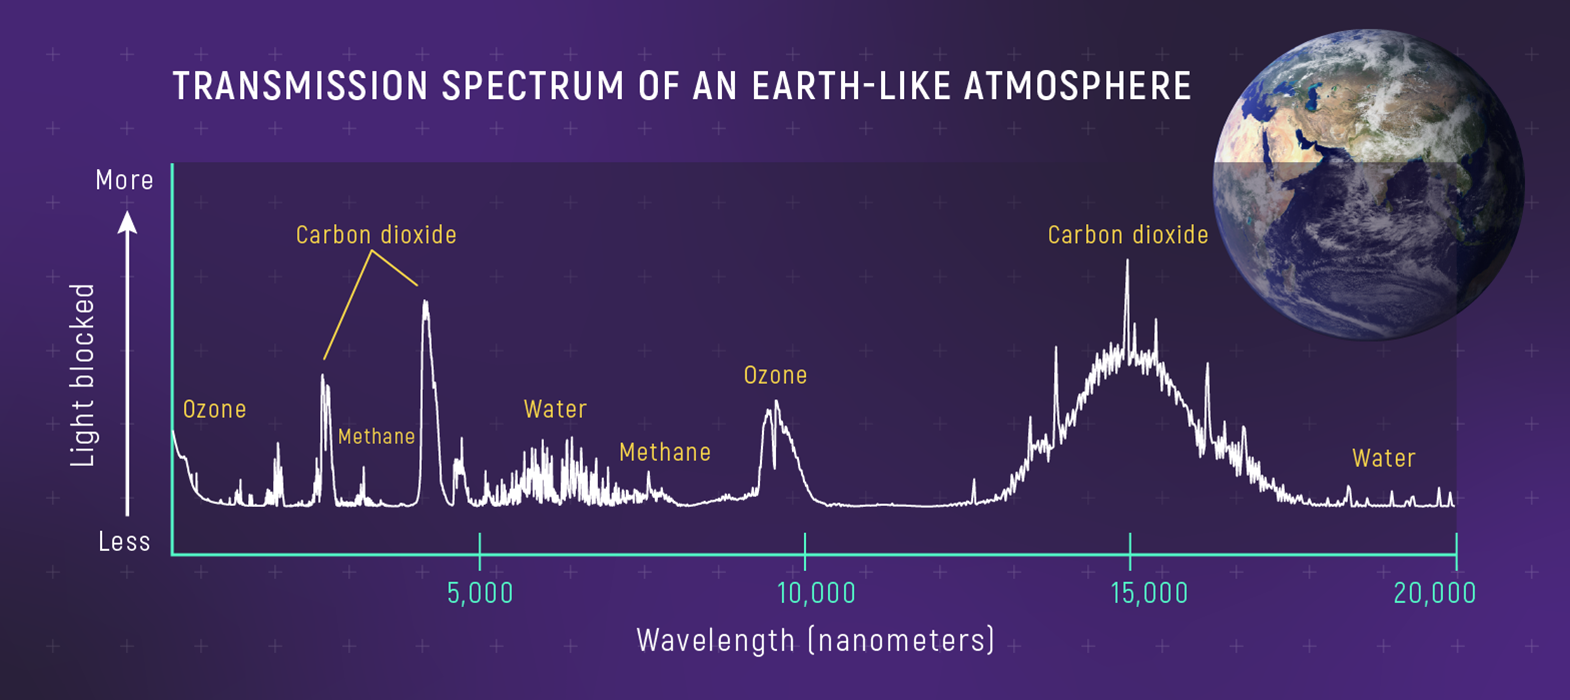
A transmission spectrum of an Earth-like atmosphere shows wavelengths of sunlight that molecules like ozone (O3), water (H2O), carbon dioxide (CO2), and methane (CH4) absorb. (Notice that on this graph, the y-axis shows amount of light blocked by Earth’s atmosphere rather than brightness of sunlight that travels through the atmosphere: Brightness decreases from bottom to top.)
Transmission spectroscopy is used to study the atmospheres of planets orbiting distant stars. An understanding of the atmospheres and spectra of Earth and other planets in the Solar System is crucial for accurate interpretation of transmission spectra of exoplanets. A transmission spectrum is a type of absorption spectrum.
Model transmission spectrum from Lisa Kaltenegger and Zifan Lin 2021 ApJL 909
Share
Details
Laura Betz
NASA’s Goddard Space Flight Center
Greenbelt, Maryland
laura.e.betz@nasa.gov
NASA, ESA, CSA, Leah Hustak (STScI)


