


1 min read
TRAPPIST-1 c Emission Spectra
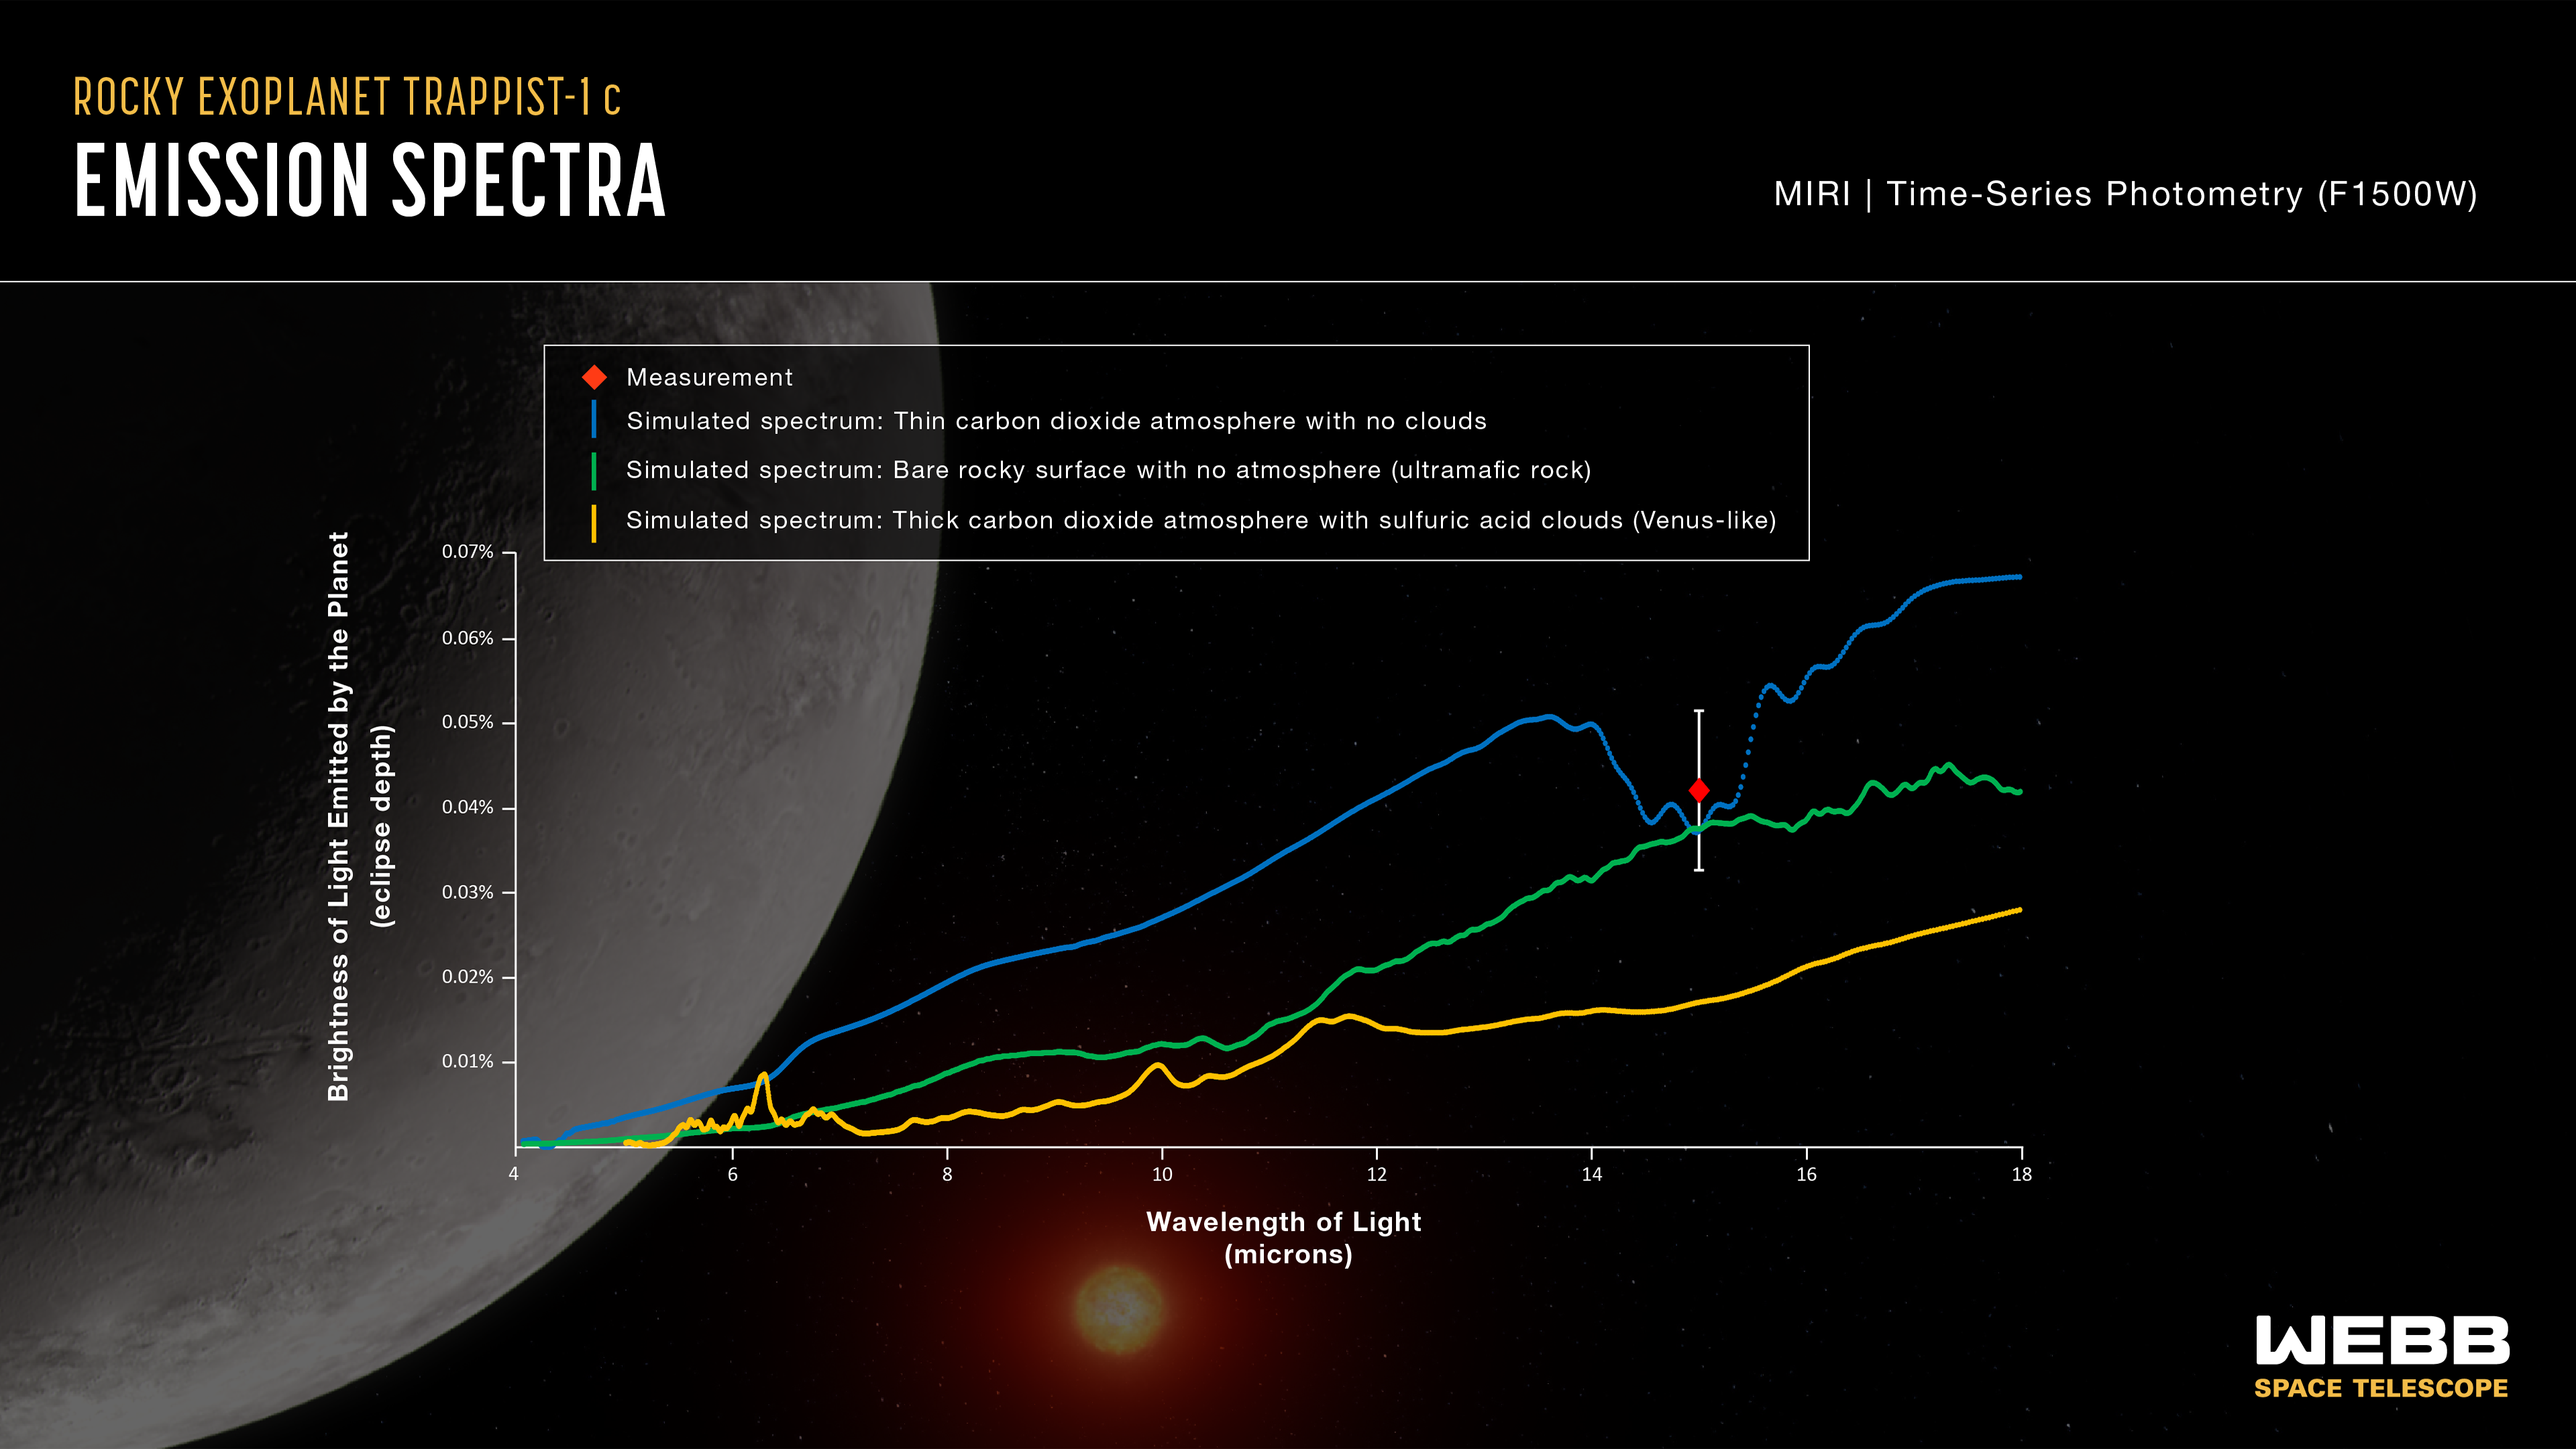
This graph compares the measured brightness of TRAPPIST-1 c to simulated brightness data for three different scenarios. The measurement (red diamond) is consistent with a bare rocky surface with no atmosphere (green line) or a very thin carbon dioxide atmosphere with no clouds (blue line). A thick carbon dioxide-rich atmosphere with sulfuric acid clouds, similar to that of Venus (yellow line), is unlikely.
The y-axis of the graph shows brightness (also called intensity or flux) of light in terms of eclipse depth, which is the difference between the combine brightness of the star and planet (when the planet is beside the star) and the brightness of the star on its own (when the planet is behind the star). Brightness increases from bottom to top on the graph: The greater the eclipse depth, the brighter the light from the planet. The x-axis shows the wavelength (or color) of light being measured. All of the wavelengths shown here are in the infrared, which is invisible to human eyes.
The brightness of light emitted by the planet varies with wavelength: Some colors are brighter than others. The pattern of brightness (the spectrum) depends on factors such as the type of rock that makes up the surface, what the atmosphere is made of, and whether or not there are clouds. Different materials absorb and emit different amounts of different wavelengths of light.
The red diamond shows the brightness of TRAPPIST-1 c as measured using the F1500W filter on MIRI (Webb’s Mid-Infrared Instrument). The vertical lines extending above and below the diamond are error bars. The width of the blue box covers the range of wavelengths that were measured using MIRI’s F1500W filter, which allows light with wavelengths ranging from about 13.5 - 16.7 microns to pass through to the detectors.
The blue line shows what the emission spectrum of the planet’s dayside would look like assuming it has an oxygen atmosphere with 0.01% carbon dioxide, a surface pressure of 0.1 bars, and no clouds. (For reference, this is significantly thinner than Earth’s atmosphere, which is nitrogen- and oxygen-rich, with 0.04% carbon dioxide and a surface pressure of 1 bar.)
The green line shows what the emission spectrum of the planet’s dayside would be if it has no atmosphere and a rocky surface made of ultramafic rock. (Ultramafic rock is a type of igneous rock that somewhat richer in iron and magnesium and poorer in silica than basalt, which makes up the crust beneath Earth’s oceans.)
The orange line shows the emission spectrum of the planet’s dayside if it had an atmosphere closer to that of Venus, with 96.5% carbon dioxide, a surface pressure of 10 bars, and sulfuric acid clouds.
Extended Description and Image Alt Text
Extended Description
Graphic titled “Rocky Exoplanet TRAPPIST-1 c Emission Spectra, MIRI Time-Series Photometry (F1500W).” The graphic shows the brightness of 15-micron light captured by Webb’s Mid-Infrared Instrument plotted with three simulated emission spectra assuming different surface and atmospheric conditions, and an illustration of the planet and its star in the background. The data are plotted on an xy graph of brightness of light versus wavelength of light.
Graph
Axes
The vertical y-axis is titled “Brightness of Light Emitted by the Planet (eclipse depth)”. It range from 0 percent eclipse depth (less light emitted) at the origin on the bottom to 0.07 percent eclipse depth (more light emitted) at the top, with labeled tick marks every 0.01 percent.
The horizontal x-axis is titled, “Wavelength of Light (microns).” It ranges from 4 microns at the origin on the left to 18 microns on the right, with labeled tick marks every 2 microns.
Key
Above the graph is a key.
- Red diamond: “Measurement”
- Blue line: “Simulated spectrum: Thin carbon dioxide atmosphere with no clouds”
- Green line: “Simulated spectrum: Bare rocky surface with no atmosphere (ultramafic rock)”
- Yellow line: “Simulated spectrum: Thick carbon dioxide atmosphere with sulfuric acid clouds (Venus-like)”
Graphed Data
Measurement
The red diamond representing the MIRI measurement has xy coordinates of 15 microns and 0.04 percent eclipse depth. Projecting above and below the diamond are vertical white lines representing error bars. These extend approximately 0.01 percent eclipse depth above and below the diamond. The red diamond plots just above the blue and green lines and far above the yellow line. Its lower error bar intersects the blue and green lines, but not the yellow line.
Simulated spectrum: Thin carbon dioxide atmosphere with no clouds
The simulated data for a thin cloud-free atmosphere form a blue line with a slope of about 20 degrees. The line shows a general steady increase in brightness from nearly 0 percent eclipse depth at 4 microns to about 0.07 percent eclipse depth at 18 microns. About three-quarters of the way along, the steady positive slope is broken by a relatively wide and deep valley with steep sides and a sinuous floor. The valley spans from about 13.5 to 15.5 microns, and has a depth of about 0.015 percent eclipse depth.
The red diamond representing the 15-micron MIRI measurement plots just above the middle of this valley, with the lower error bar intersecting the valley floor.
Simulated spectrum: Bare rocky surface with no atmosphere (ultramafic rock)
The simulated data for a bare rocky surface form a green line with a relatively smooth and steady positive slope of about 15 degrees. Brightness increases from almost 0 percent eclipse depth at 4 microns to about 0.04 percent eclipse depth at 18 microns.
The green line intersects the blue line at 15 microns, showing that the 15-micron brightness of the bare rock simulation is almost the same as the 15-micron brightness of the thin atmosphere simulation. This is the only place where the green and blue lines intersect.
The red diamond representing the 15-micron MIRI measurement plots just above the green line, with lower error bar intersecting it.
Simulated spectrum: Thick carbon dioxide atmosphere with sulfuric acid clouds (Venus-like)
The simulated data for a Venus-like atmosphere form a yellow line with a general upward slope of about 10 degrees. The line shows a general increase in brightness from nearly 0 percent eclipse depth at 4 microns to about 0.025 percent eclipse depth at 18 microns. The line is relatively jagged between about 4 and 8 microns, forming a number of sharp peaks and valleys, some of which intersect the green and blue lines. At wavelengths above 12 microns, the yellow line plots far below the green and blue lines.
The red diamond representing the 15-micron MIRI measurement plots far above the yellow line. The error bar does intersect it.
Background
In the background of the graphic is an illustration of the planet and its star. The planet is light gray with a few craters. The star is yellowish red with a mottled surface and a bright orange-red glow.
Image Alt Text
Graph showing the brightness of 15-micron light captured by Webb’s Mid Infrared Instrument plotted with three different simulated emission spectra, and an illustration of the planet and its star in the background.
- Release DateJune 19, 2023
- Science ReleaseWebb Rules Out Thick Carbon Dioxide Atmosphere for Rocky Exoplanet
- CreditIllustration: NASA, ESA, CSA, Joseph Olmsted (STScI); Science: Sebastian Zieba (MPIA), Laura Kreidberg (MPIA)
Related Images & Videos
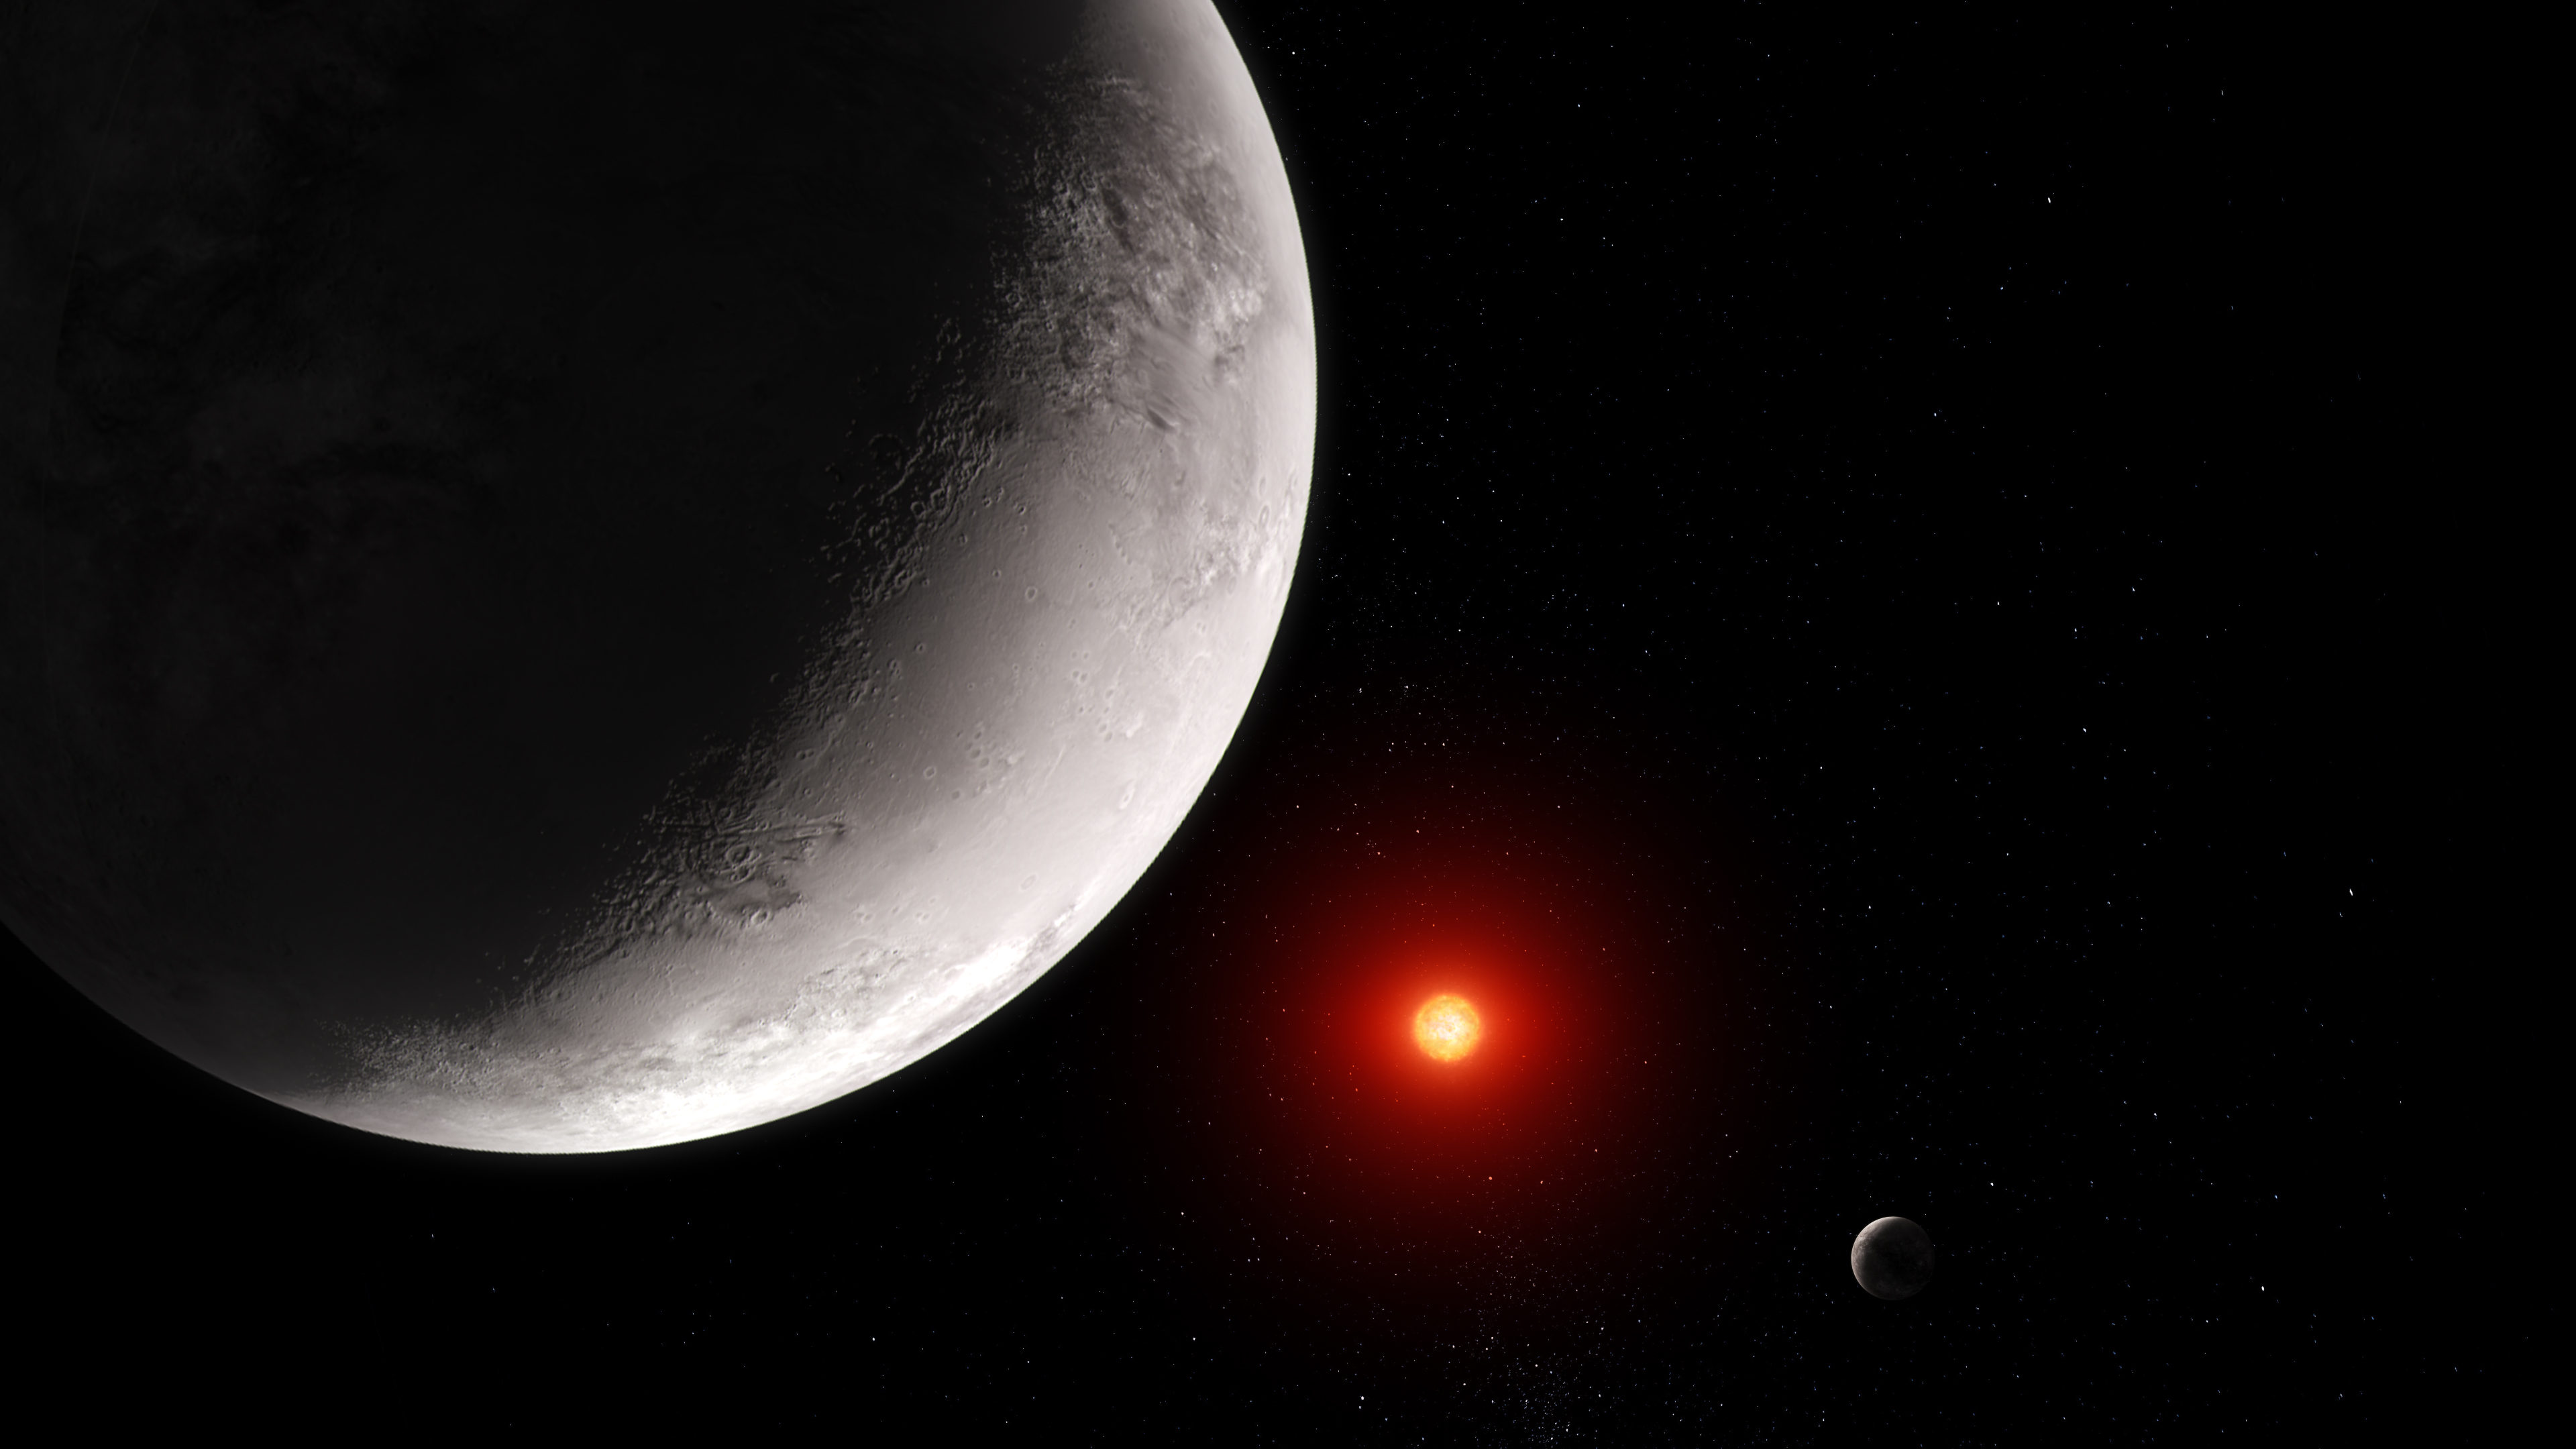
Rocky Exoplanet TRAPPIST-1 c (Artist Concept)
This artist' concept shows what the hot rocky exoplanet TRAPPIST-1 c could look like based on this work. TRAPPIST-1 c, the second of seven known planets in the TRAPPIST-1 system, orbits its star at a distance of 0.016 AU (about 1.5 million miles), completing one circuit in just...
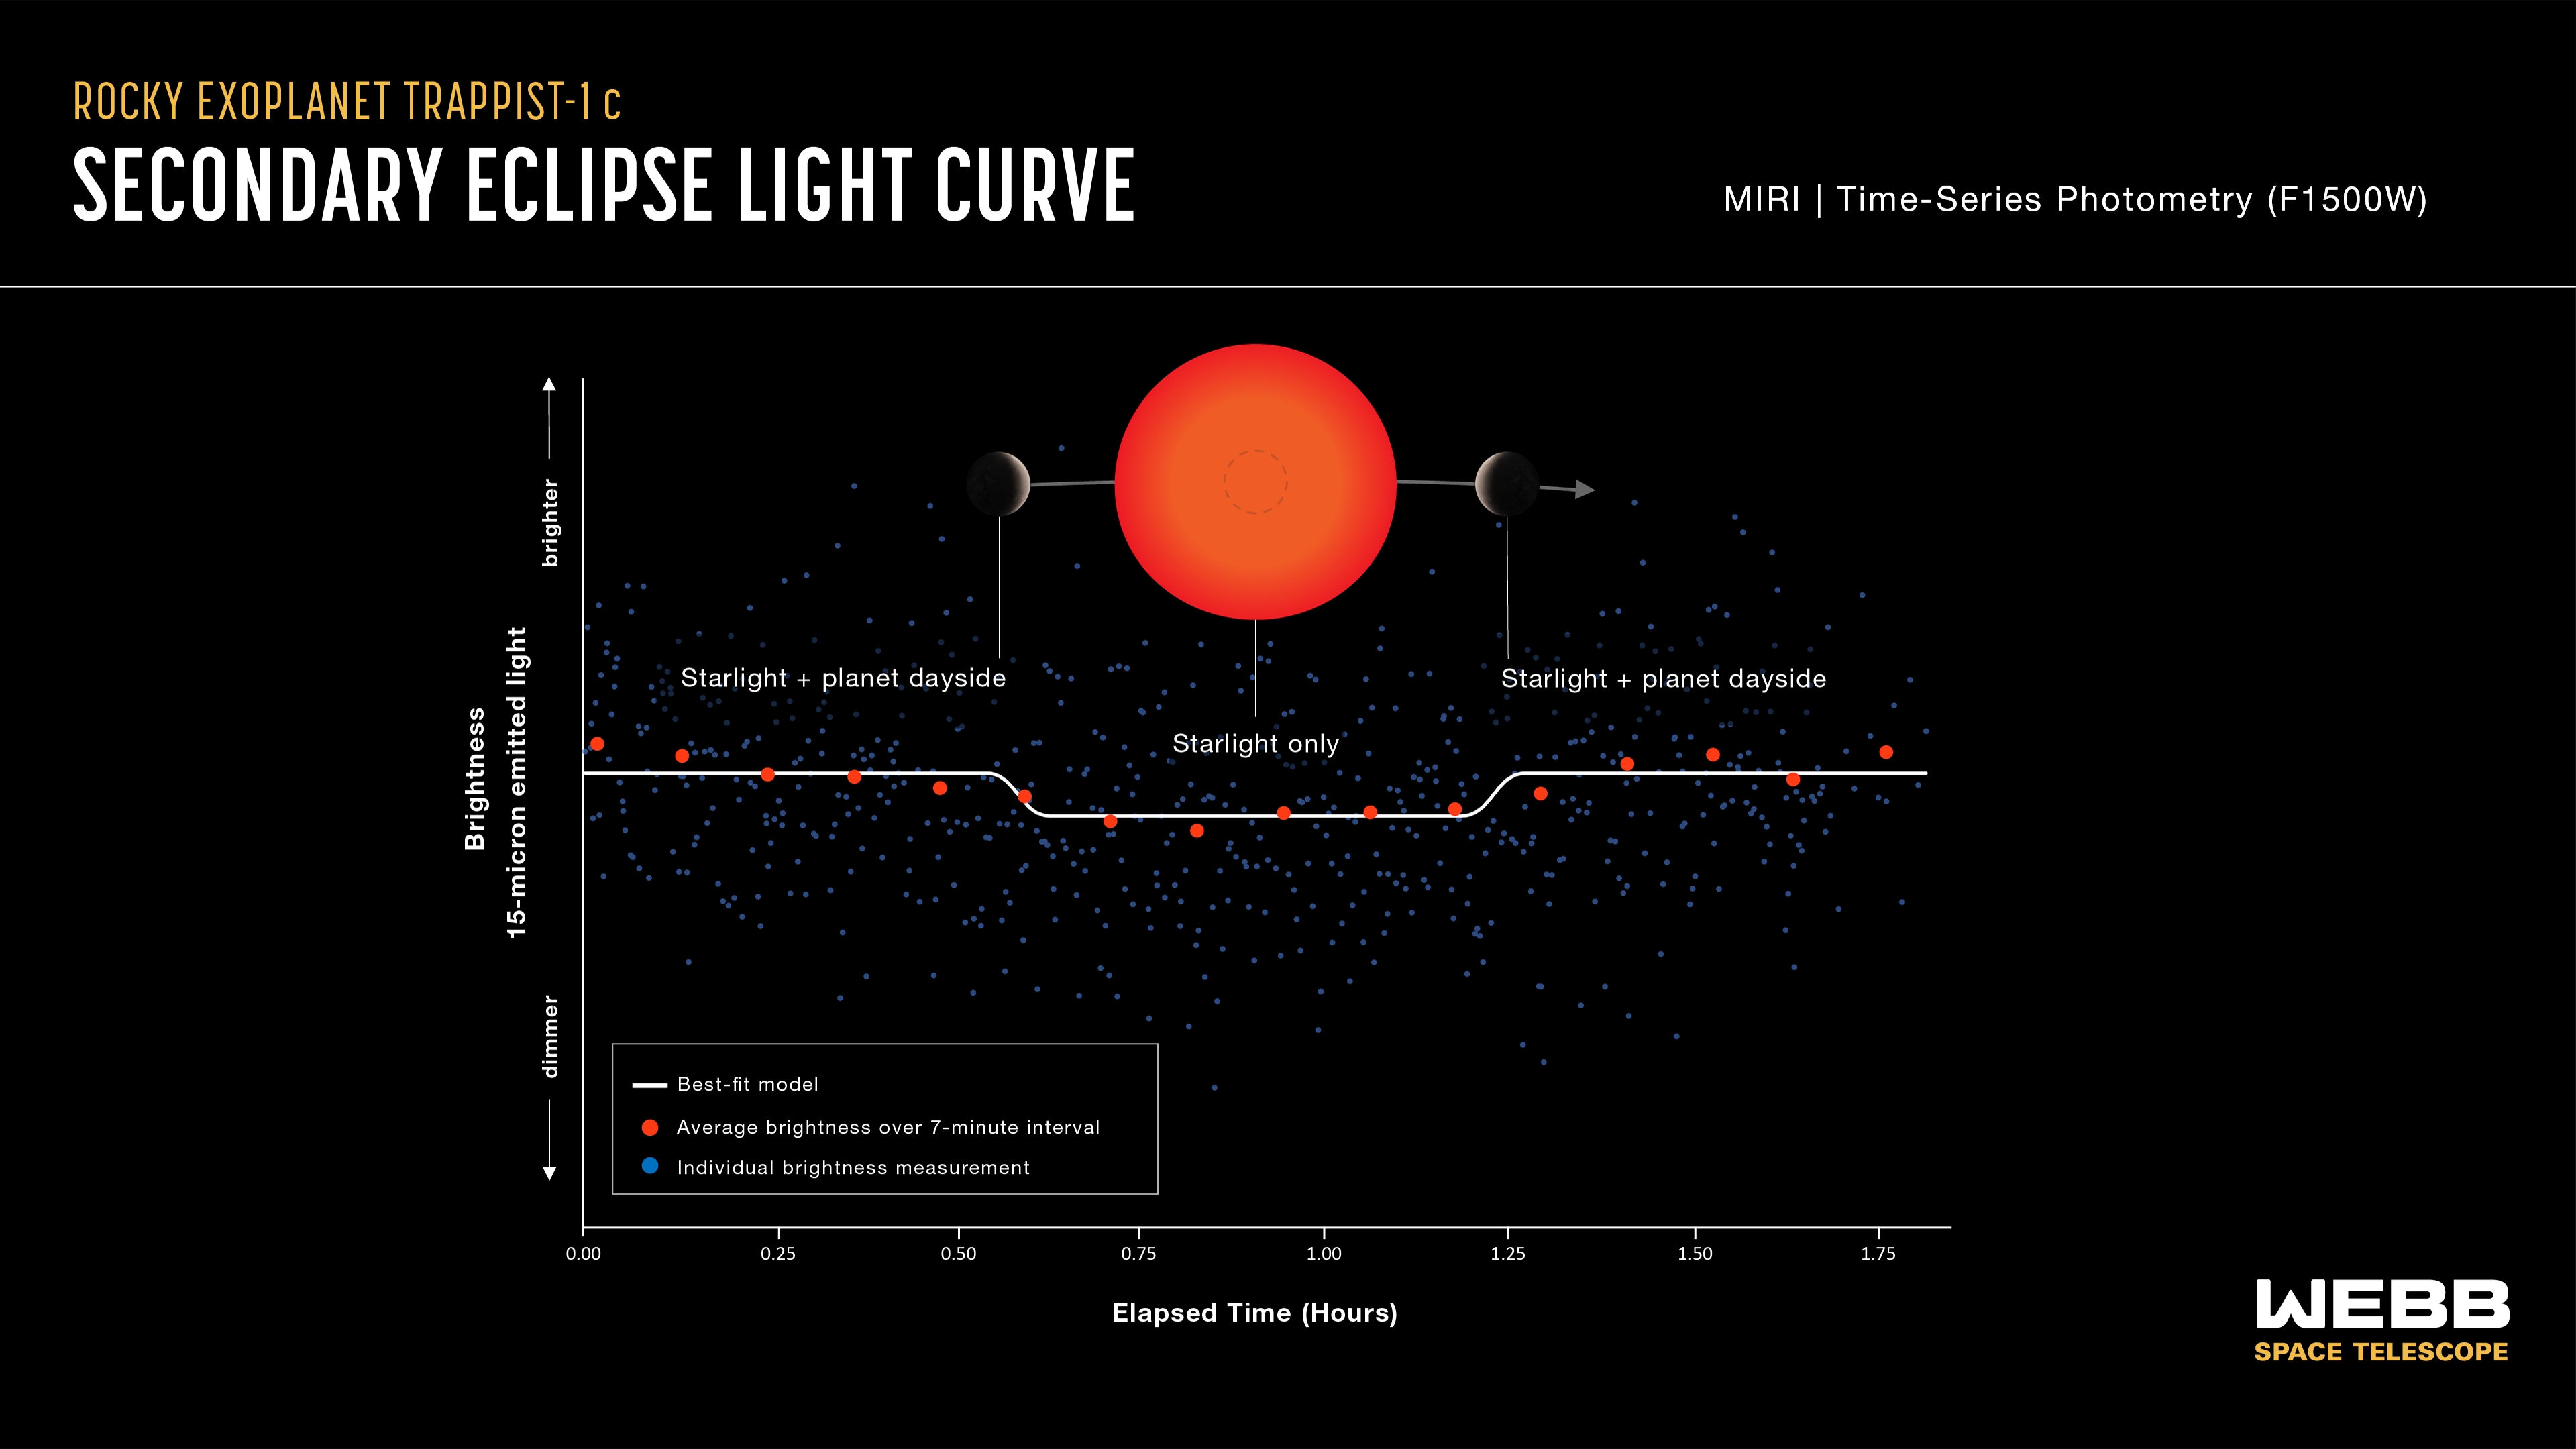
TRAPPIST-1 c Light Curve
This light curve shows the change in brightness of the TRAPPIST-1 system as the second planet, TRAPPIST-1 c, moves behind the star. This phenomenon is known as a secondary eclipse . Astronomers used Webb’s Mid-Infrared Instrument (MIRI) to measure the brightness of mid-infrared...
Share
Details
Laura Betz
NASA’s Goddard Space Flight Center
Greenbelt, Maryland
laura.e.betz@nasa.gov
NASA, ESA, CSA, Joseph Olmsted (STScI)
Sebastian Zieba (MPIA), Laura Kreidberg (MPIA)


