


1 min read
Water Abundance (MIRI Emission Spectrum)
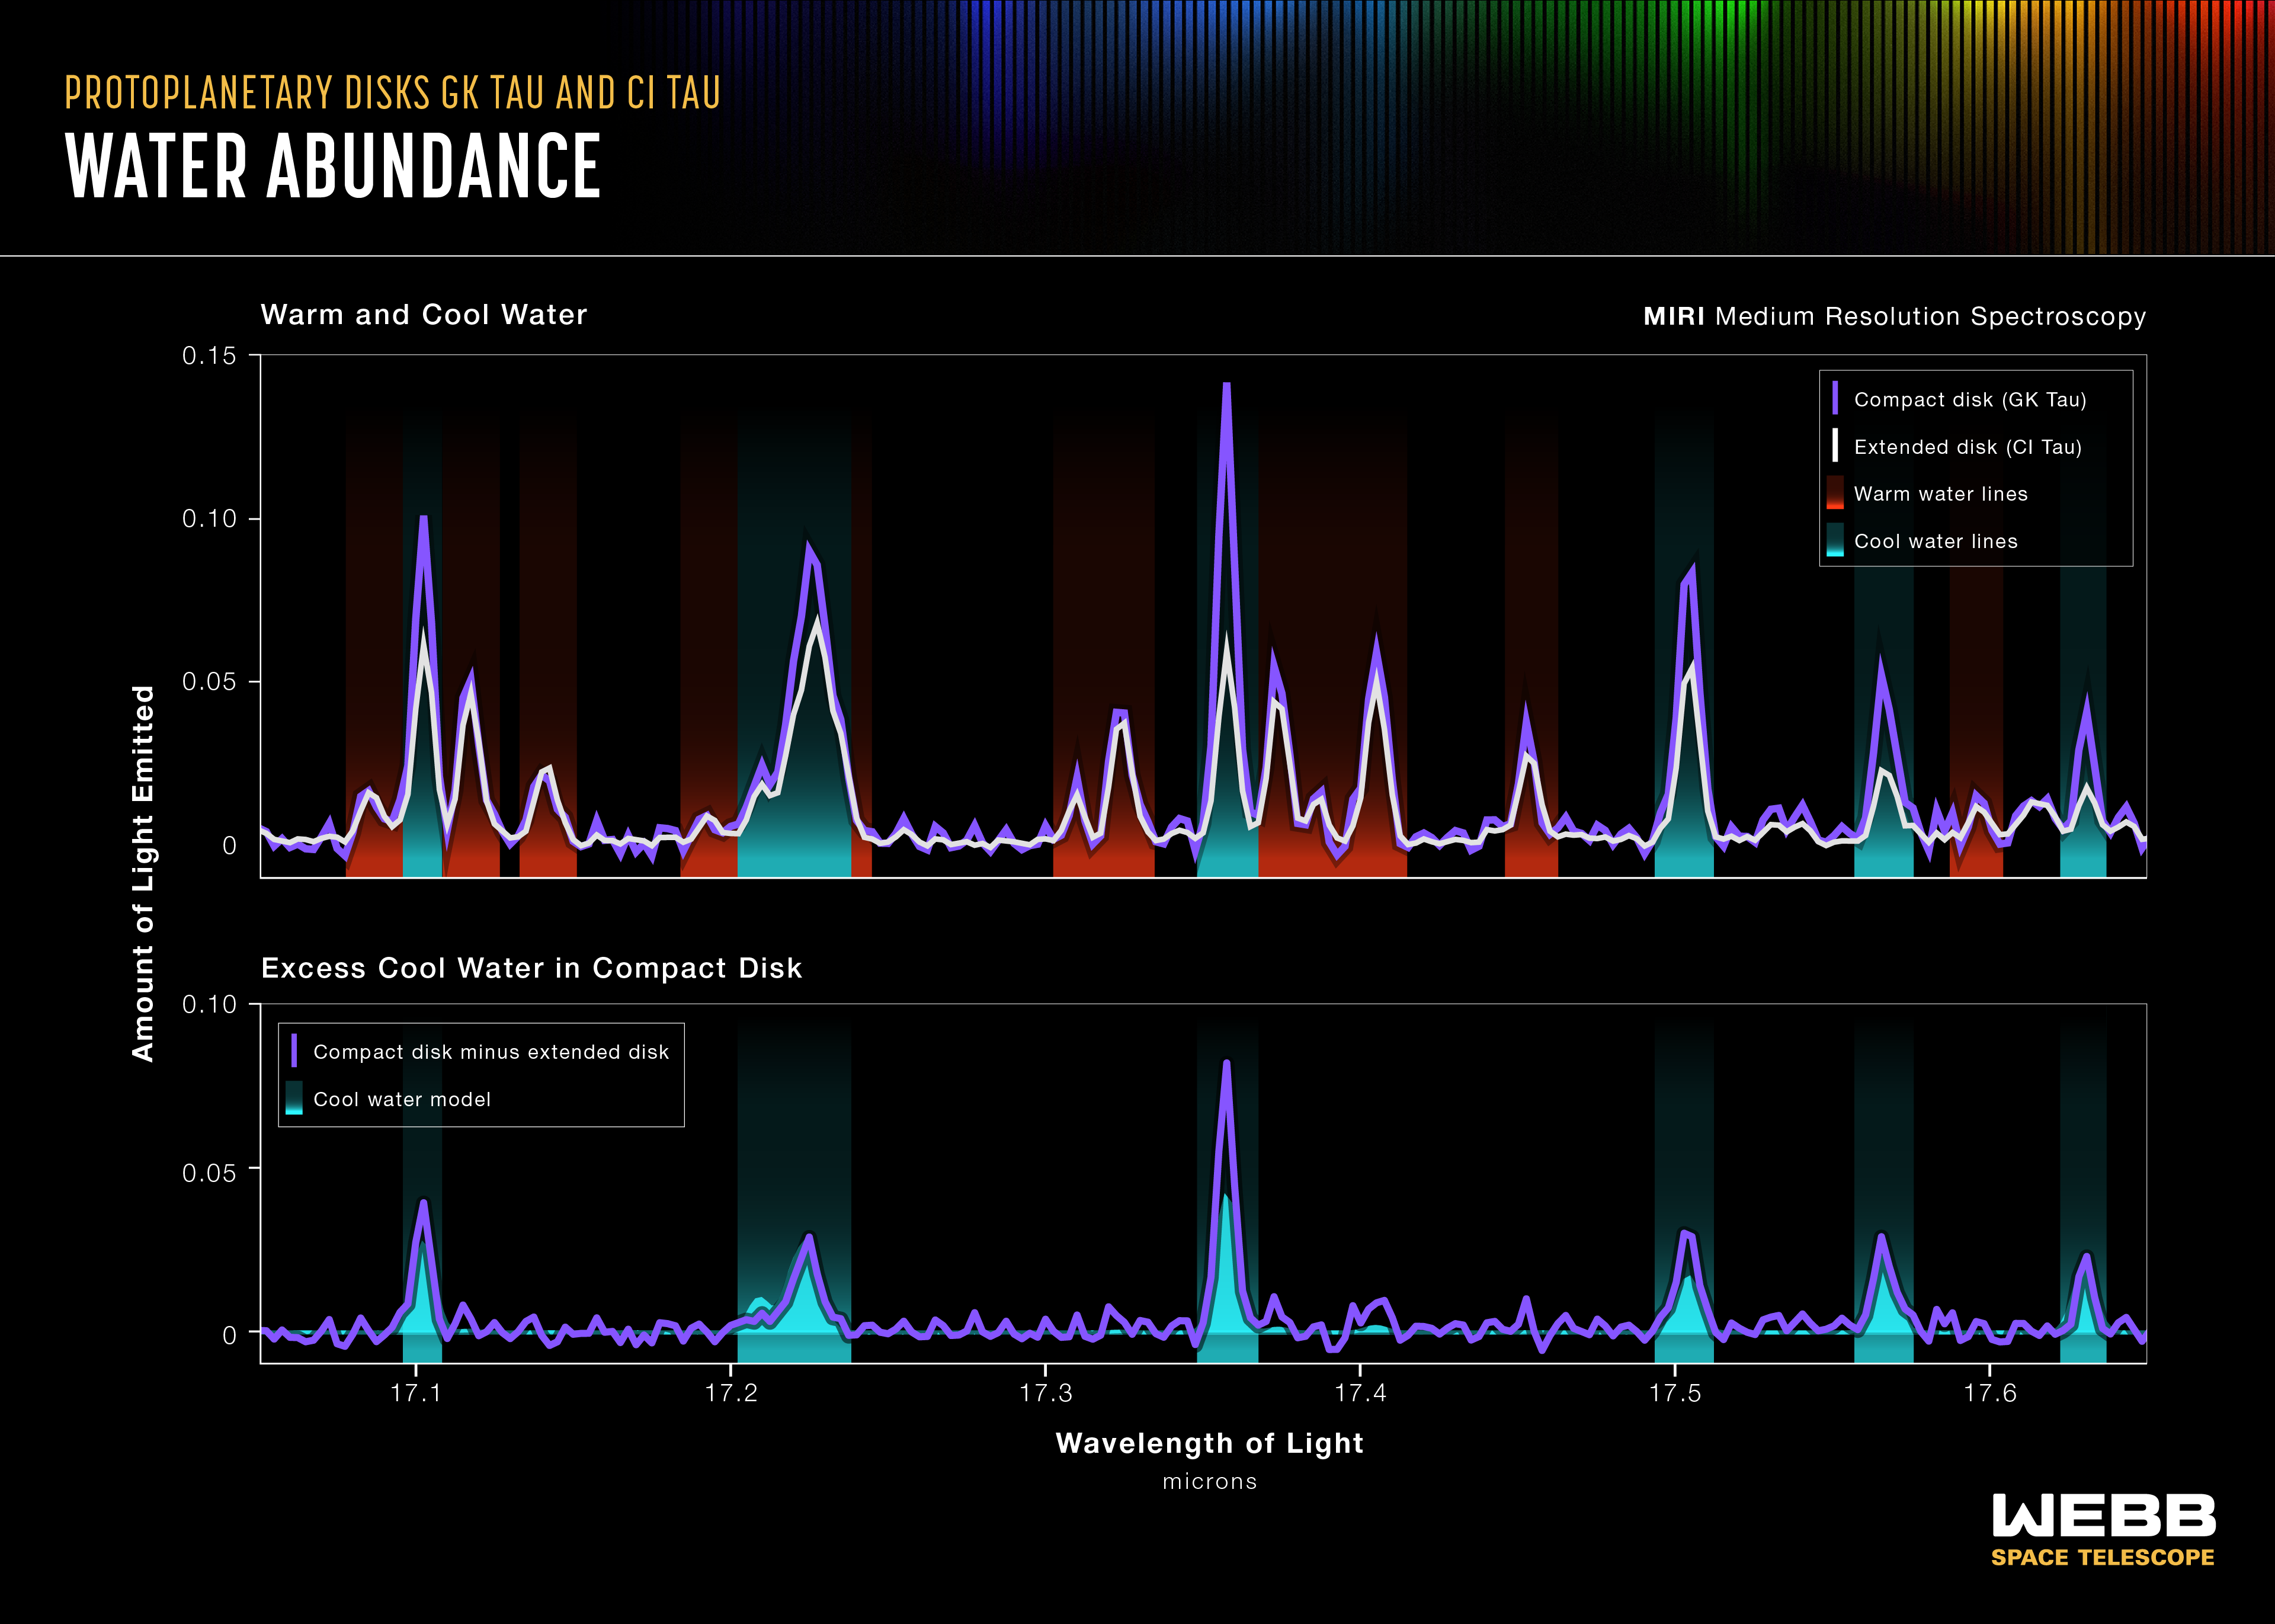
This graphic compares the spectral data for warm and cool water in the GK Tau disk, which is a compact disk without rings, and extended CI Tau disk, which has at least three rings on different orbits. The science team employed the unprecedented resolving power of MIRI’s MRS (the Medium-Resolution Spectrometer) to separate the spectra into individual lines that probe water at different temperatures. These spectra, seen in the top graph, clearly reveal excess cool water in the compact GK Tau disk, compared with the large CI Tau disk.
The bottom graph shows the excess cool water data in the compact GK Tau disk minus the cool water data in the extended CI Tau disk. The actual data, in purple, are overlaid on a model spectrum of cool water. Note how closely they align.
Extended Description and Image Alt Text
Extended Description
Graphic entitled “Protoplanetary Disks GK Tau and CI Tau: Water Abundance” is a two-tiered spectral graph.
The top graph, entitled “Warm and Cool Water, MIRI Medium Resolution Spectroscopy” compares the spectral data for warm and cool water in the compact GK Tau disk with the extended CI Tau disk. The vertical axis is labeled “Amount of Light Emitted” with tick marks at 0, 0.05, 0.10, and 0.15, traveling up the axis. The horizontal axis is unlabeled. The compact disk’s data are shown as a jagged, purple line with peaks and valleys. The extended disk’s data are overlaid on this and depicted as a jagged white line, also with peaks and valleys. Beneath these jagged spectral lines are vertical red bars of various widths signifying warm water and green-blue bars of various widths signifying cool water.
The bottom graph, entitled “Excess Cool Water in Compact Disk,” shows the excess cool water data in the compact GK Tau disk minus the cool water data in the extended CI Tau disk. The vertical axis is labeled “Amount of Light Emitted” with tick marks at 0, 0.05, and 0.10, traveling up the axis. The horizontal axis is labeled “Wavelength of Light, Microns.” The data from the compact disk minus the extended disk, in purple, is portrayed as a jagged line with peaks and valleys. It is overlaid on a model spectrum of cool water, signified by a green-blue spectrum. Six significant peaks present in both the actual data and the model are highlighted with blue-green bars. The values in the data and the model align very closely.
Image Alt Text
Graphic compares the spectral data for warm and cool water in the compact GK Tau disk with the extended CI Tau disk. It also shows the excess cool water data in the compact GK Tau disk overlaid on a model spectrum of cool water.
- Release DateNovember 8, 2023
- Science ReleaseNASA’s Webb Findings Support Long-Proposed Process of Planet Formation
- CreditIllustration: NASA, ESA, CSA, Leah Hustak (STScI); Science: Andrea Banzatti (Texas State University)
Related Images & Videos
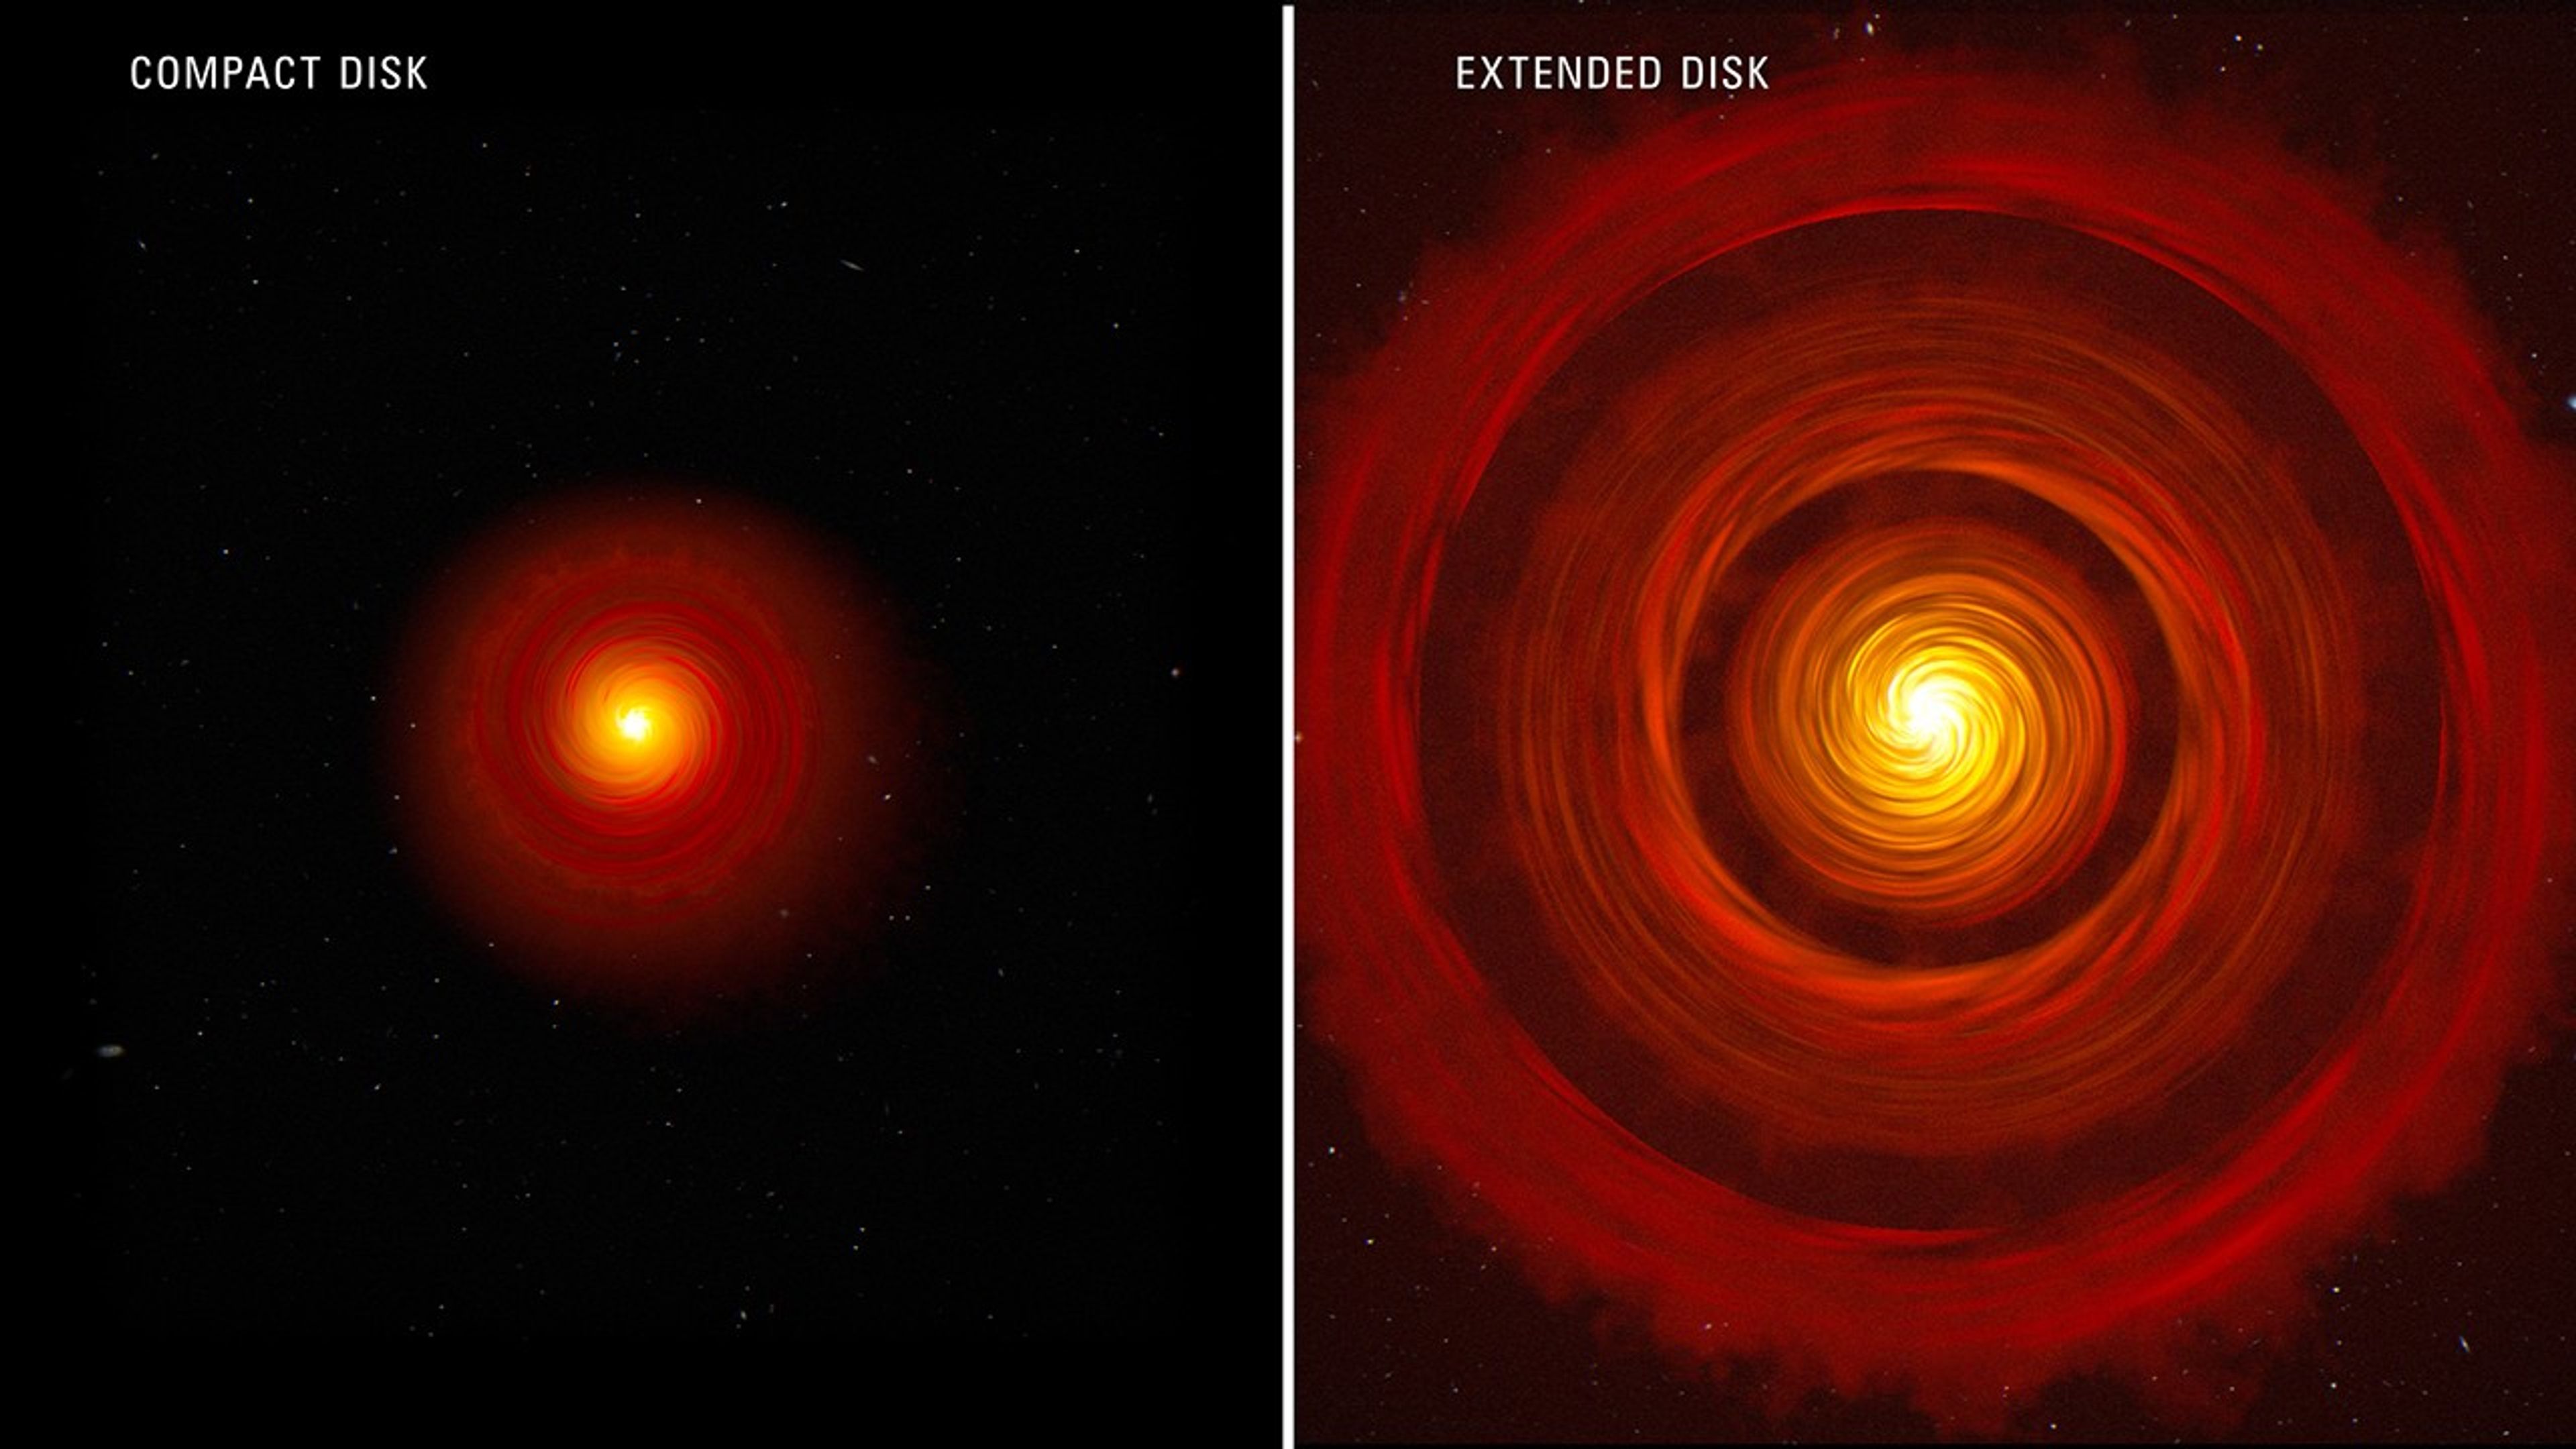
Two Protoplanetary Disks (Artist Concept)
This artist's concept compares two types of typical, planet-forming disks around newborn, Sun-like stars. On the left is a compact disk, and on the right is an extended disk with gaps. Scientists using Webb recently studied four protoplanetary disks — two compact and two...
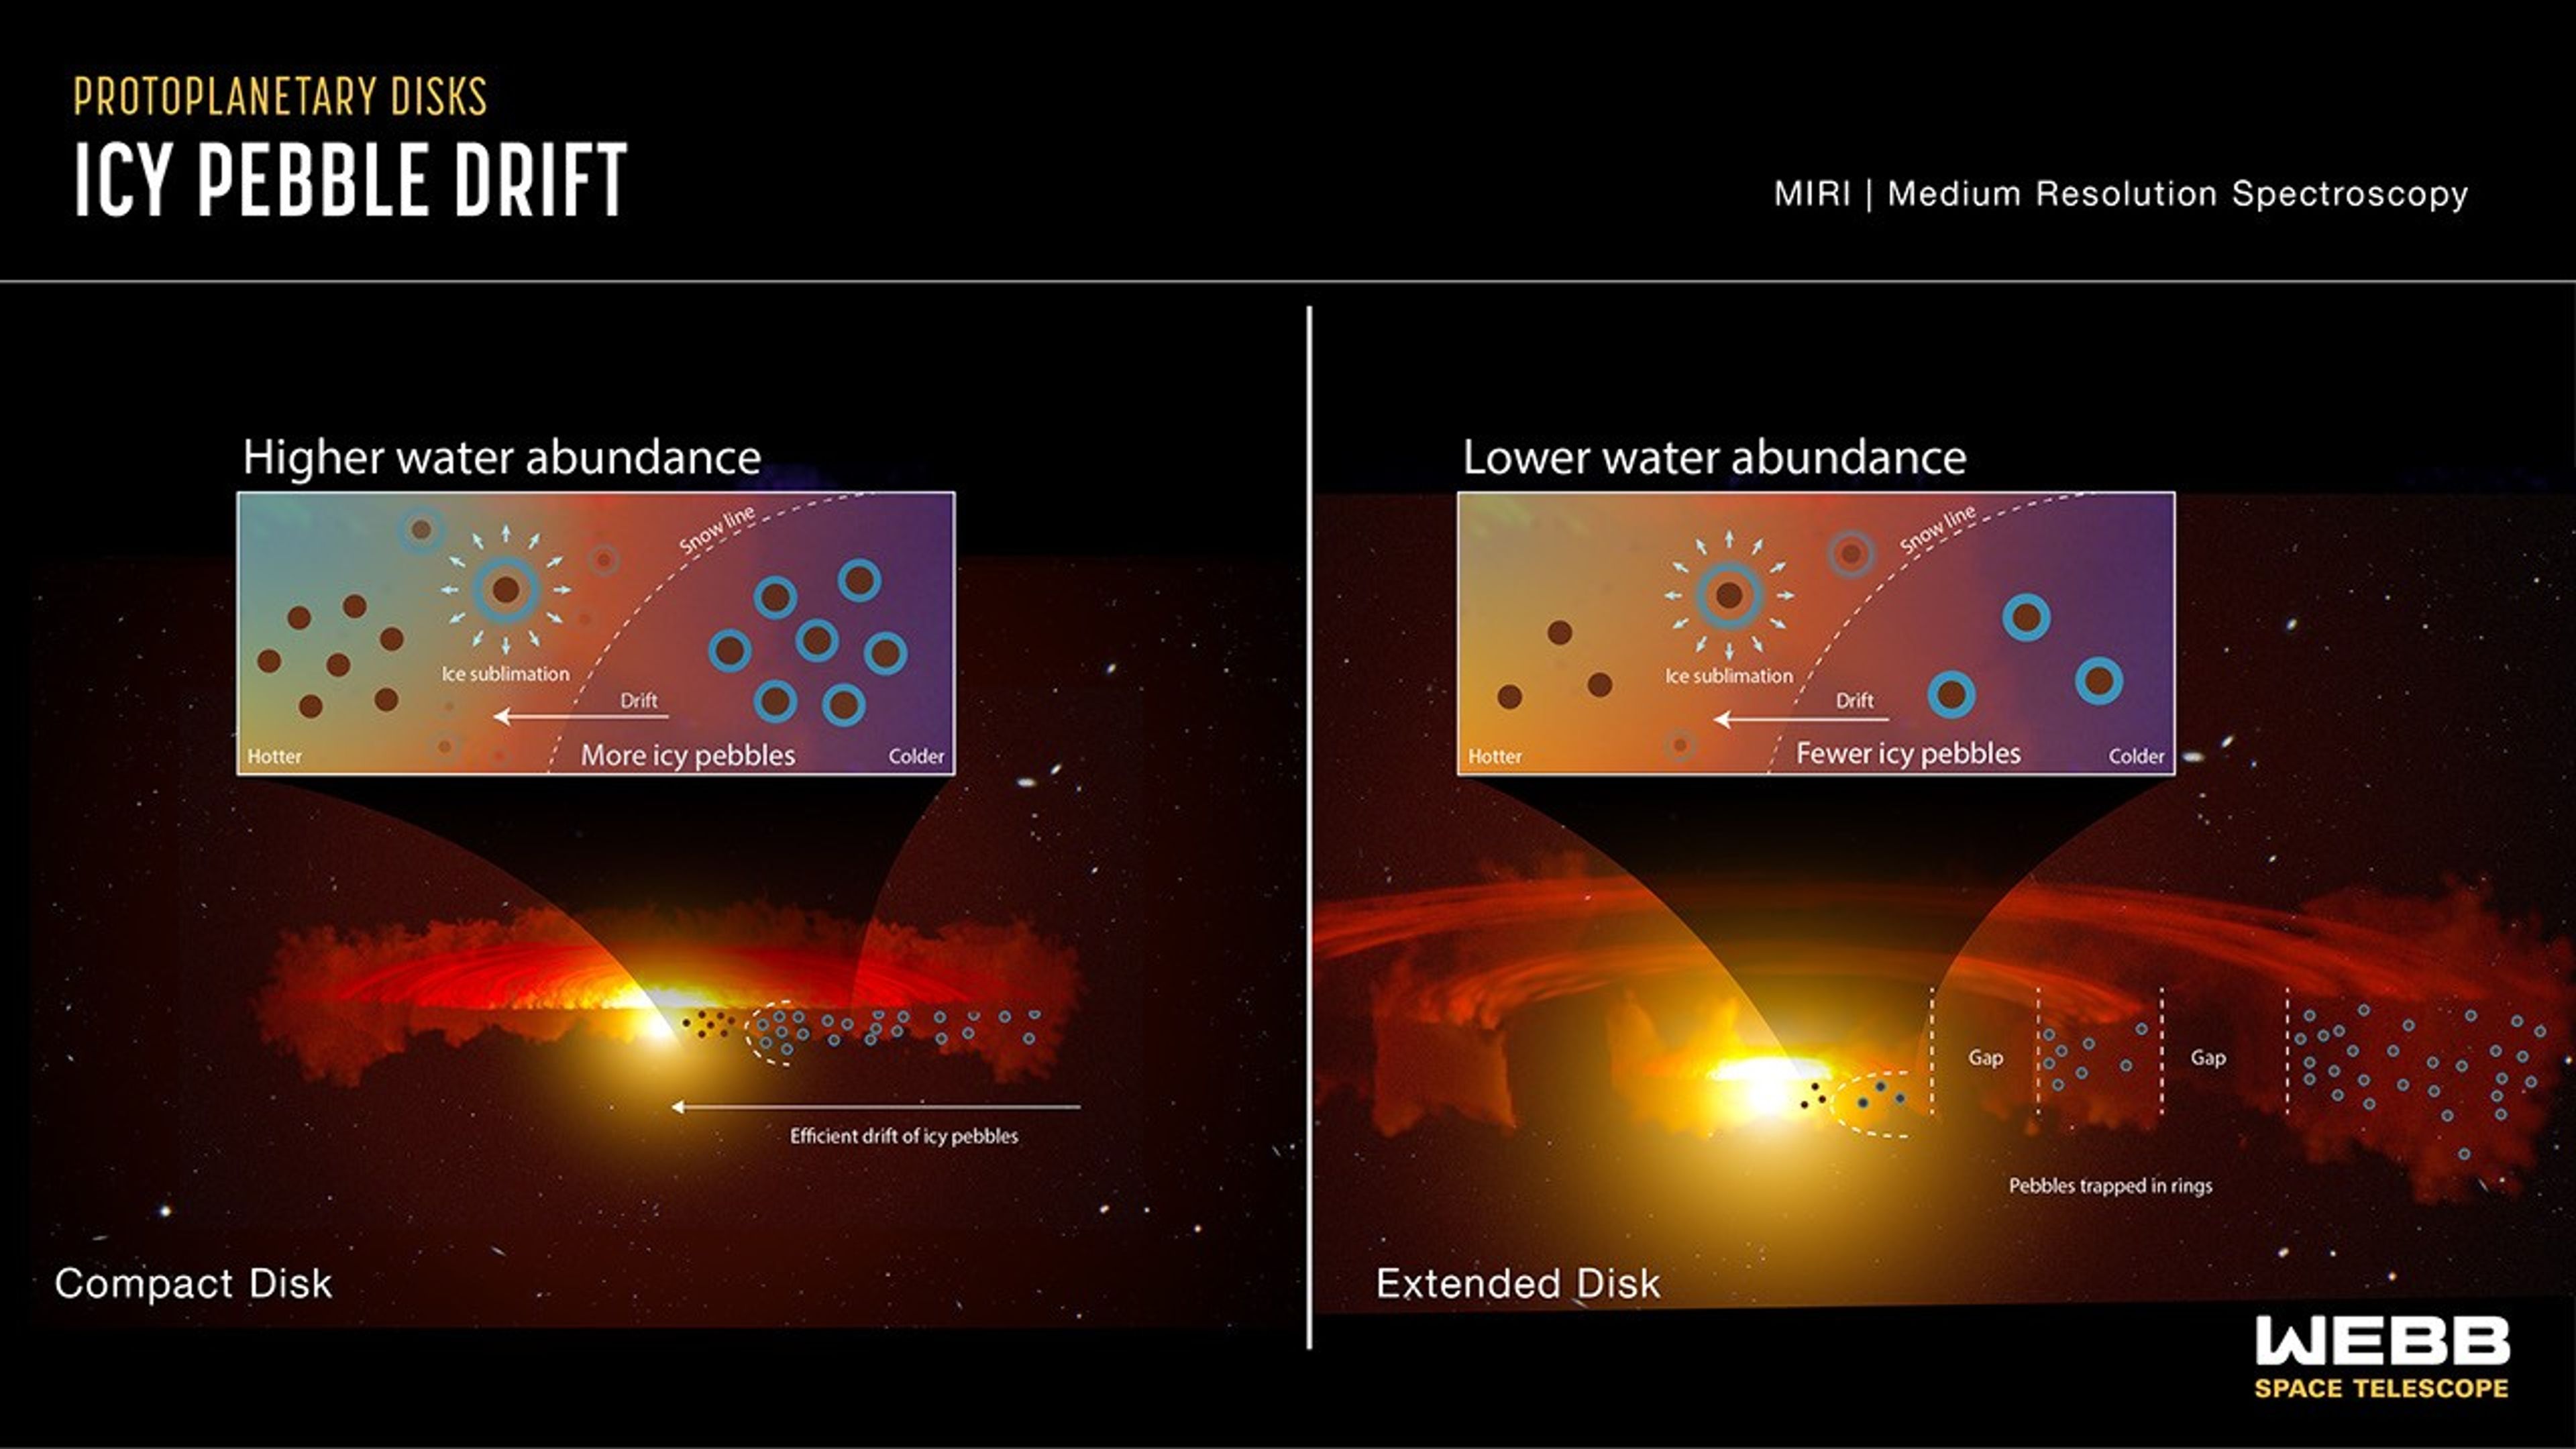
Pebble Drift Infographic
This graphic is an interpretation of data from Webb’s MIRI , the Mid-Infrared Instrument, which is sensitive to water vapor in disks. It shows the difference between pebble drift and water content in a compact disk versus an extended disk with rings and gaps. In the compact disk...
Share
Details
Laura Betz
NASA’s Goddard Space Flight Center
Greenbelt, Maryland
laura.e.betz@nasa.gov
NASA, ESA, CSA, Leah Hustak (STScI)
Andrea Banzatti (Texas State University)


