Due to the lapse in federal government funding, NASA is not updating this website.

Suggested Searches

1 min read

Webb and Hubble Compared HUDF (NIRCam Image)

A comparison between two images, one on the left and one on the right separated by a white line. The image on the left has a caption on the bottom that says, “Hubble UDF (exposure time: 11.3 days)”, while the image on the right has a caption on the bottom that says “Webb (exposure time: 0.83 days)”. The image on the left shows thousands of galaxies with many different colors. Most are orange and yellow while others are white and blue. Many of these galaxies appear as fuzzy ovals, but others look thin and long or have distinct spiral arms. Within the image is a yellow box, angled about 30 degrees off center, which contains a label on its bottom right that says “Webb’s field of view”. The image on the right shows a box with the same angle. Inside this box are many of the same galaxies seen in the box on the left in different colors. The orange galaxies on the left image are white or yellow on the right. There are a few galaxies spread throughout the right image that are clearer than those on the left.

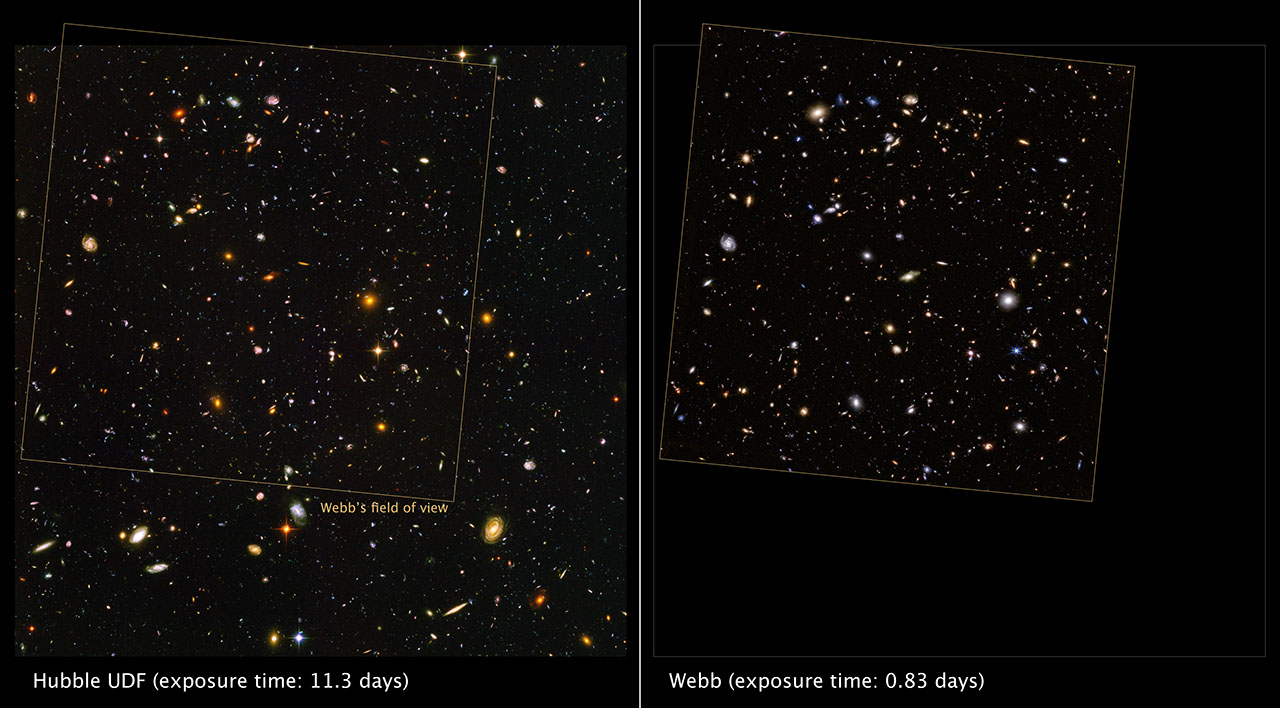
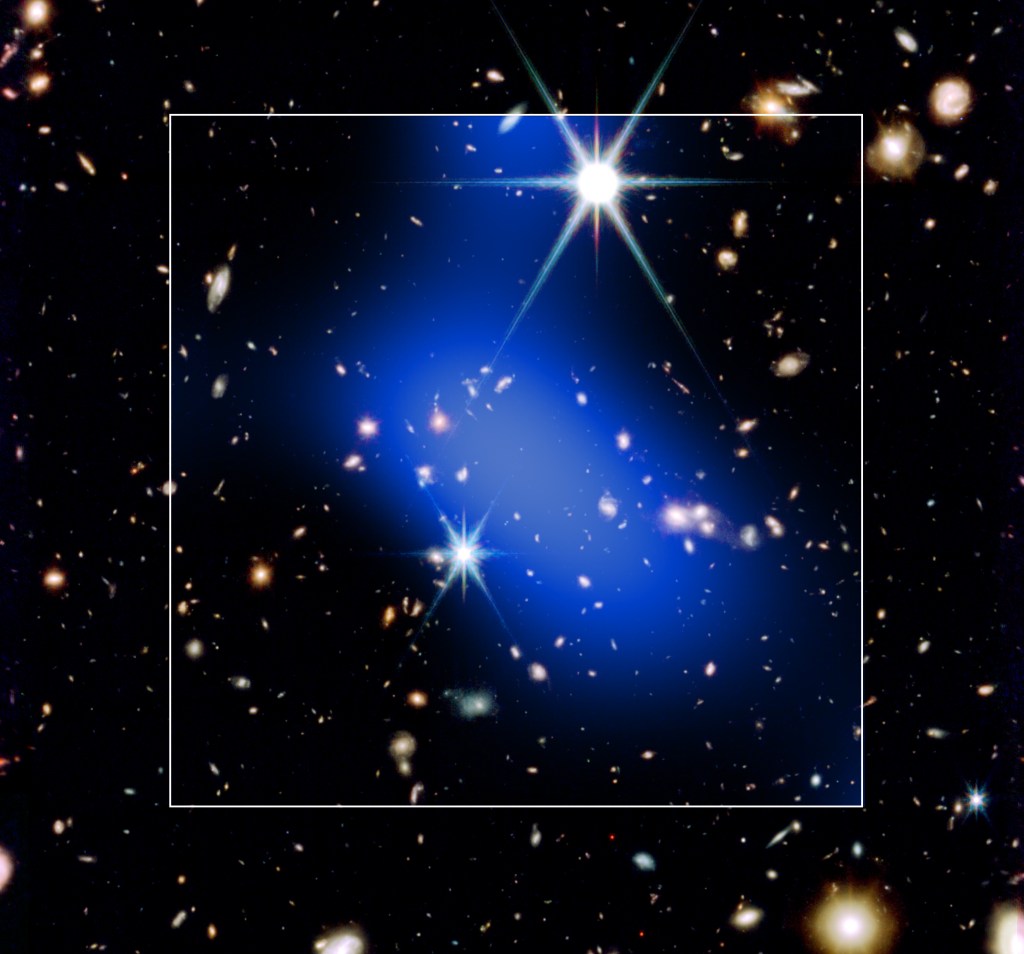
The capabilities of NASA’s James Webb Space Telescope’s Near-Infrared Camera are on full display in this comparison between Hubble’s and Webb’s observation of the Hubble Ultra Deep Field. The left, which demonstrates Hubble’s observation with its Wide Field Camera 3, required an exposure time of 11.3 days, while the right only took 0.83 days. Several areas within the Webb image reveal previously invisible, red galaxies.

Read the story.

About the Object

  • R.A. Position
    R.A. PositionRight ascension – analogous to longitude – is one component of an object's position.
    03:32:39.99
  • Dec. Position
    Dec. PositionDeclination – analogous to latitude – is one component of an object's position.
    -27:47:00.00
  • Constellation
    ConstellationOne of 88 recognized regions of the celestial sphere in which the object appears.
    Fornax

About the Data

  • Data Description
    Data DescriptionProposal: A description of the observations, their scientific justification, and the links to the data available in the science archive.
    Science Team: The astronomers who planned the observations and analyzed the data. "PI" refers to the Principal Investigator.

    This image was created with Webb data from proposal: 1963 (C. Williams).

  • Instrument
    InstrumentThe science instrument used to produce the data.
    MIRI
  • Exposure Dates
    Exposure DatesThe date(s) that the telescope made its observations and the total exposure time.
    October 11, 2022
  • Filters
    FiltersThe camera filters that were used in the science observations.
    F182M, F210M, F430M, F460M, F480M
  • Object Name
    Object NameA name or catalog number that astronomers use to identify an astronomical object.
    HUDF, Hubble Ultra Deep Field
  • Release Date
    April 12, 2023
  • Credit
    NASA, ESA, CSA, STScI, Christina Williams (NSF's NOIRLab), Sandro Tacchella (Cambridge), Michael Maseda (UW-Madison); Image Processing: Joseph DePasquale (STScI)

Downloads

  • Full Res (For Display), 12976 × 7181
    png (113.04 MB)
  • Full Res (For Print), 12976 × 7181
    tif (161.4 MB)
  • 2000 × 1107
    png (2.28 MB)
A comparison between two images, one on the left and one on the right separated by a white line. The image on the left has a caption on the bottom that says, “Hubble UDF (exposure time: 11.3 days)”, while the image on the right has a caption on the bottom that says “Webb (exposure time: 0.83 days)”. The image on the left shows thousands of galaxies with many different colors. Most are orange and yellow while others are white and blue. Many of these galaxies appear as fuzzy ovals, but others look thin and long or have distinct spiral arms. Within the image is a yellow box, angled about 30 degrees off center, which contains a label on its bottom right that says “Webb’s field of view”. The image on the right shows a box with the same angle. Inside this box are many of the same galaxies seen in the box on the left in different colors. The orange galaxies on the left image are white or yellow on the right. There are a few galaxies spread throughout the right image that are clearer than those on the left.
Color Info
Color InfoA brief description of the methods used to convert telescope data into the color image being presented.

These images are a composite of separate exposures acquired by the James Webb Space Telescope using the MIRI instrument. Several filters were used to sample wide wavelength ranges. The color results from assigning different hues (colors) to each monochromatic (grayscale) image associated with an individual filter. In this case, the assigned colors are: Blue: F182M, Cyan: F210M, Green: F430M, Orange: F460M, Red: F480M

Share

Details

Last Updated
Aug 28, 2025
Contact
Media

Laura Betz
NASA’s Goddard Space Flight Center
Greenbelt, Maryland
laura.e.betz@nasa.gov

Science Credit

NASA, ESA, CSA, STScI, Christina Williams (NSF’s NOIRLab), Sandro Tacchella (Cambridge), Michael Maseda (UW-Madison)

Image Processing Credit

Joseph DePasquale (STScI)