


1 min read
Webb’s First Deep Field (NIRSpec MSA Emission Spectra)
NASA’s Webb Telescope has yet another discovery machine aboard – the Near-Infrared Spectrograph’s (NIRSpec’s) microshutter array. This instrument has more than 248,000 tiny doors that can be individually opened to gather spectra (light) of up to approximately 150 individual objects simultaneously.
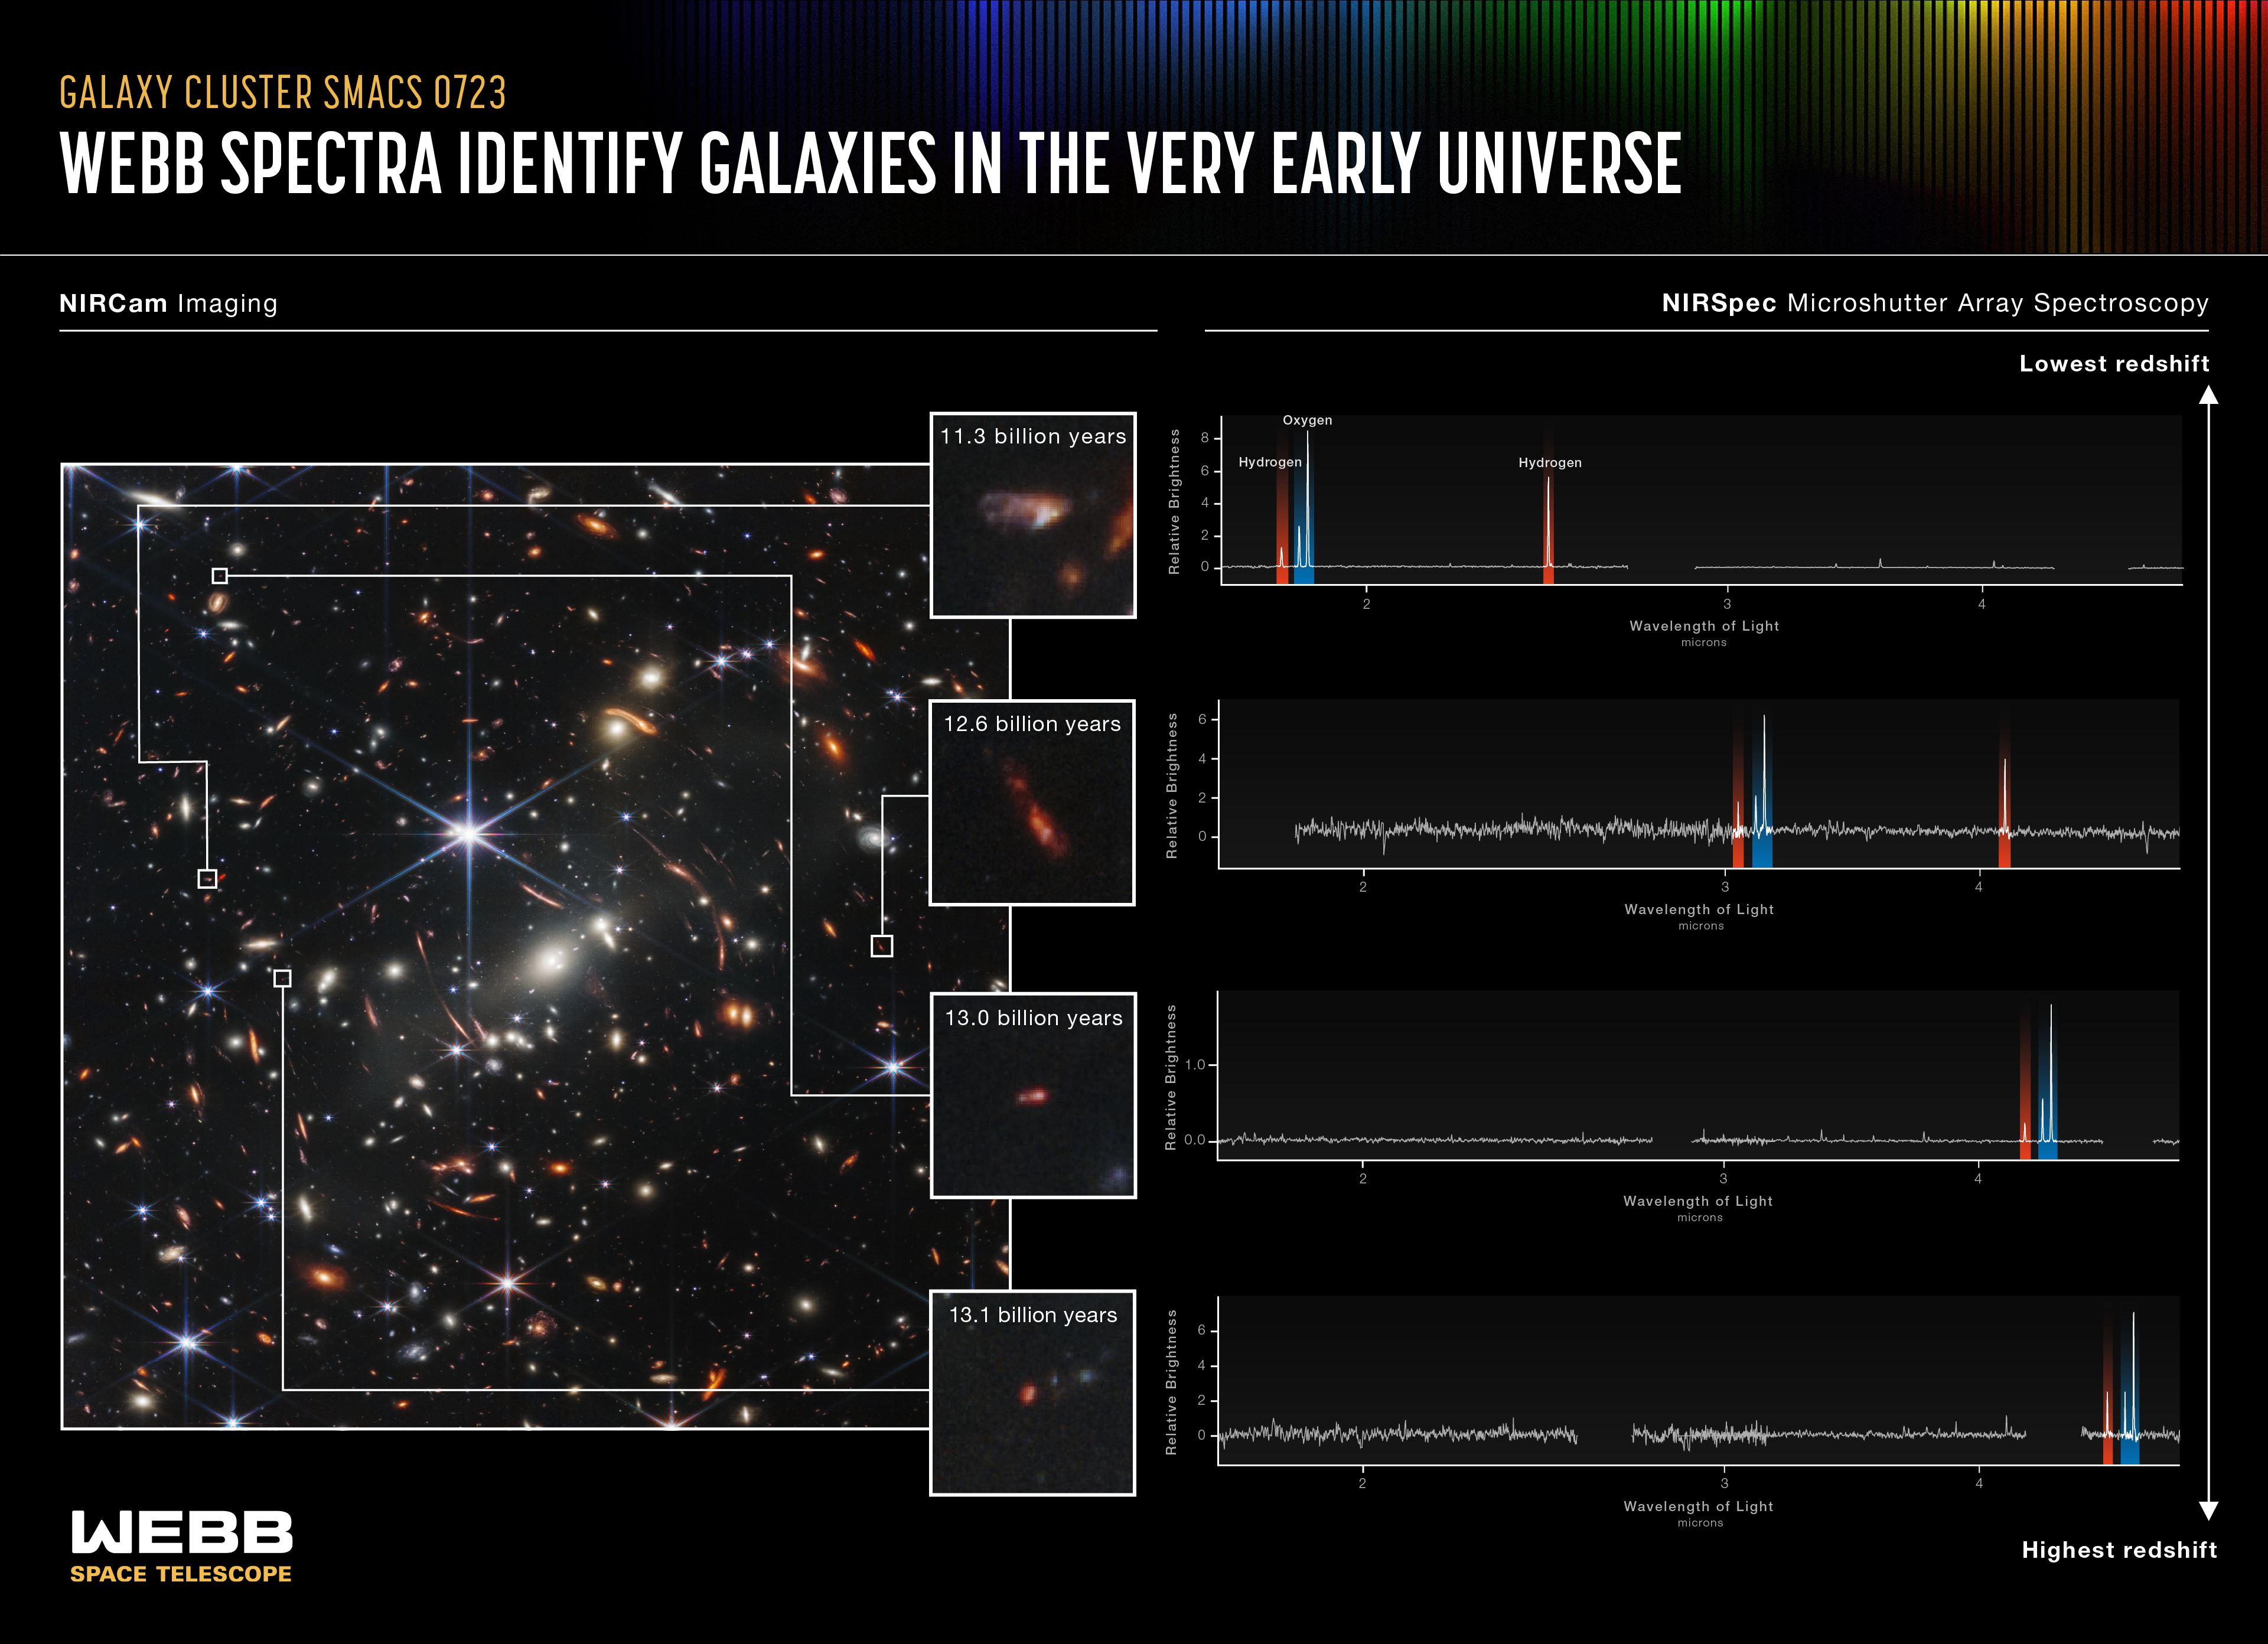
Of the thousands of distant galaxies behind galaxy cluster SMACS 0723, NIRSpec observed 48 individually – all at the same time – in a field that is approximately the size of a grain of sand held at arm’s length. Quick analysis made it immediately clear that several of these galaxies were observed as they existed at very early periods in the history of the universe, which is estimated to be 13.8 billion years old.
Look for the same feature highlighted in each spectrum. Three lines appear in the same order every time – one hydrogen line followed by two ionized oxygen lines. Where this pattern falls on each spectrum tells researchers the redshift of individual galaxies, revealing how long ago their light was emitted.
Light from the farthest galaxy shown traveled 13.1 billion years before Webb’s mirrors captured it. These observations mark the first time these particular emission lines have been seen at such immense distances – and these are only Webb’s initial observations. There may be even more distant galaxies in this image!
In these spectra, Webb has also shown us the chemical composition of galaxies in the very early universe for the first time. This was made possible by the telescope’s position in space – far away from Earth’s atmosphere, which filters out some infrared light – and its specialization in gathering high-resolution near-infrared light.
And since similar spectra from galaxies at closer distances have long been studied by other space- and ground-based observatories, astronomers already know a lot about the properties of nearby galaxies. Now, astronomers will be able to study and compare spectra from Webb to determine how galaxies have changed over billions of years, dating back to the early universe.
With Webb’s data, researchers can now measure each galaxy’s distance, temperature, gas density, and chemical composition. We will soon learn an incredible amount about galaxies that existed all across cosmic time!
For a full array of Webb’s first images and spectra, including downloadable files, please visit: https://webbtelescope.org/news/first-images
NIRSpec was built for the European Space Agency (ESA) by a consortium of European companies led by Airbus Defence and Space (ADS) with NASA’s Goddard Space Flight Center providing its detector and micro-shutter subsystems.
Extended Description and Image Alt Text
Extended Description
An infographic titled “Galaxy Cluster SMACS 0723, Webb Spectra Identify Galaxies in the Very Early Universe; NIRCam Imaging and NIRSpec Microshutter Array Spectroscopy.”
Reference Image
At left is a NIRCam image of the field, which is filled with galaxies of all shapes and sizes.
Insert Images
At center, four galaxies from the larger NIRCam image are shown in a vertical column of small boxes connected to lines designating the galaxies’ locations in the larger image. From top to bottom, the inset galaxies are labeled 11.3 billion years, 12.6 billion years, 13.0 billion years, 13.1 billion years to indicate when the light that we are seeing from that galaxy was emitted. Each galaxy in the inset is blurry and has red areas.
Graphs
Along the right half of the graphic are four line graphs. They are evenly lined up with the inset galaxy graphics. These are labeled NIRSpec Microshutter Array Spectroscopy.
The graphs, and insert images, are ordered by redshift, with the lowest redshift at the top and the highest redshift at the bottom. At far right, a line with labels and arrows indicates this order.
Graph Axes
Each spectrum is plotted as a line graph. The graphs show relative brightness on the y-axis, which has points for 0, 2, 4, and 6. There are no units for relative brightness. Wavelength in microns is shown on the x-axis, which has labels for 2, 3, and 4 microns. Wavelength is plotted on a log scale.
Graph Data
Both graphs show jagged lines, plotting the brightness of the galaxy at each wavelength. The overall shape of the line is flat with a few prominent spike-like peaks. Some peaks are taller than others.
Shaded areas of color mark the appearance of hydrogen and oxygen on each galaxy’s spectrum. Hydrogen is highlighted in red and oxygen is highlighted in blue.
- Light emitted from a galaxy 11.3 billion years ago: A pair of emission lines for hydrogen and oxygen are located between the origin and the 2-micron tick, and another hydrogen line is located between the 2- and 3-micron tick marks.
- Light emitted from a galaxy 12.6 billion years ago: The pair of hydrogen and oxygen lines are shifted toward longer wavelengths, now located just after the 3 micron mark, and the other hydrogen line is now located after the 4-micron mark.
- Light emitted from a galaxy 13.0 billion years ago: The pair of hydrogen and oxygen lines are shifted toward even longer wavelengths and are now located just after the 4-micron mark. The other hydrogen line is no longer on the graph.
- Light emitted from a galaxy 13.1 billion years ago: The pair of hydrogen and oxygen lines are now shifted almost to the right end of the graph.
Image Alt Text
Infographic of the spectra of four distant galaxies, showing the shift of the location of emission lines and the relationship between shift and time since the light was emitted, with images for reference.
About the Object
- ConstellationConstellationOne of 88 recognized regions of the celestial sphere in which the object appears.Volans
- DistanceDistanceThe physical distance from Earth to the astronomical object. Distances within our solar system are usually measured in Astronomical Units (AU). Distances between stars are usually measured in light-years. Interstellar distances can also be measured in parsecs.In order from top to bottom, the four highlighted galaxies are at redshifts of 2.74, 5.27, 7.65 and 8.49.
About the Data
- Data DescriptionData DescriptionProposal: A description of the observations, their scientific justification, and the links to the data available in the science archive.
Science Team: The astronomers who planned the observations and analyzed the data. "PI" refers to the Principal Investigator.This image was created with Webb data from proposal 2736. It is part of Webb Early Release Observations.
The Early Release Observations and associated materials were developed, executed, and compiled by the ERO production team:
Jaclyn Barrientes, Claire Blome, Hannah Braun, Matthew Brown, Margaret Carruthers, Dan Coe, Joseph DePasquale, Nestor Espinoza, Macarena Garcia Marin, Karl Gordon, Alaina Henry, Leah Hustak, Andi James, Ann Jenkins, Anton Koekemoer, Stephanie LaMassa, David Law, Alexandra Lockwood, Amaya Moro-Martin, Susan Mullally, Alyssa Pagan, Dani Player, Klaus Pontoppidan, Charles Proffitt, Christine Pulliam, Leah Ramsay, Swara Ravindranath, Neill Reid, Massimo Robberto, Elena Sabbi, Leonardo Ubeda.
The EROs were also made possible by the foundational efforts and support from the JWST instruments, STScI planning and scheduling, Data Management teams, and Office of Public Outreach.
- InstrumentInstrumentThe science instrument used to produce the data.NIRCam, NIRSpec
- Release DateJuly 12, 2022
- Science ReleaseNASA’s Webb Delivers Deepest Infrared Image of Universe Yet
- CreditImage: NASA, ESA, CSA, STScI
Related Images & Videos

Webb's First Deep Field (NIRCam Image)
Thousands of galaxies flood this near-infrared image of galaxy cluster SMACS 0723. High-resolution imaging from NASA’s James Webb Space Telescope combined with a natural effect known as gravitational lensing made this finely detailed image possible. First, focus on the galaxies...
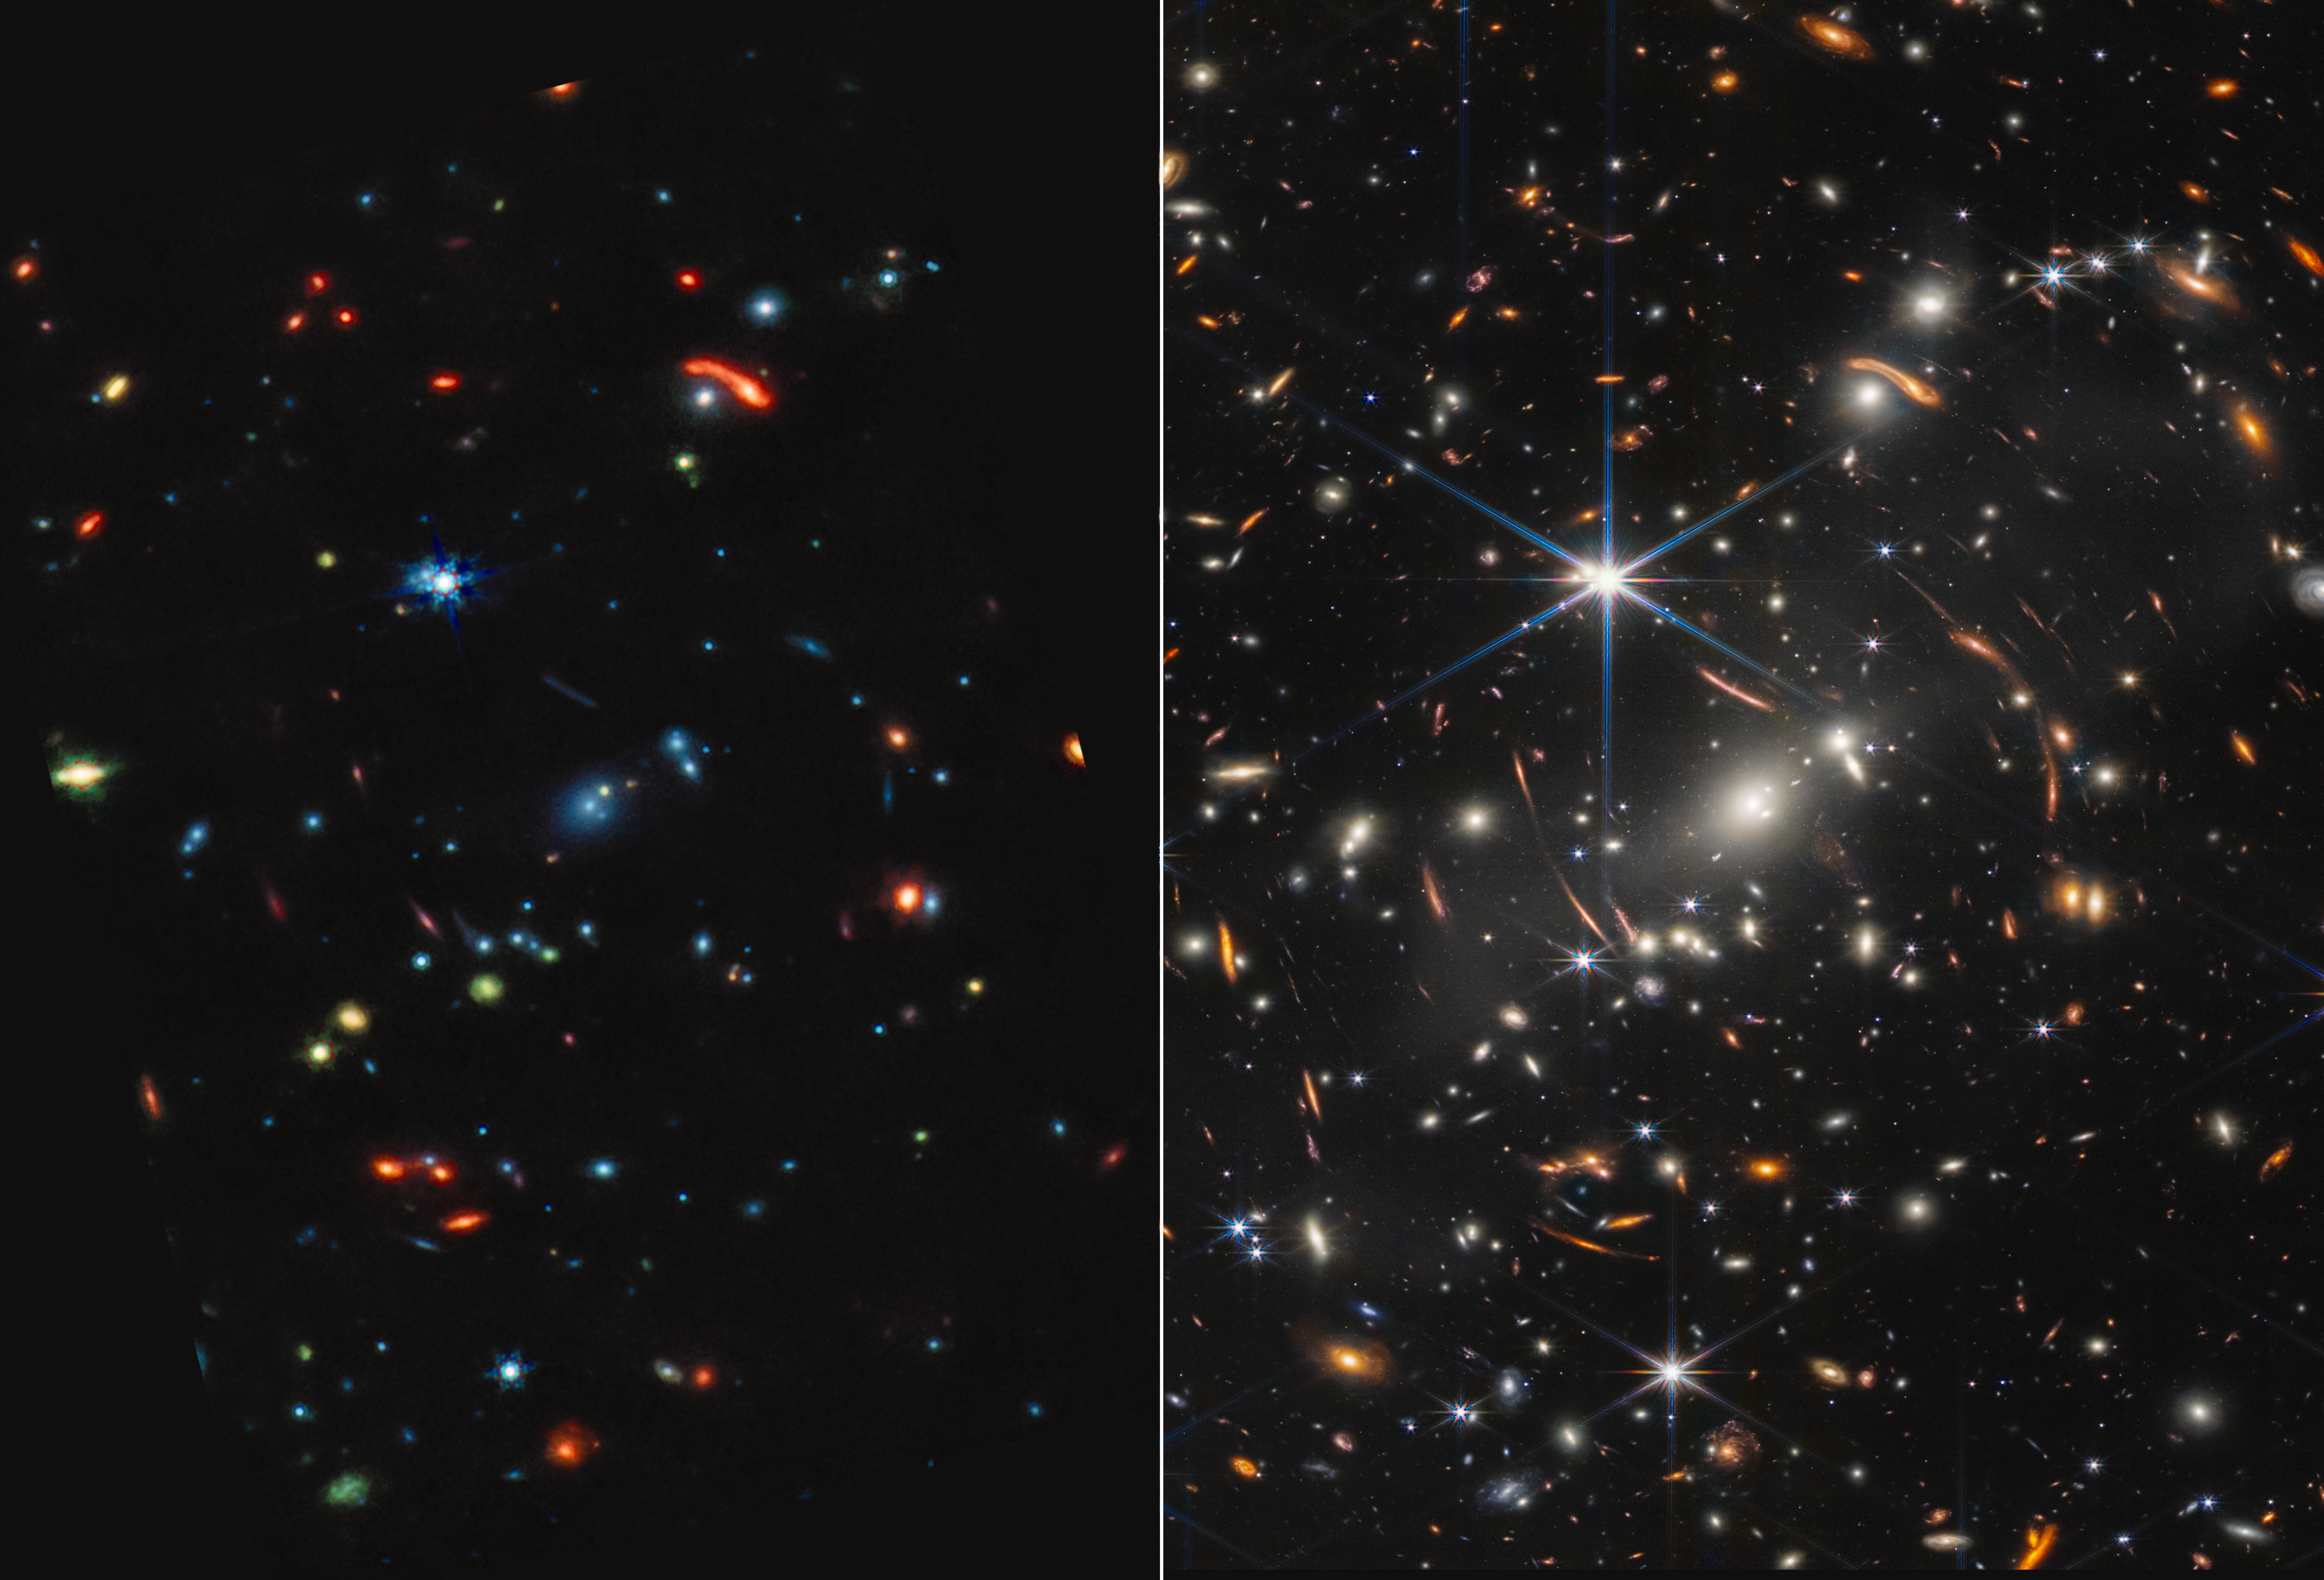
Webb’s First Deep Field (MIRI and NIRCam Images Side by Side)
Galaxy cluster SMACS 0723 is a technicolor landscape when viewed in mid-infrared light by NASA’s James Webb Space Telescope. Compared to Webb’s near-infrared image at right, the galaxies and stars are awash in new colors. Start by comparing the largest bright blue star. At...
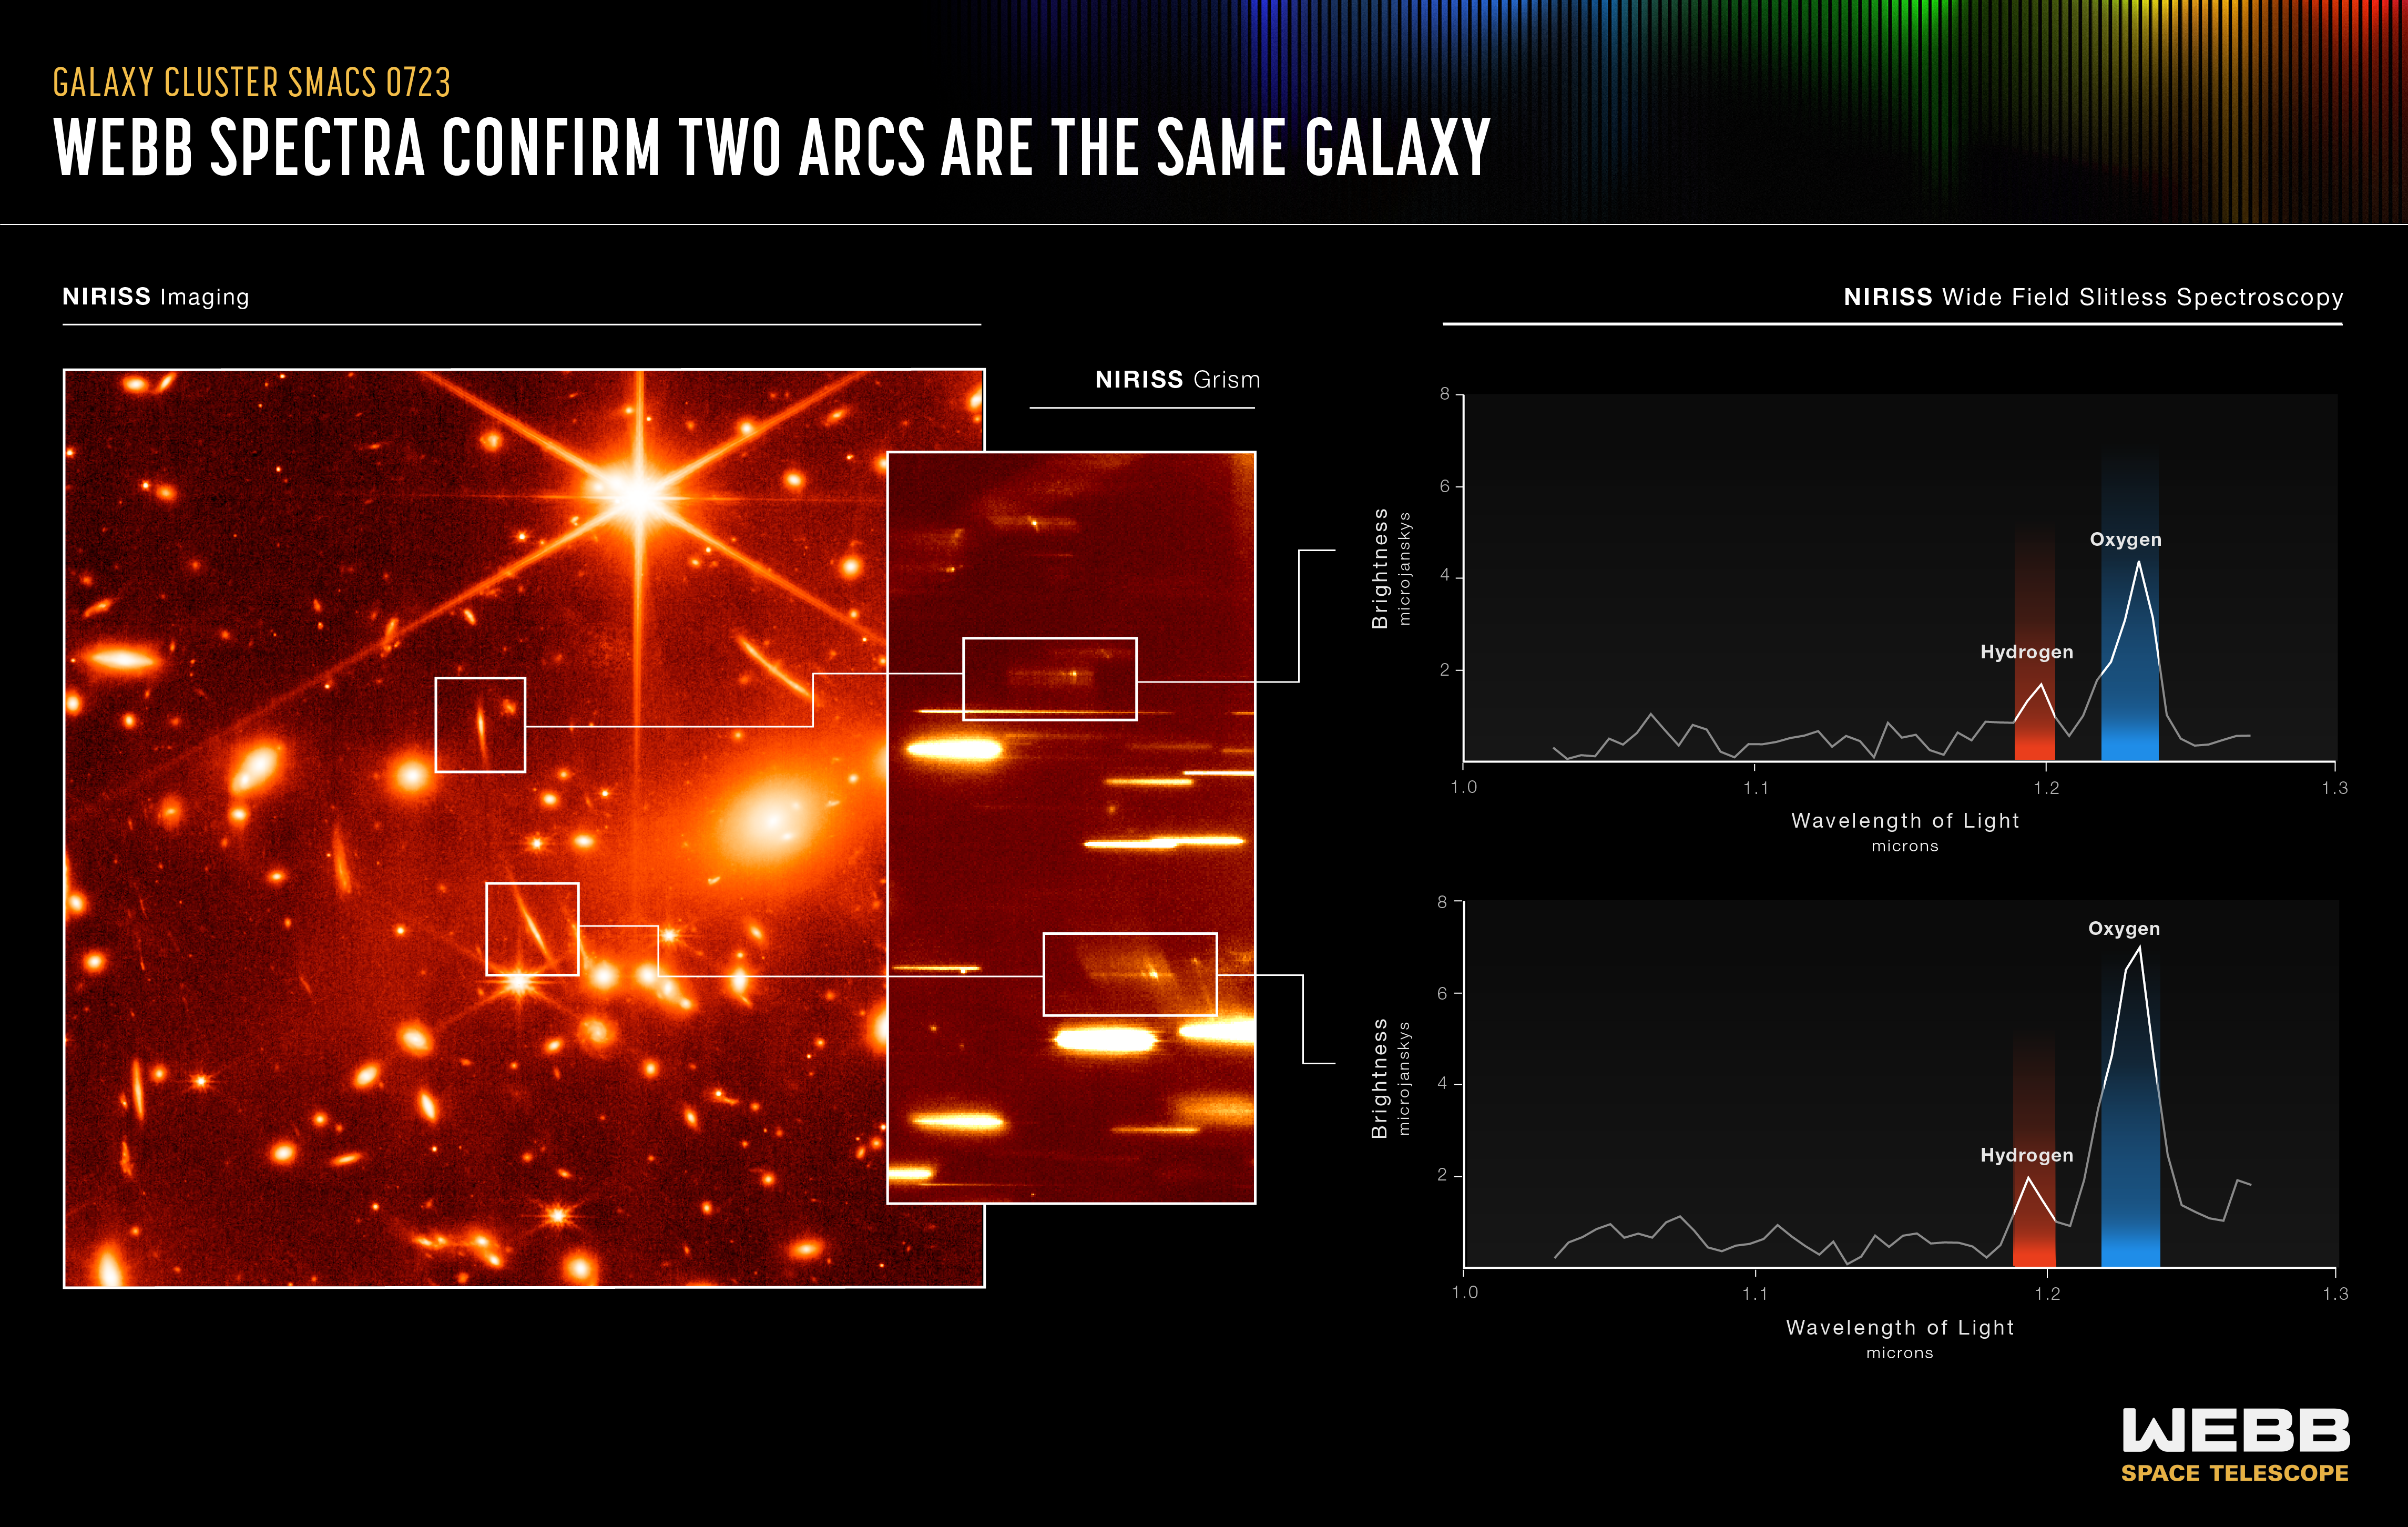
Webb's First Deep Field (NIRISS Emission Spectra)
Want to go on a galactic treasure hunt? Data known as spectra from NASA’s Webb Telescope make it easy to find – and match up – cosmic prizes! At far left is a near-infrared image of galaxy cluster SMACS 0723. A group of massive galaxies below and to the right of the bright...
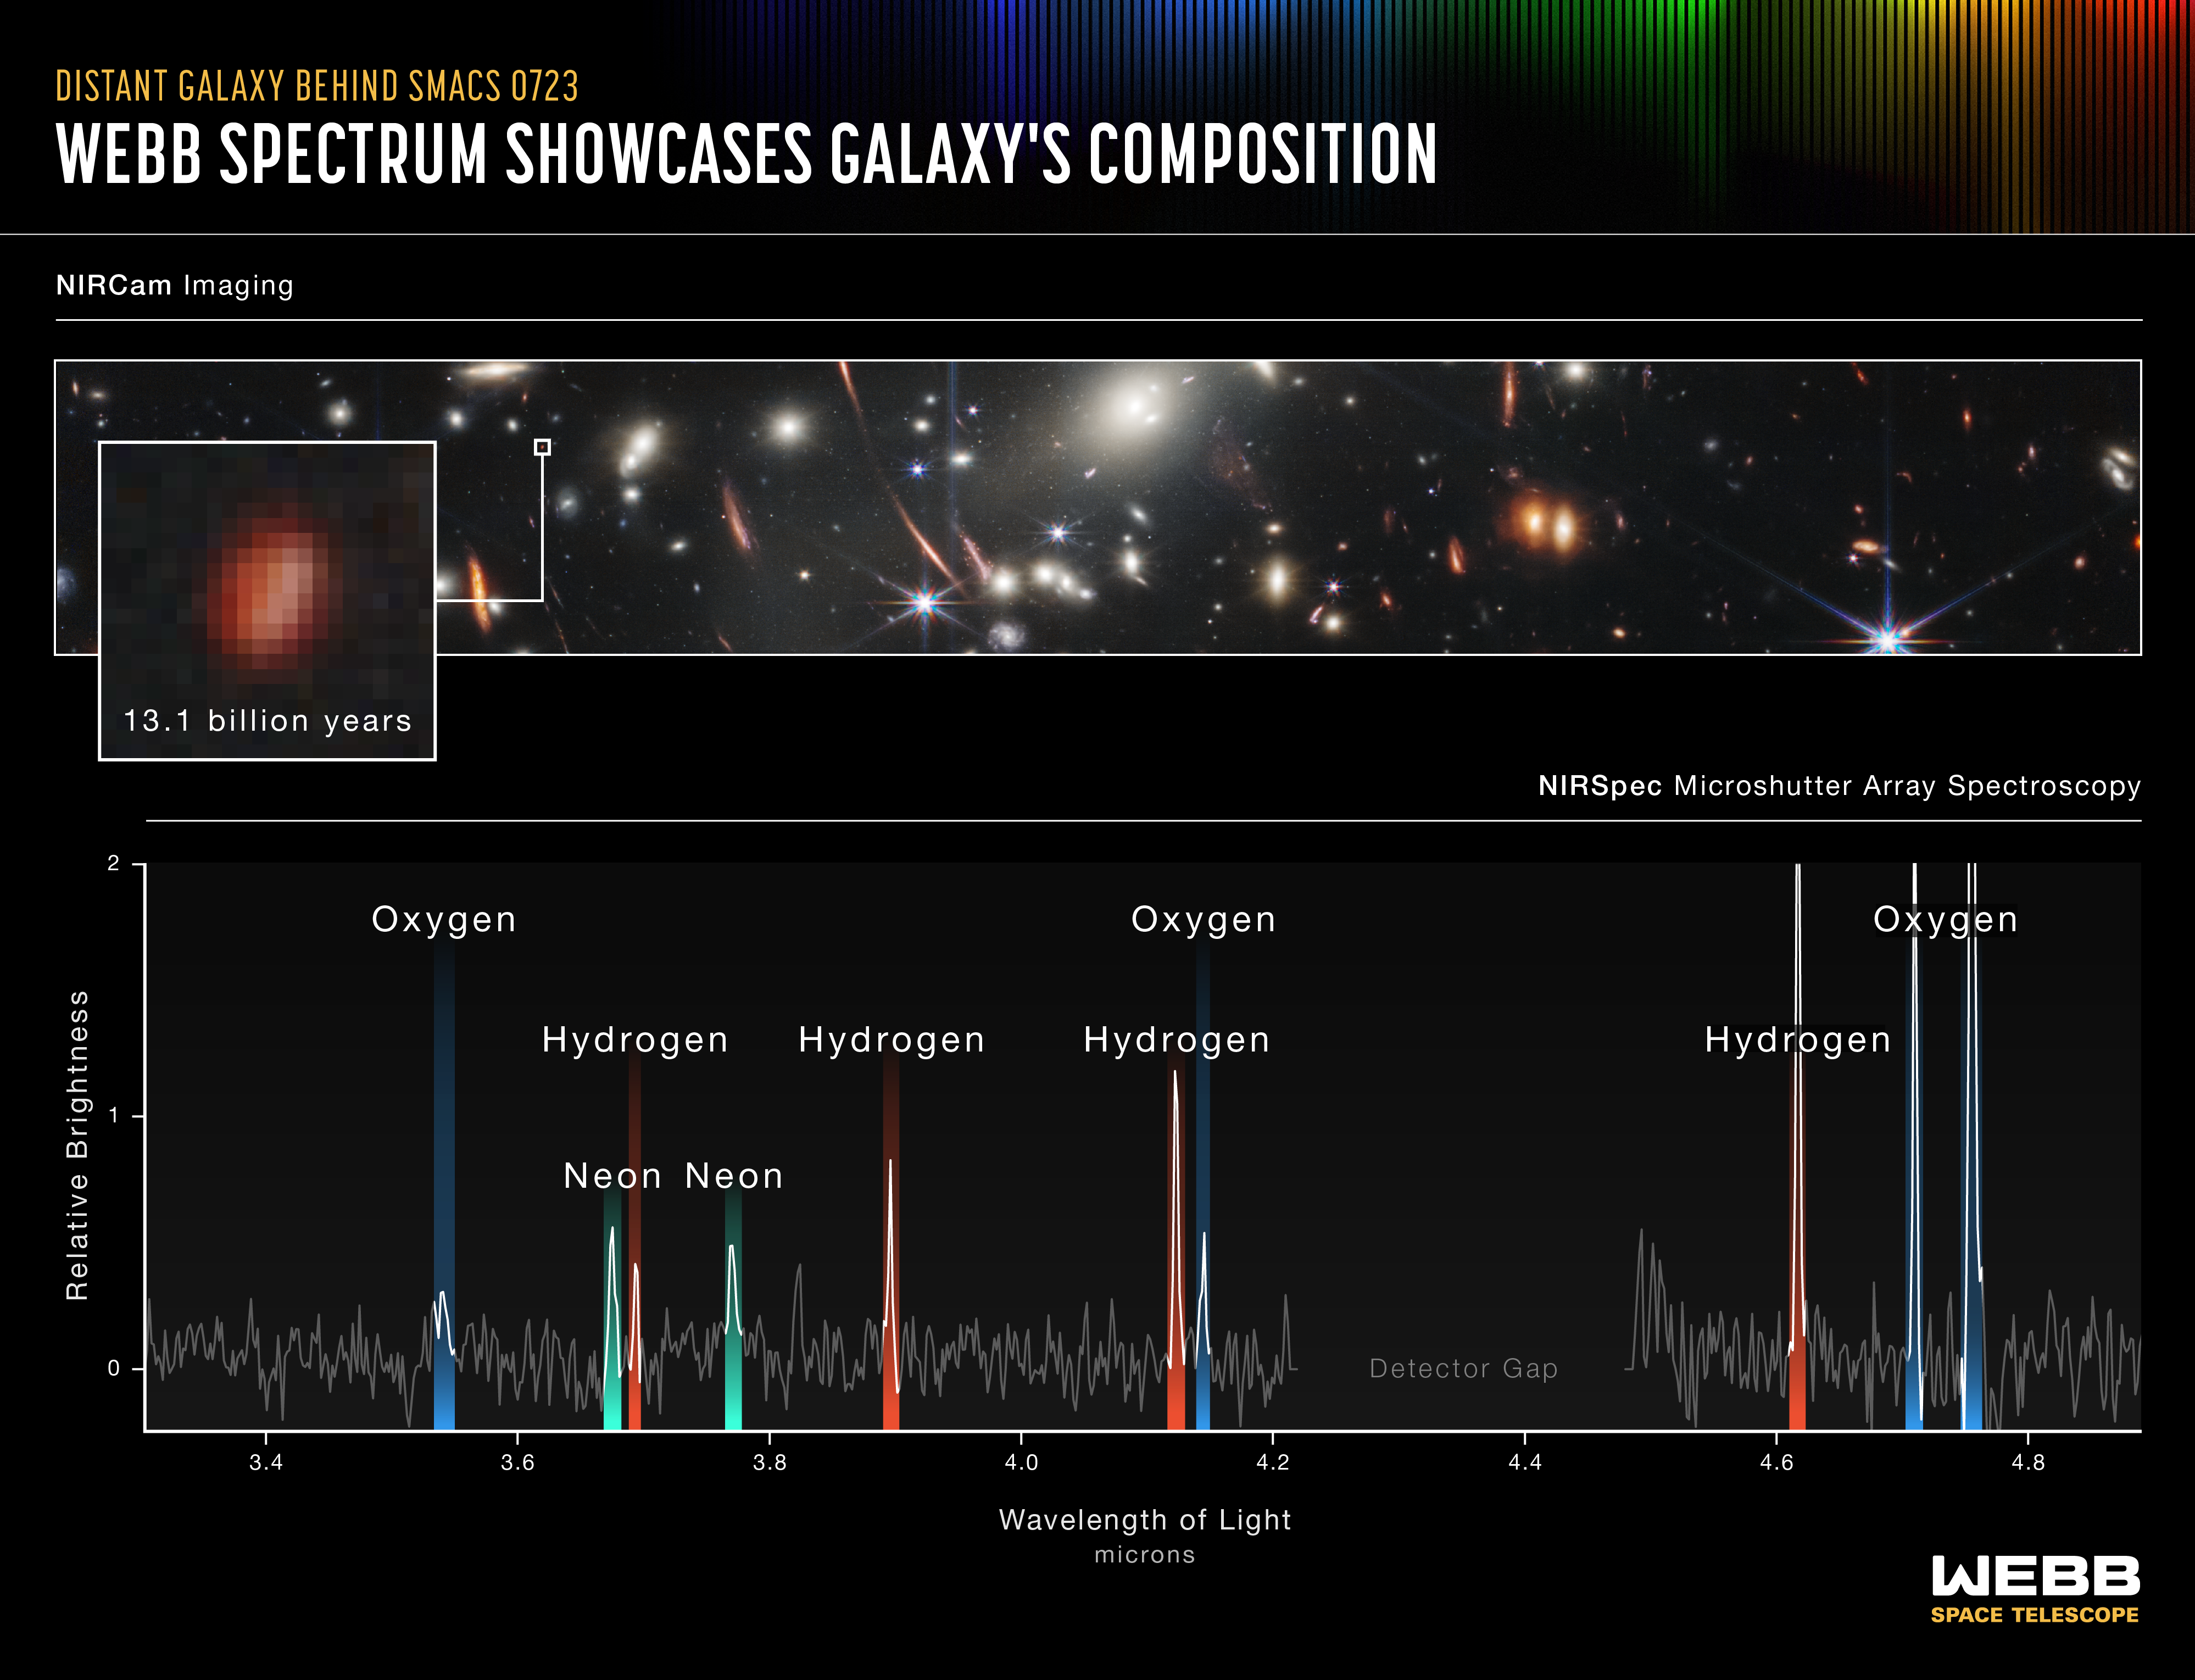
Webb's First Deep Field (NIRSpec Emission Spectrum)
This galaxy emitted its light 13.1 billion years ago. It was captured by Webb’s microshutter array , part of its Near-Infrared Spectrograph (NIRSpec). This instrument is so sensitive that it can observe the light of individual galaxies that existed in the very early universe....
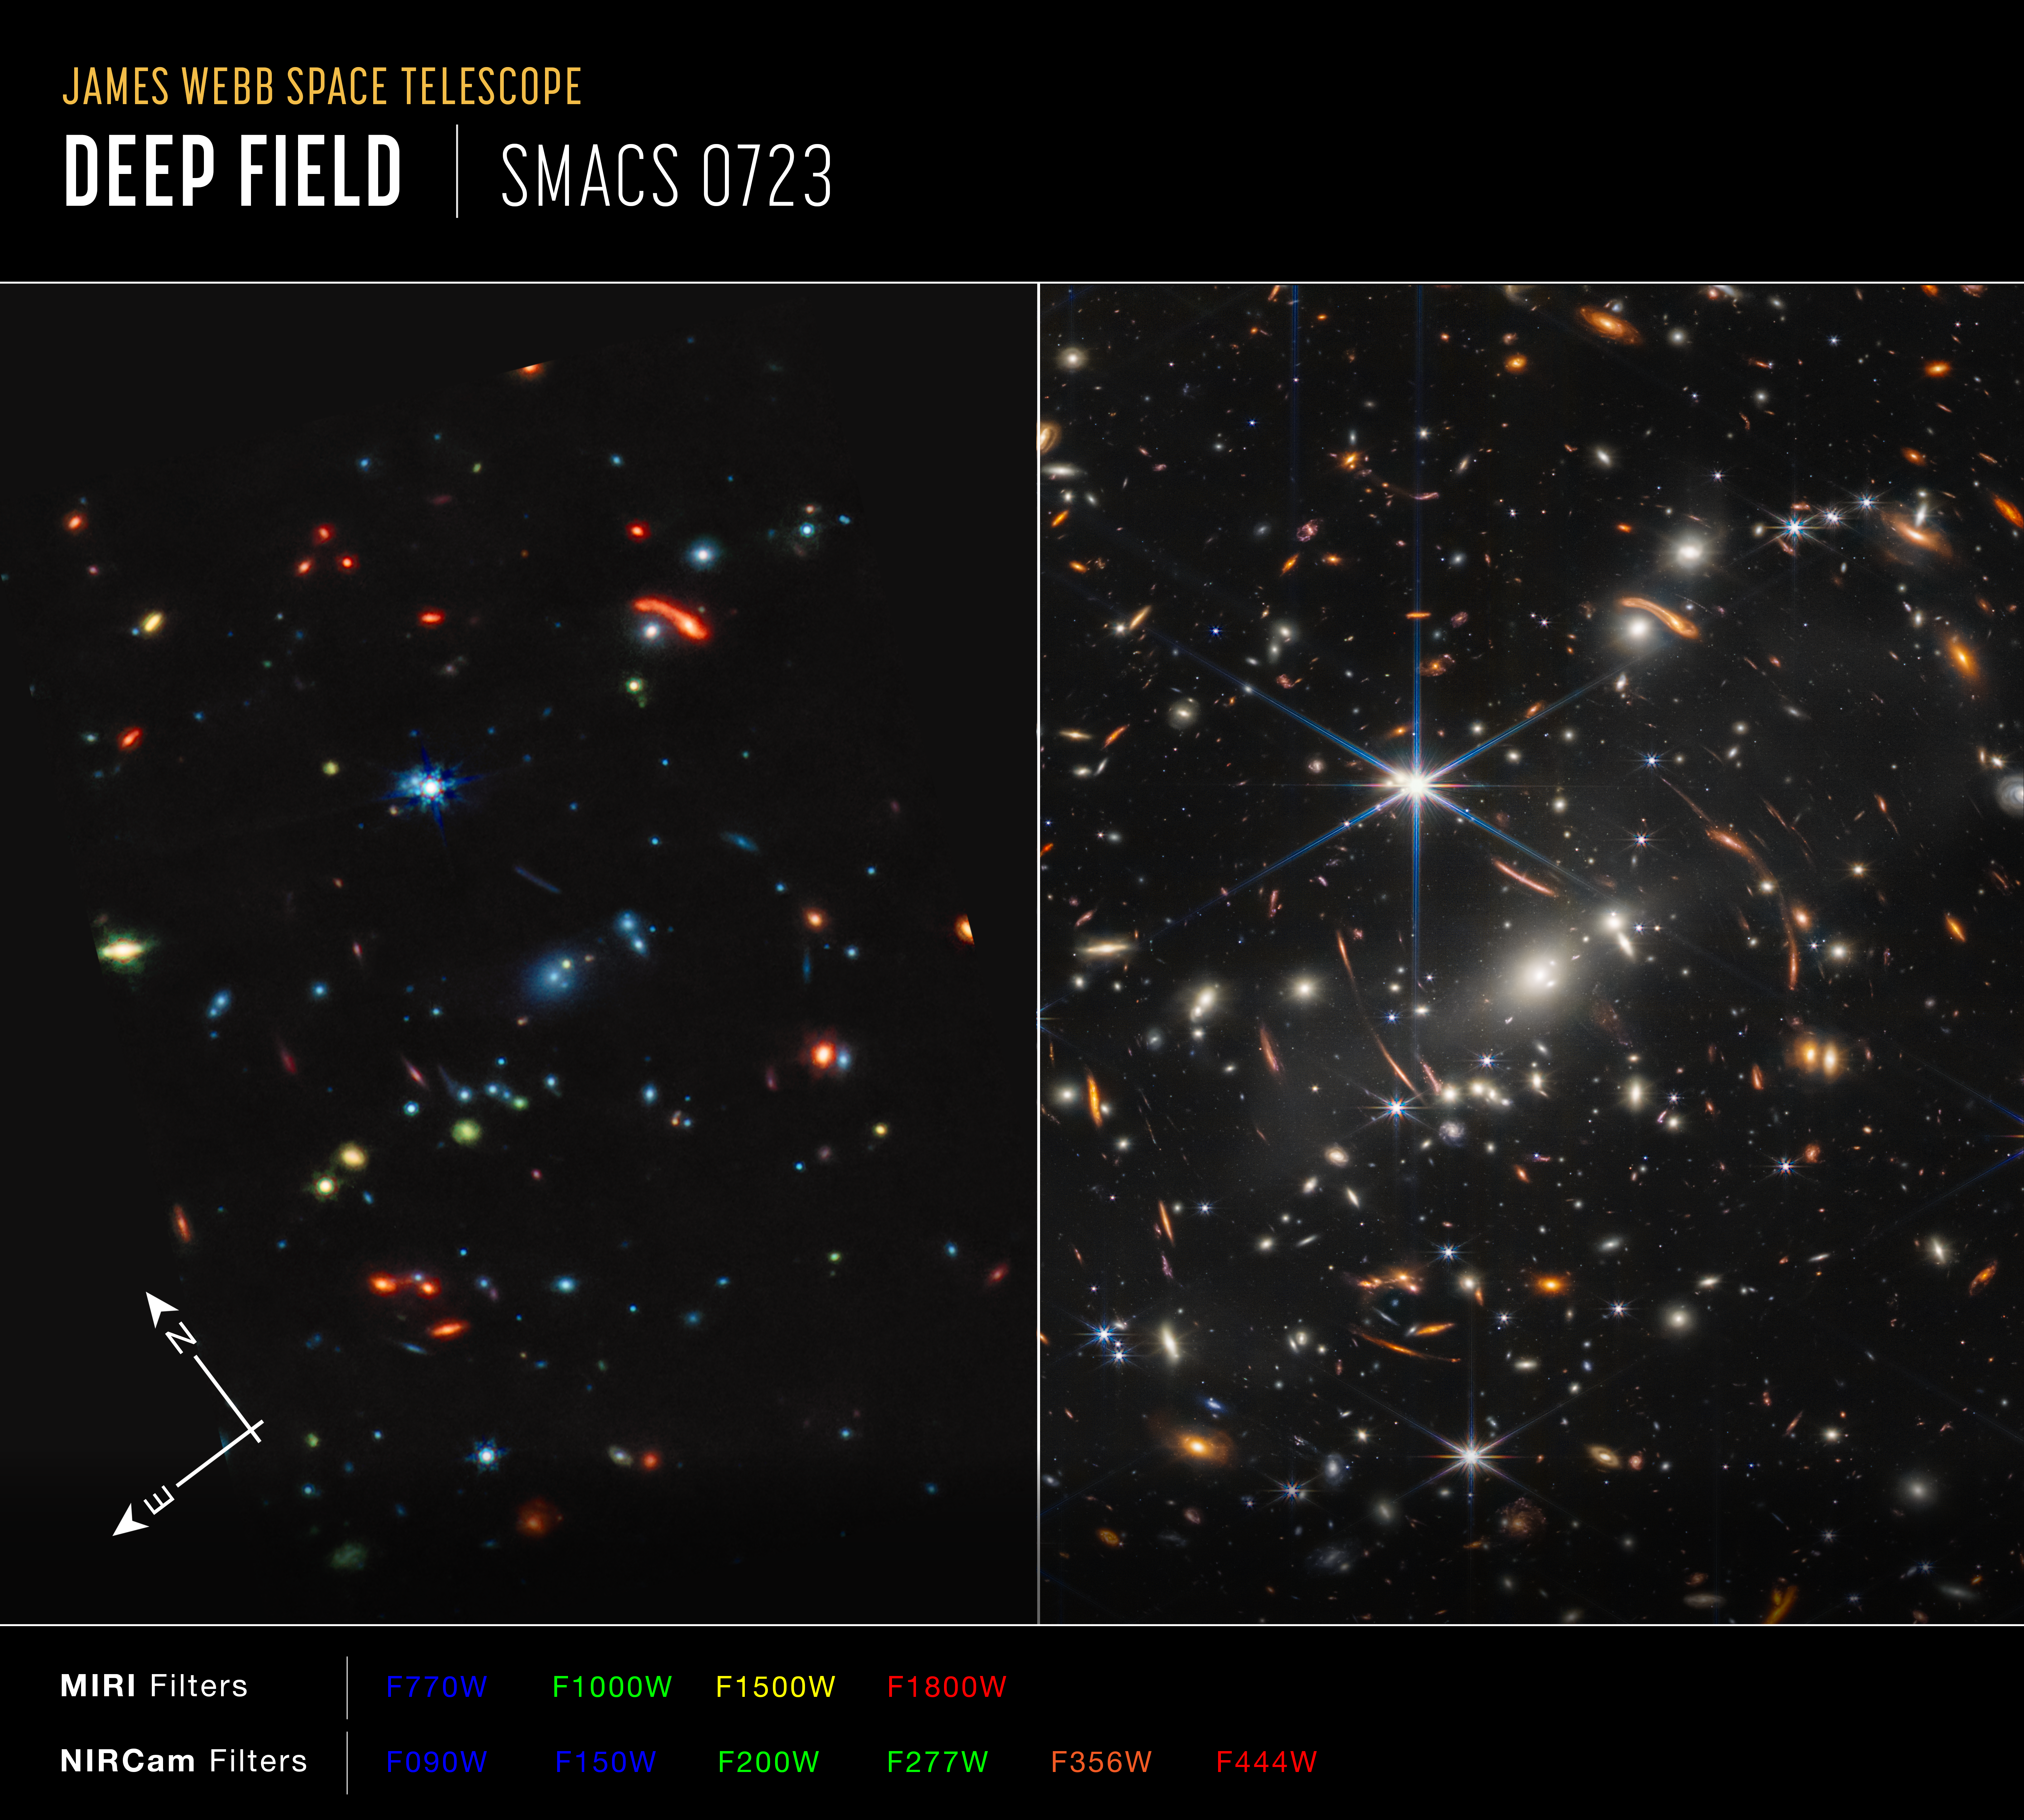
Webb's First Deep Field (MIRI and NIRCam Side-by-Side Compass Image)
Image of galaxy cluster SMACS 0723, affectionately known as Webb’s First Deep Field, captured by Webb’s Near-Infrared Camera (NIRCam) and Mid-Infrared Instrument (MIRI), with compass arrows and color key for reference. The north and east compass arrows show the orientation of...
Share
Details
Laura Betz
NASA’s Goddard Space Flight Center
Greenbelt, Maryland
laura.e.betz@nasa.gov
NASA, ESA, CSA, STScI


