


Ocean Physics at NASA
NASA's Ocean Physics program directs multiple competitively-selected NASA Science Teams that study the physics of the Ocean.
About Ocean Physics
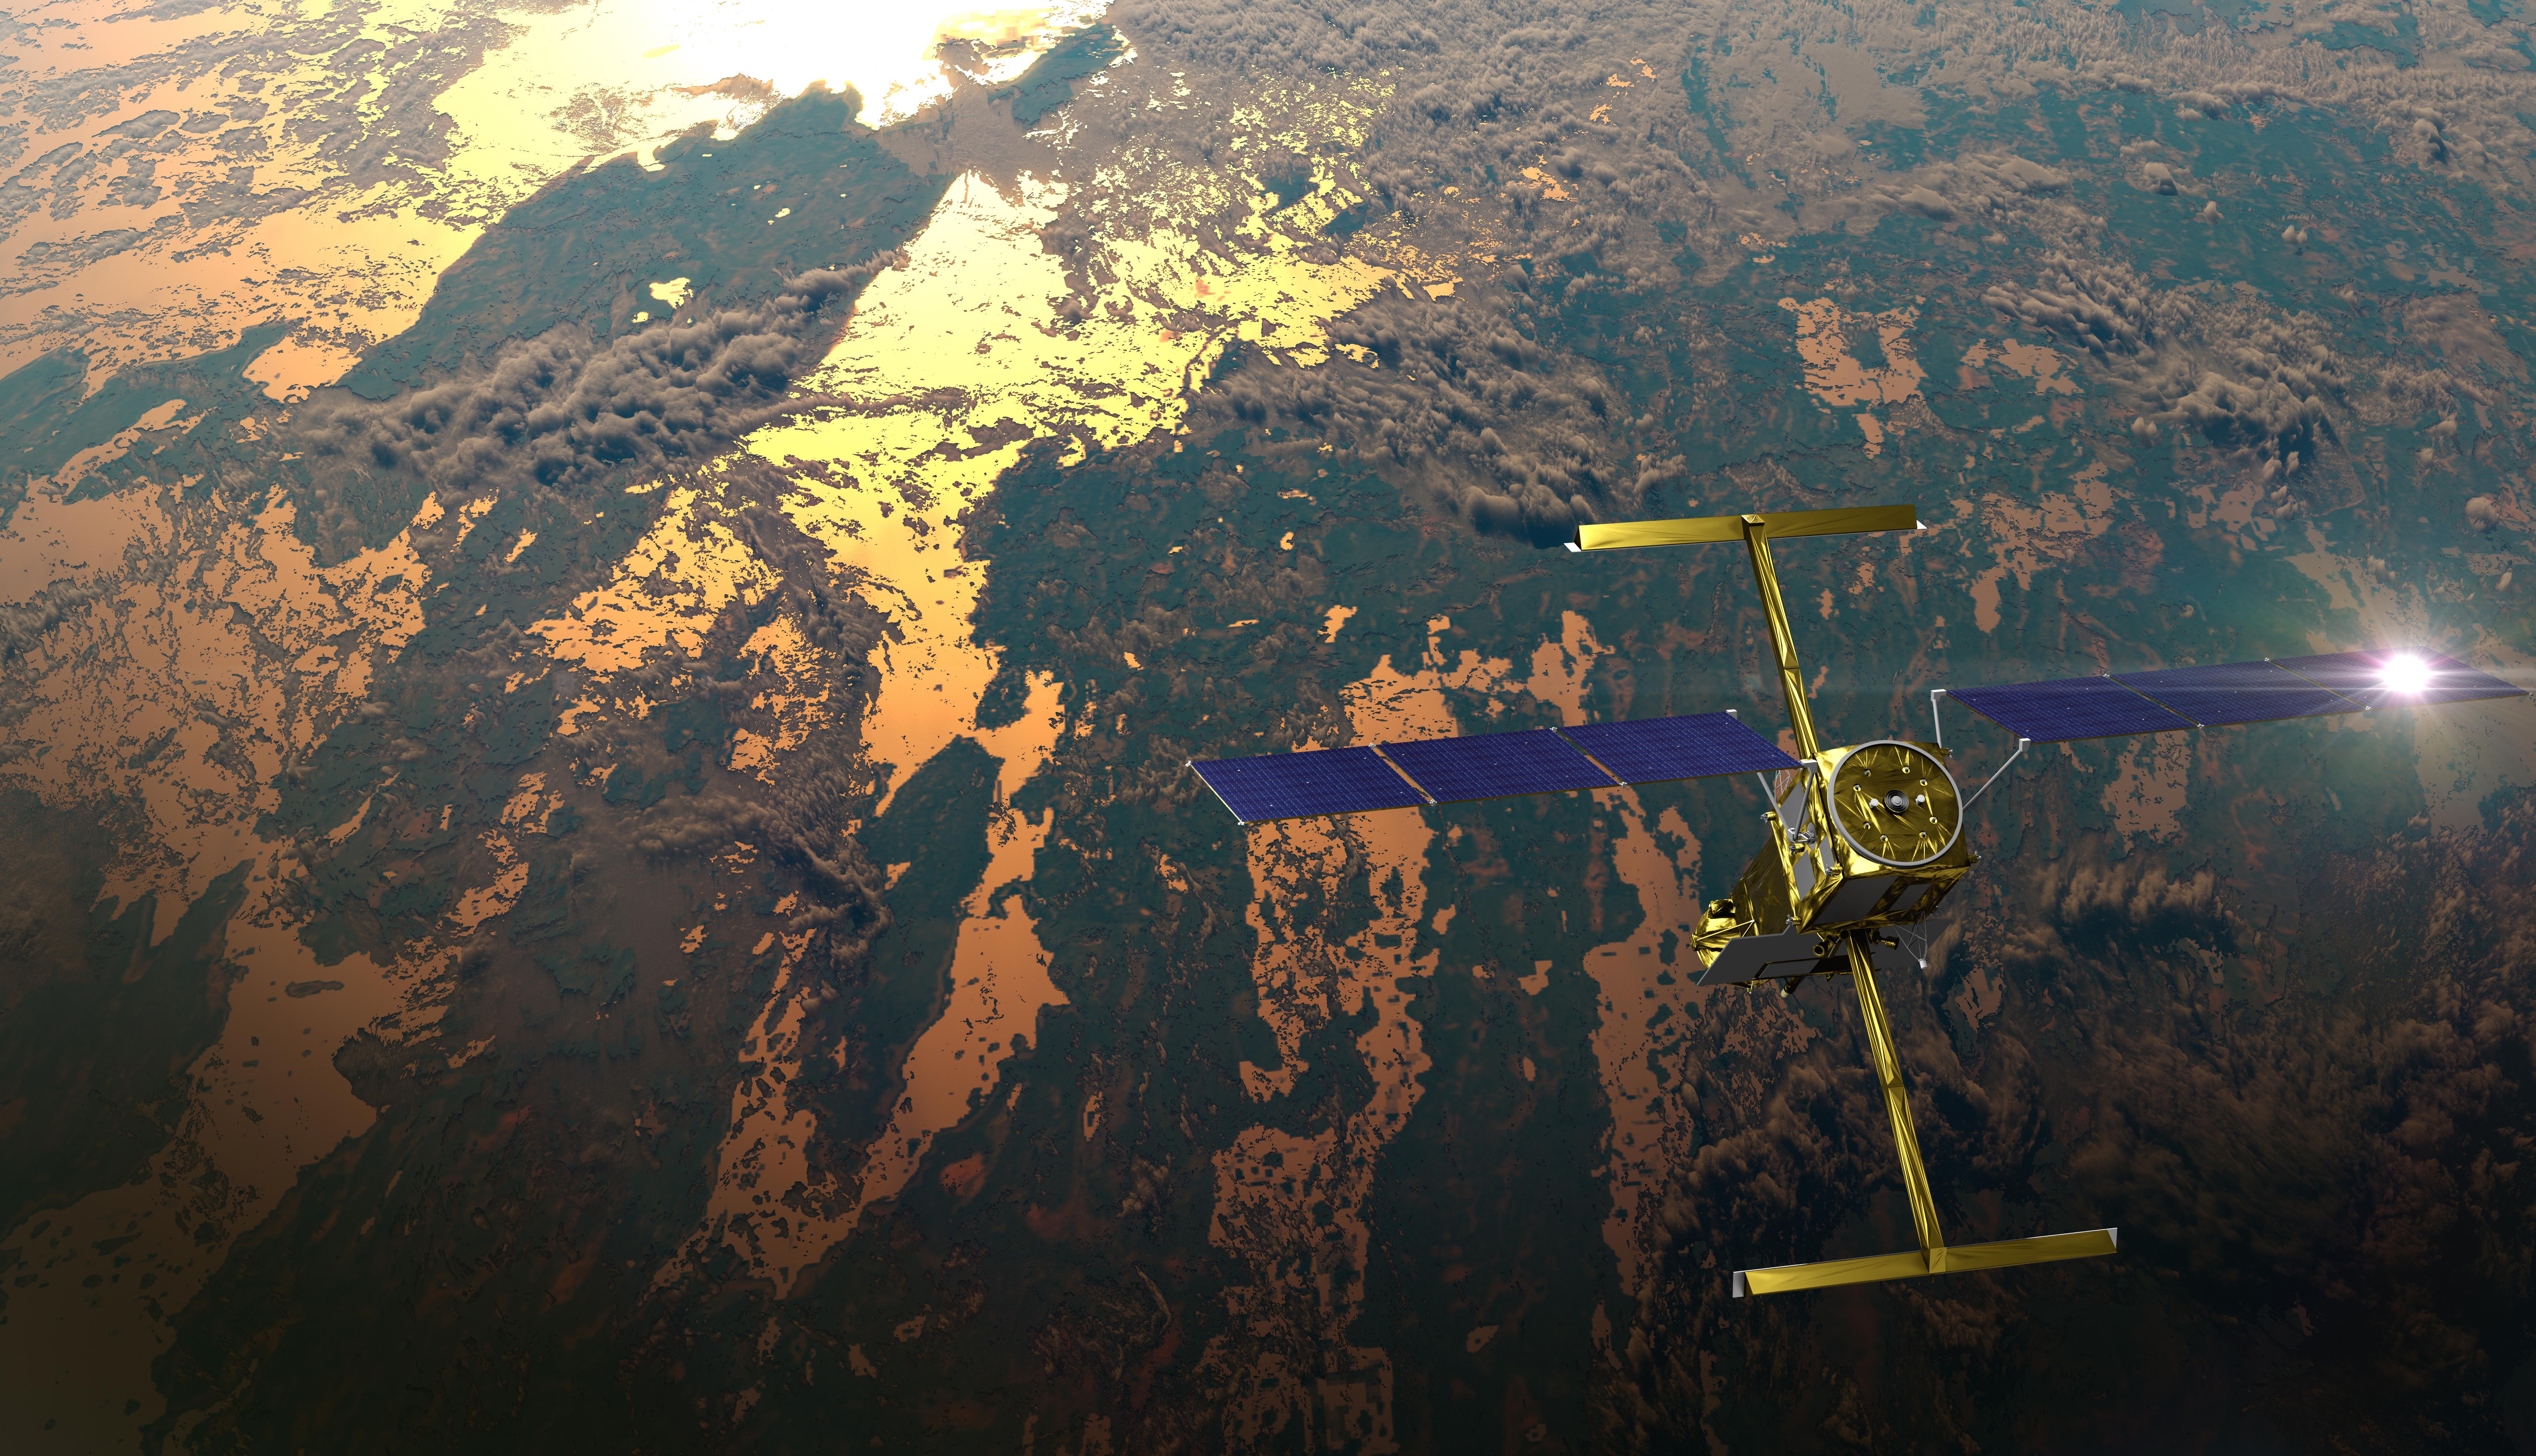
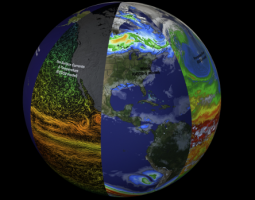
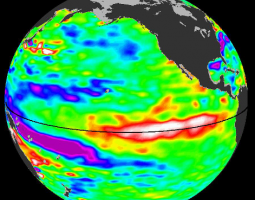
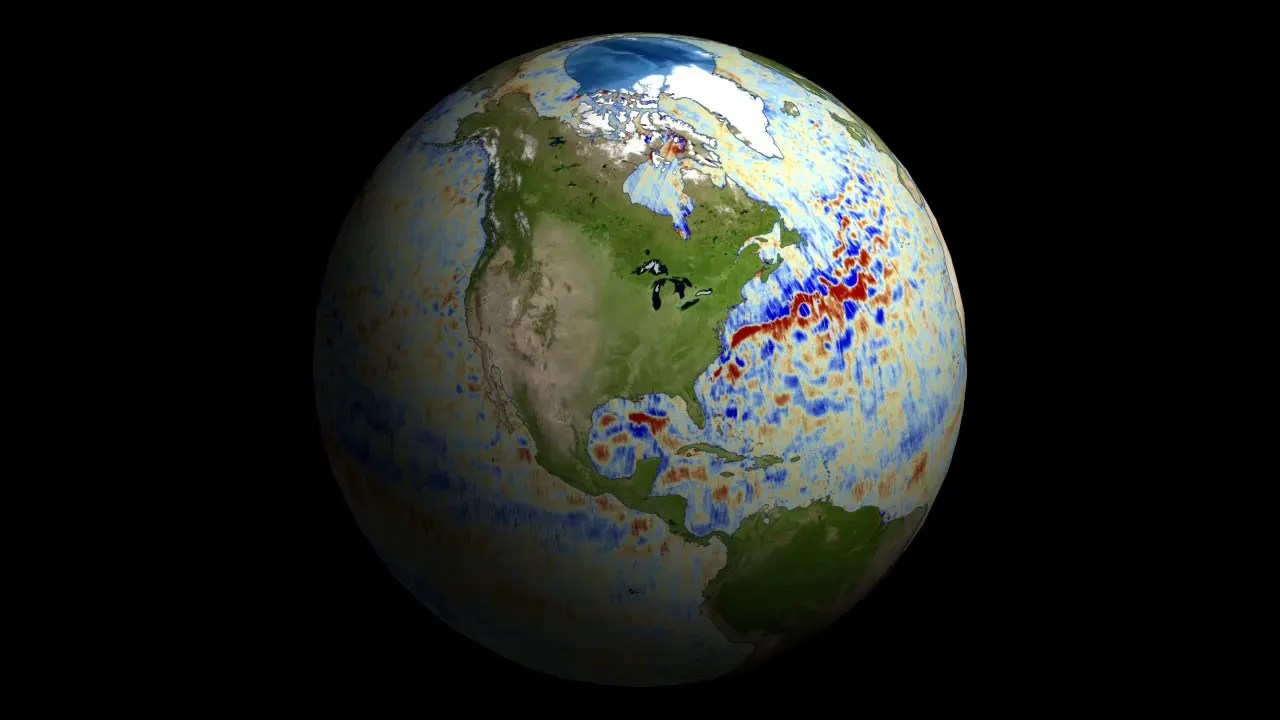
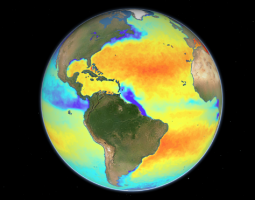
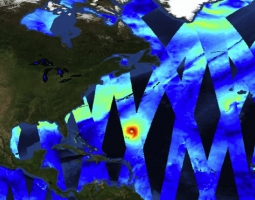
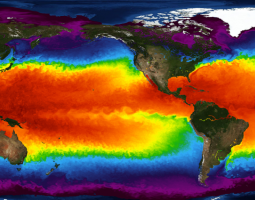
The ocean plays a fundamental role in the Earth’s system. It shapes our planet’s climate and weather by absorbing, storing, and transporting large quantities of heat, water, moisture, and carbon dioxide. NASA’s Ocean Physics program enables research that advances our understanding of the ocean’s role in climate. Our scientists utilize NASA satellite and sub-orbital data, climate models and data science to study ocean dynamics, sea level rise, hydrological cycle, and ocean interactions within the Earth system.
Apply to one of the current NASA research opportunities to join us as a NASA scientist.
News
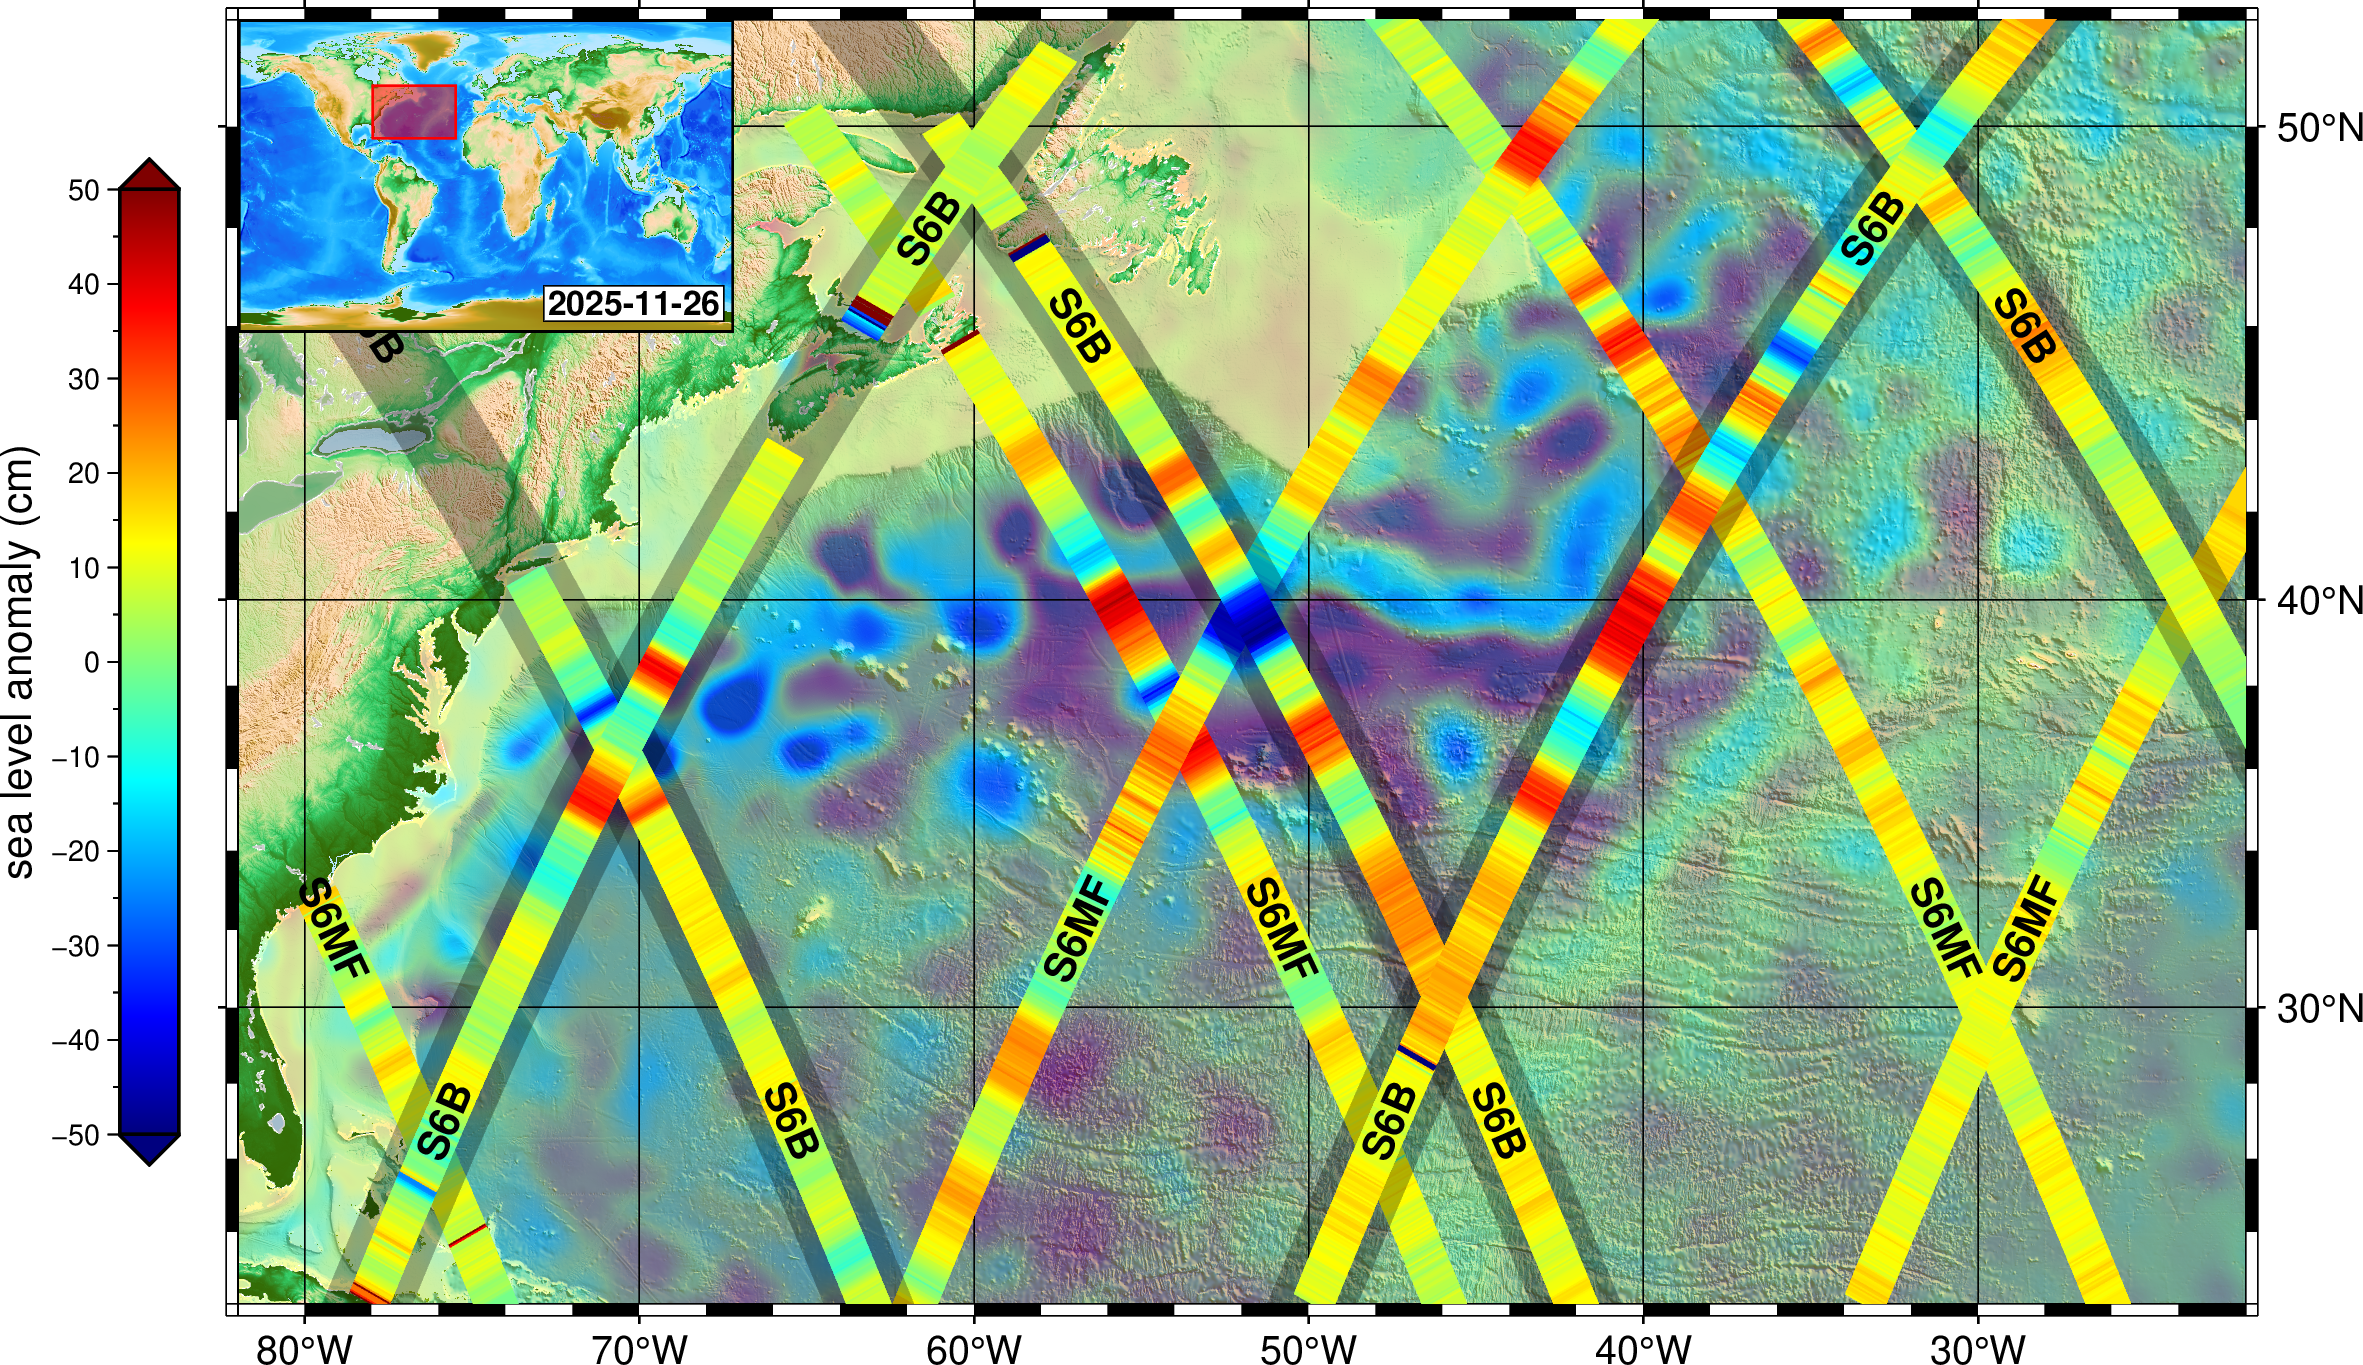
US-French Satellite Takes Stock of World’s River Water
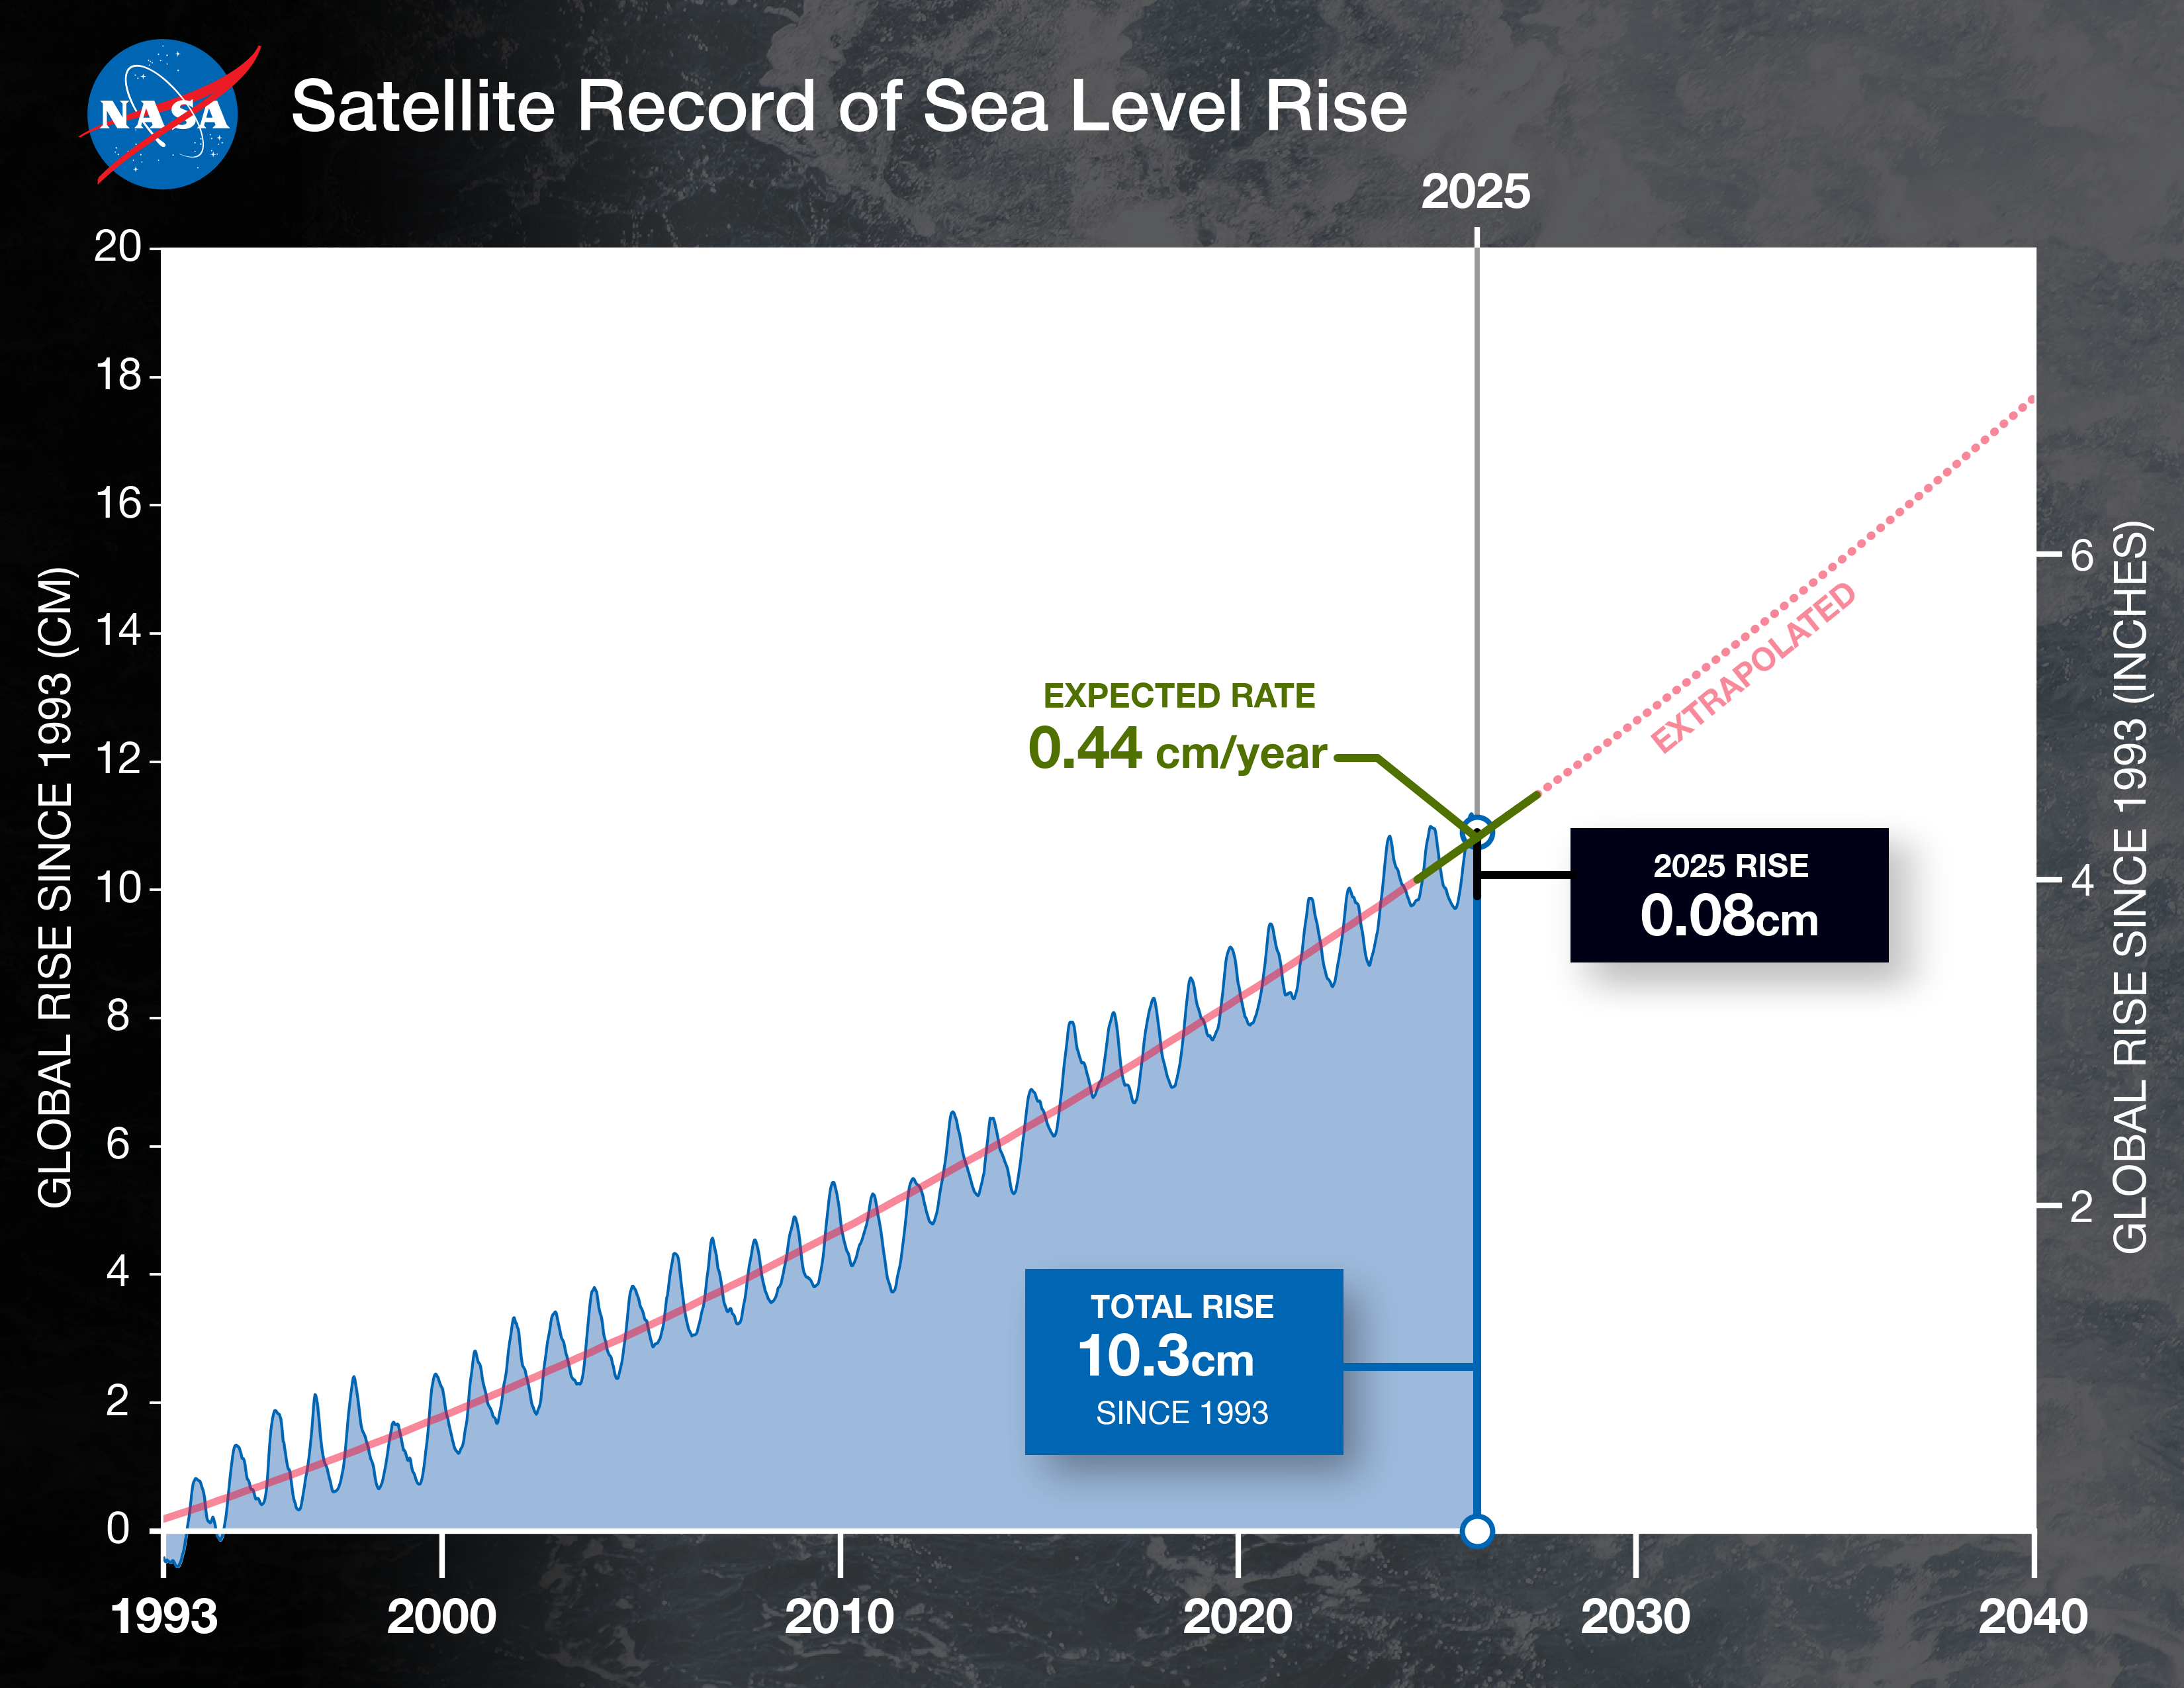
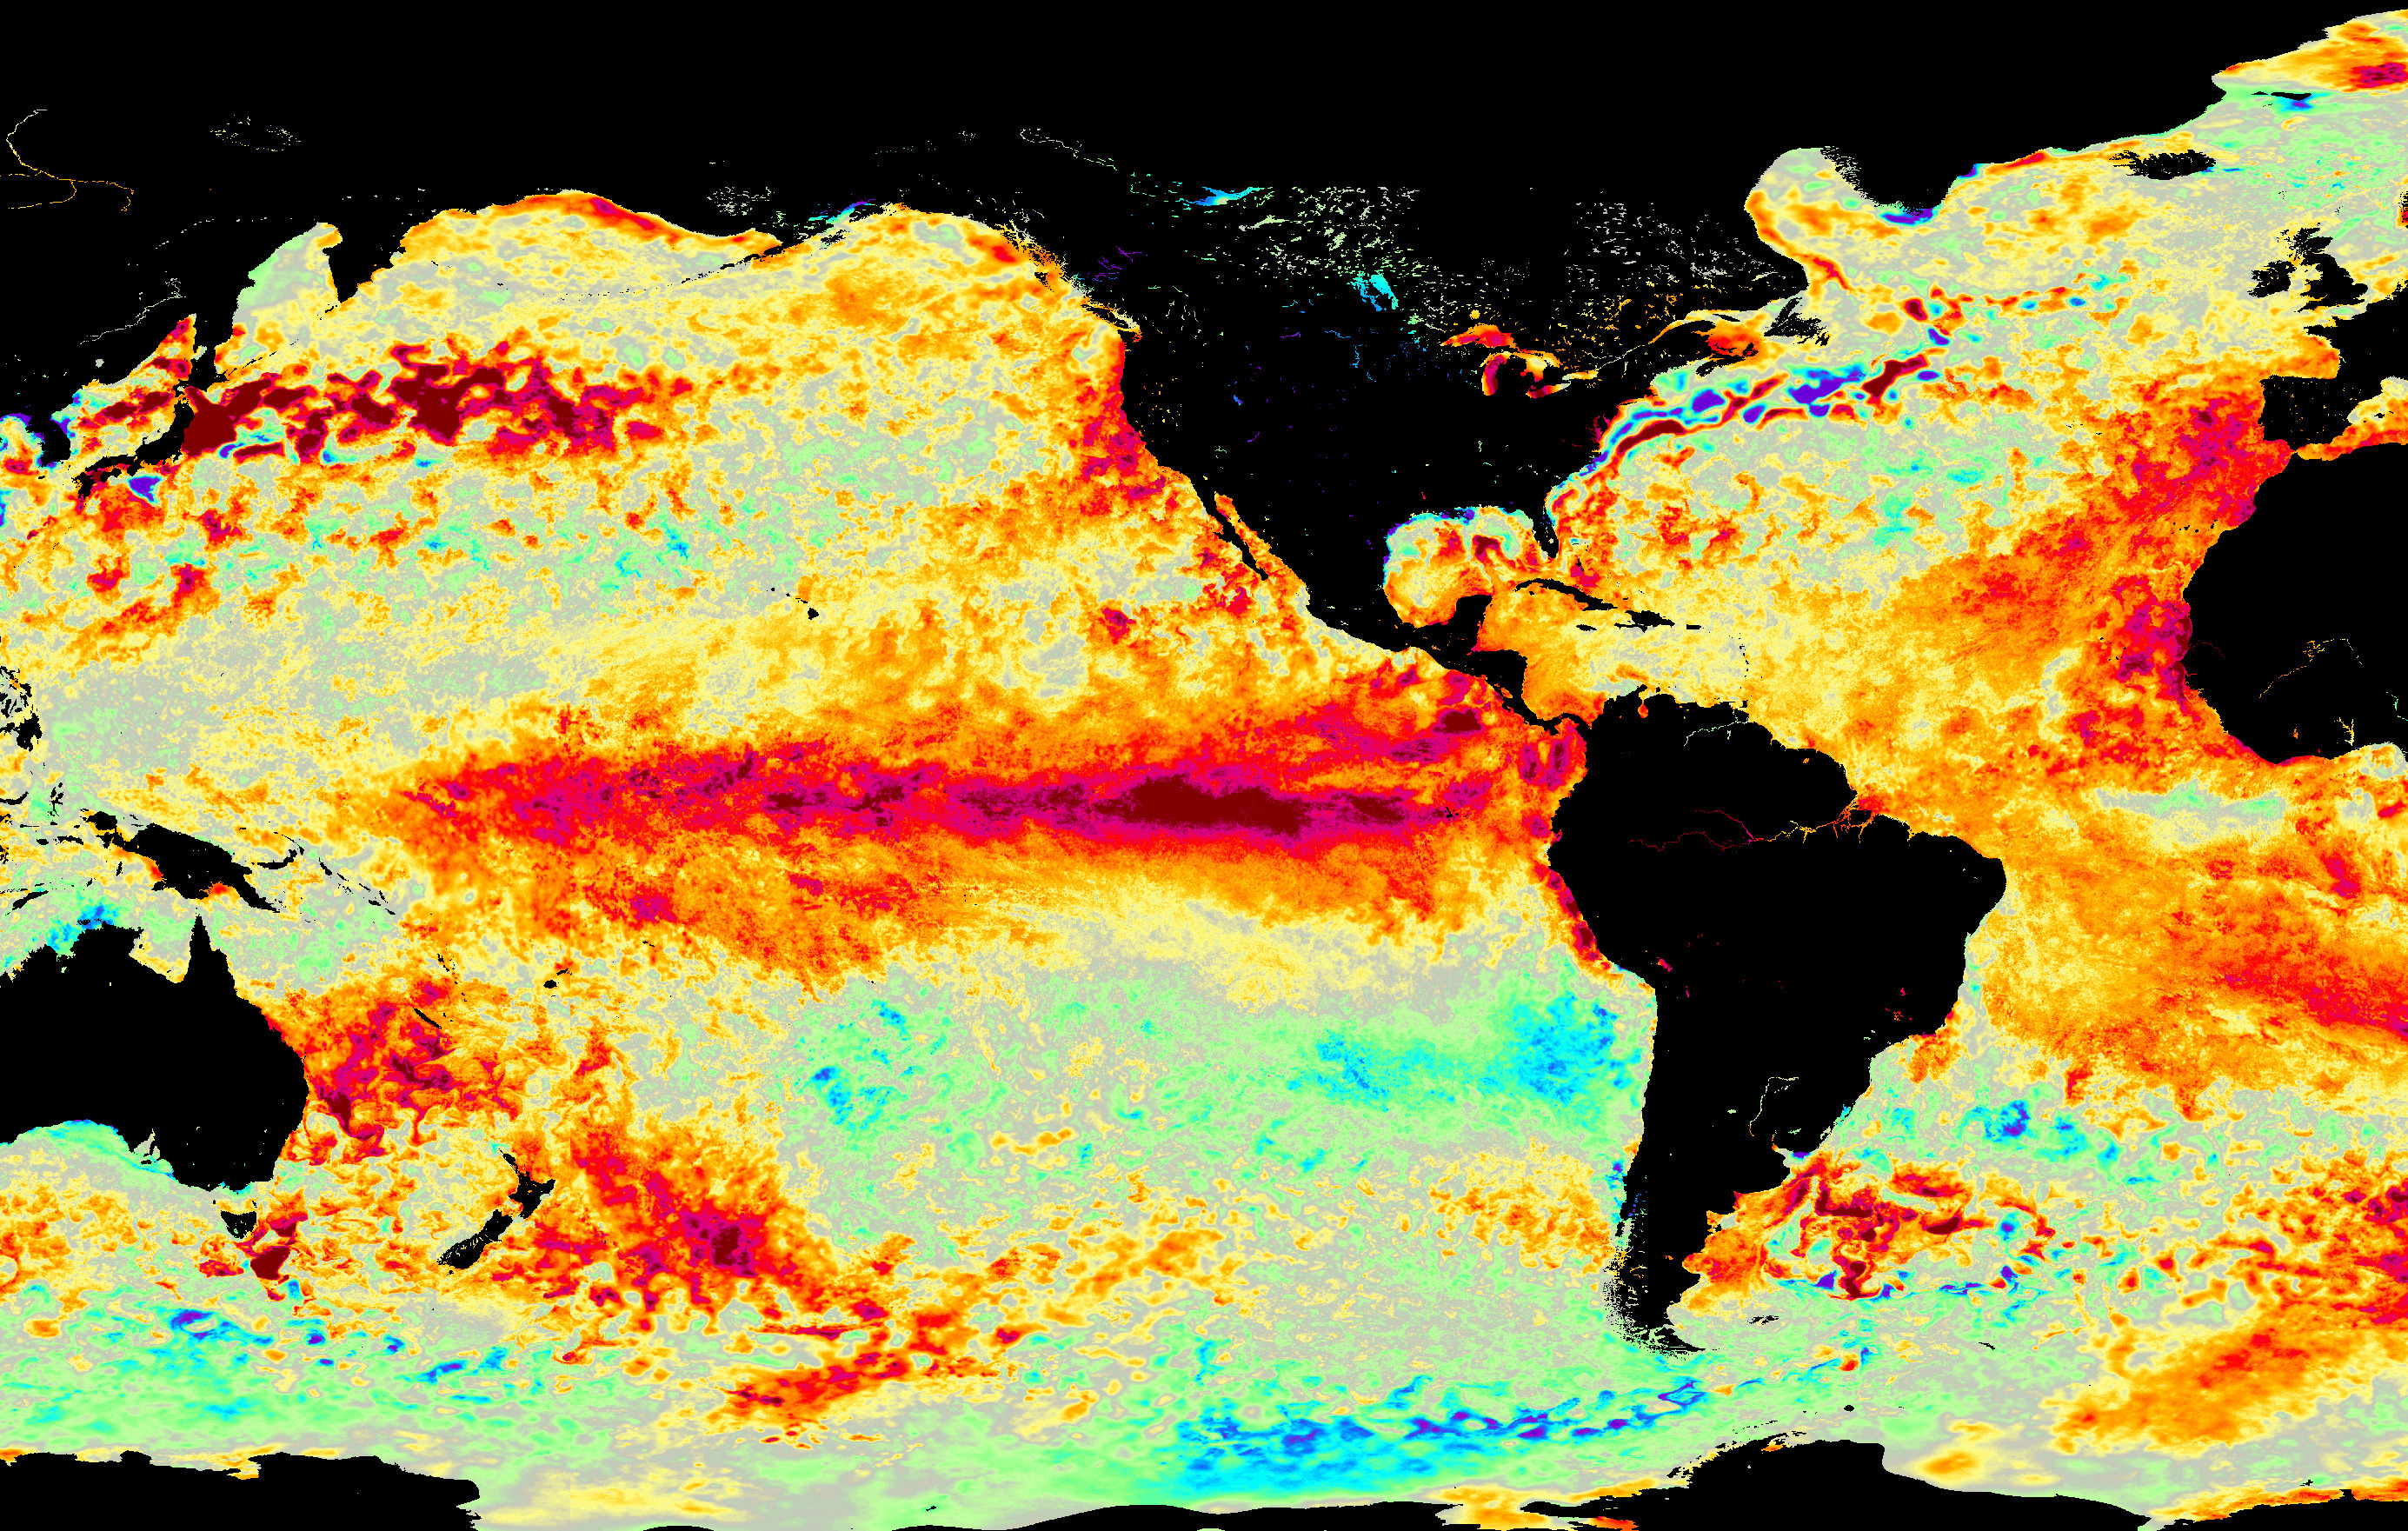
NASA Analysis Shows La Niña Limited Sea Level Rise in 2025
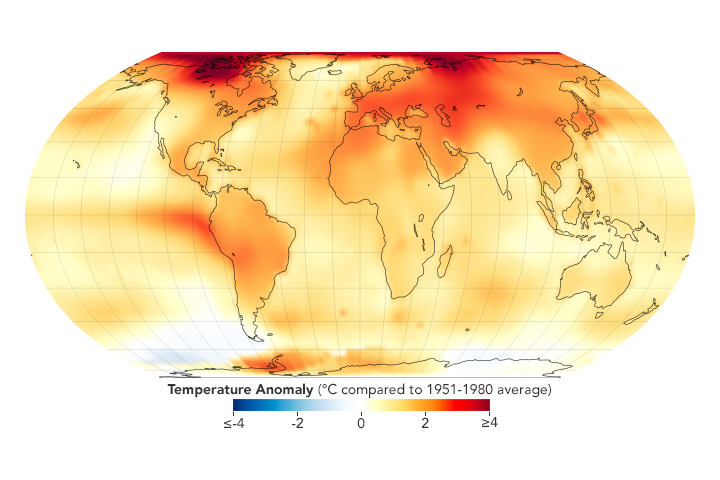
NASA Releases Global Temperature Data

NASA-French SWOT Satellite Provides Global Estimate of River Discharge
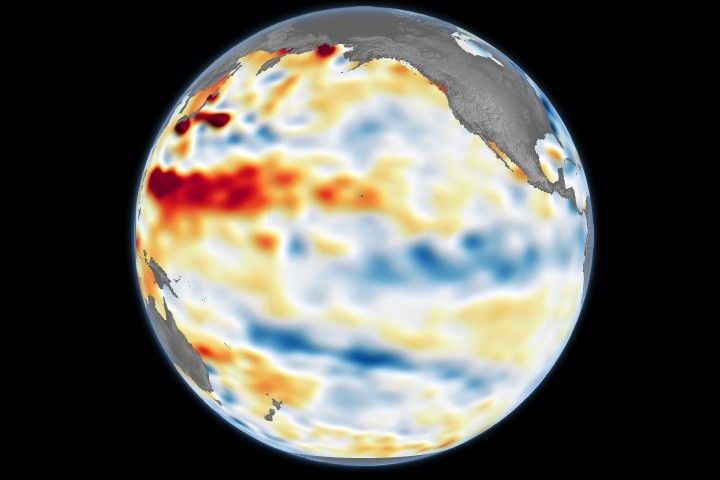
A Subtle Return of La Niña
NASA, Partners Share First Data From New US-European Sea Satellite
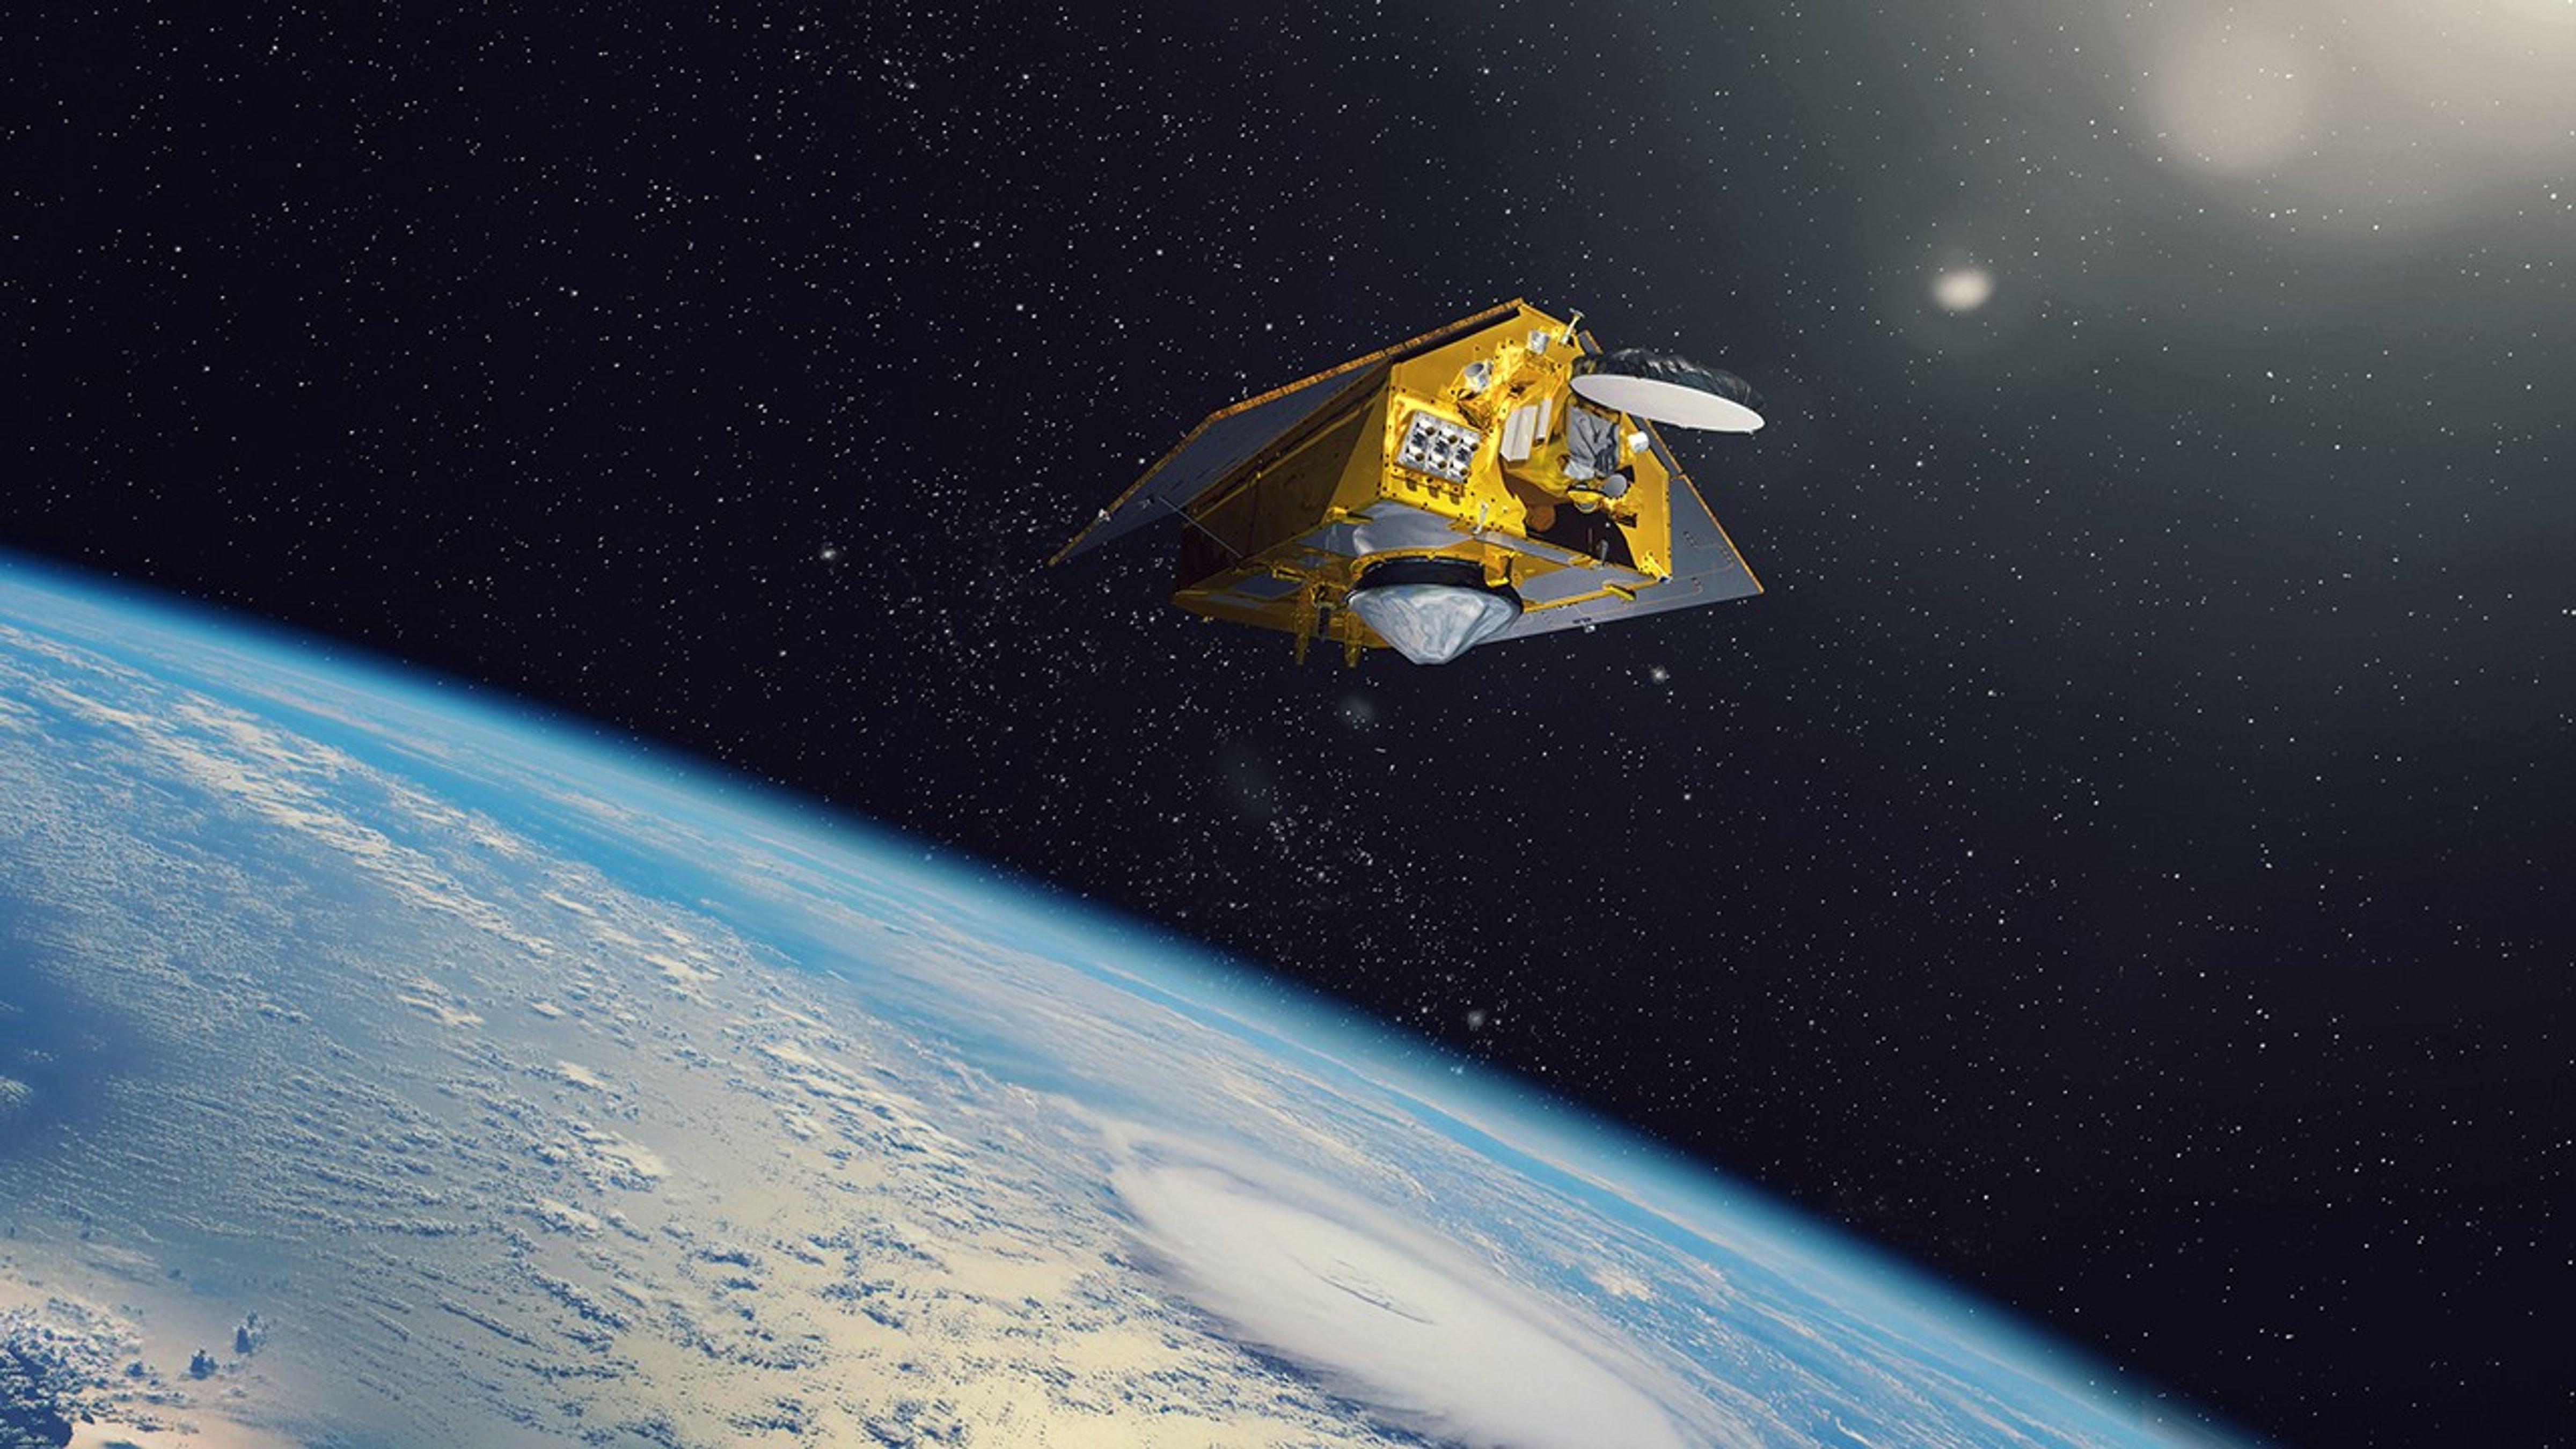
Sentinel-6B: Extending the Legacy (Mission Overview)
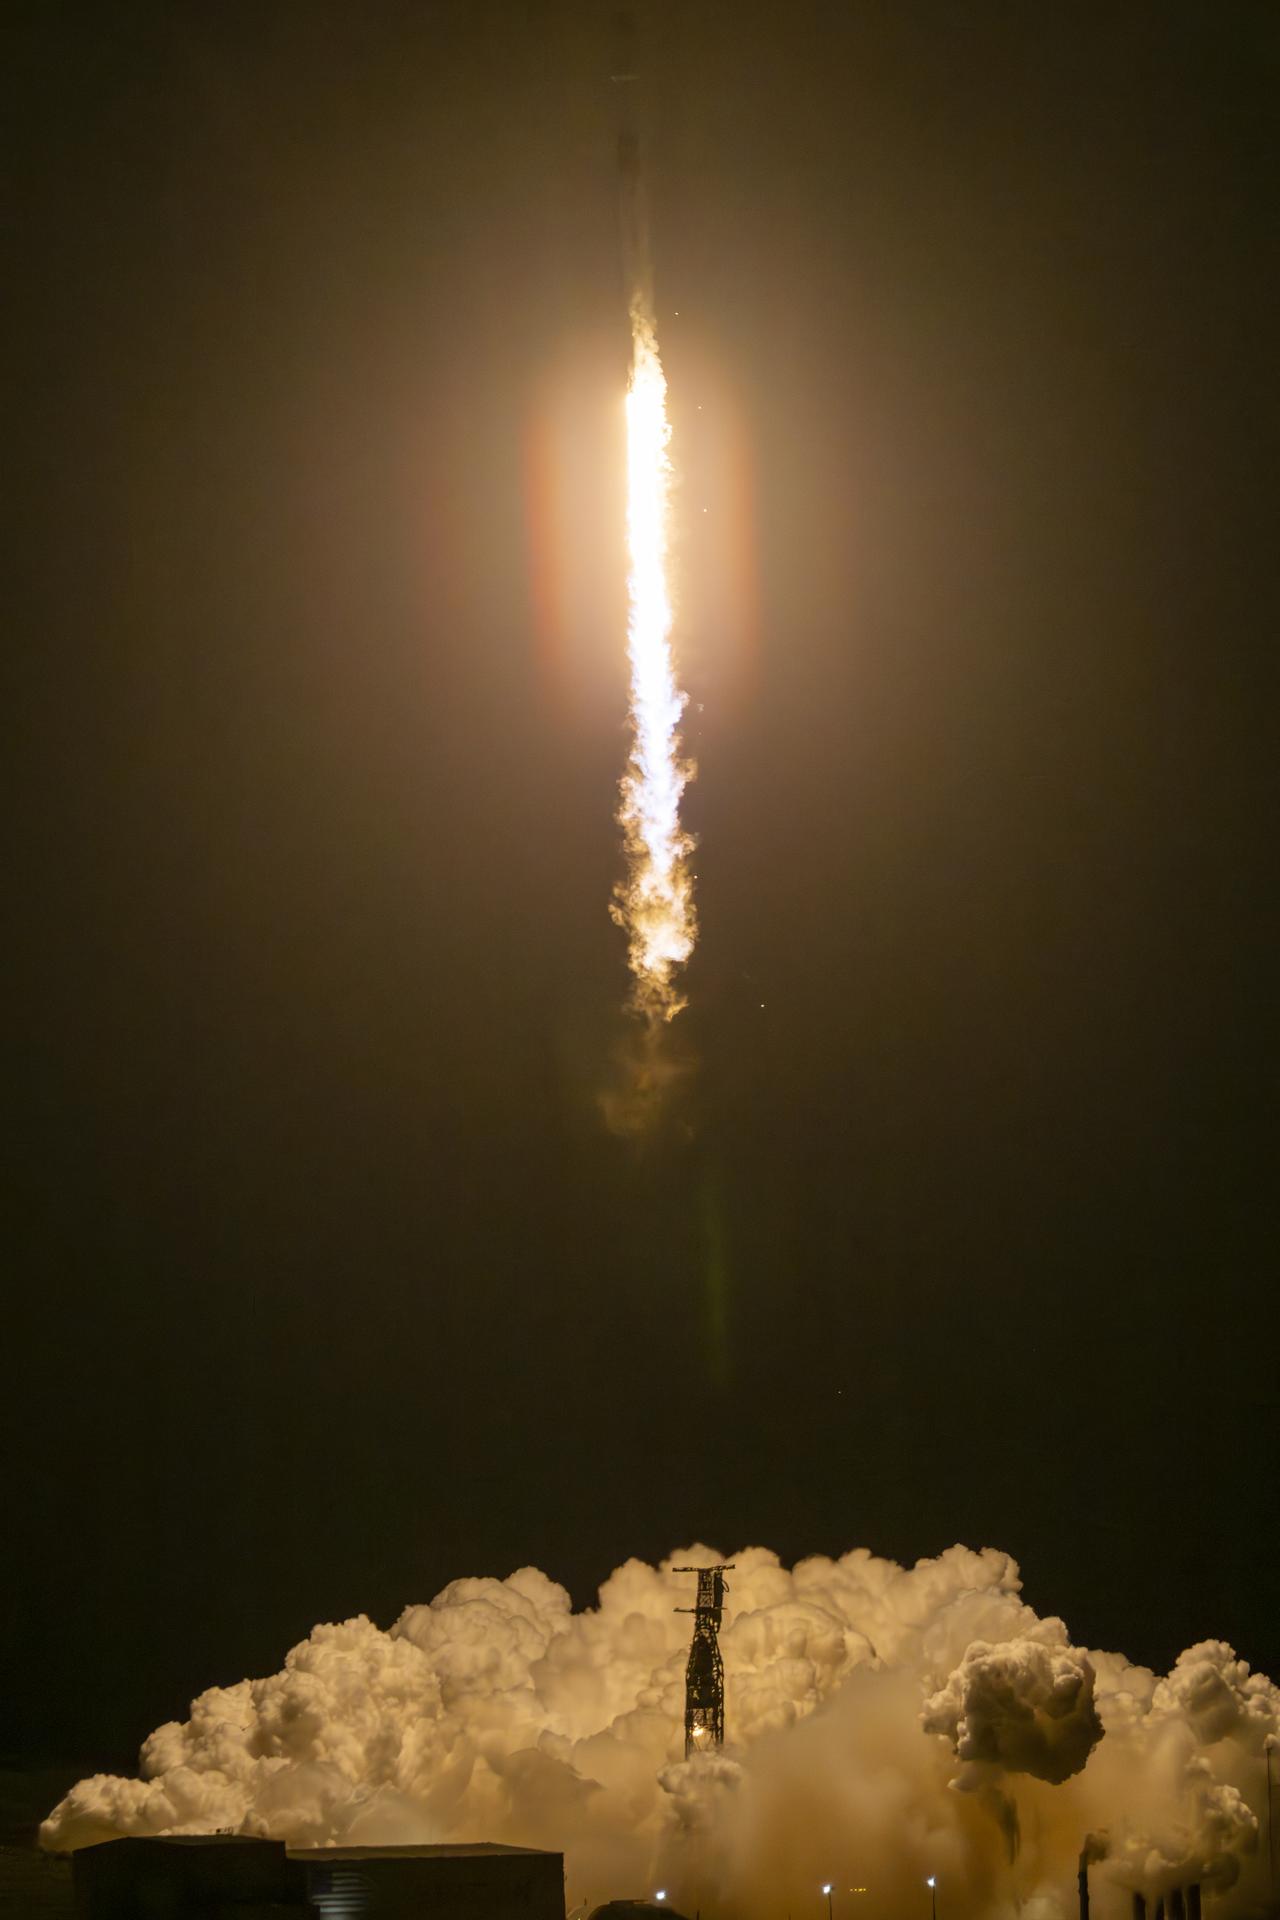
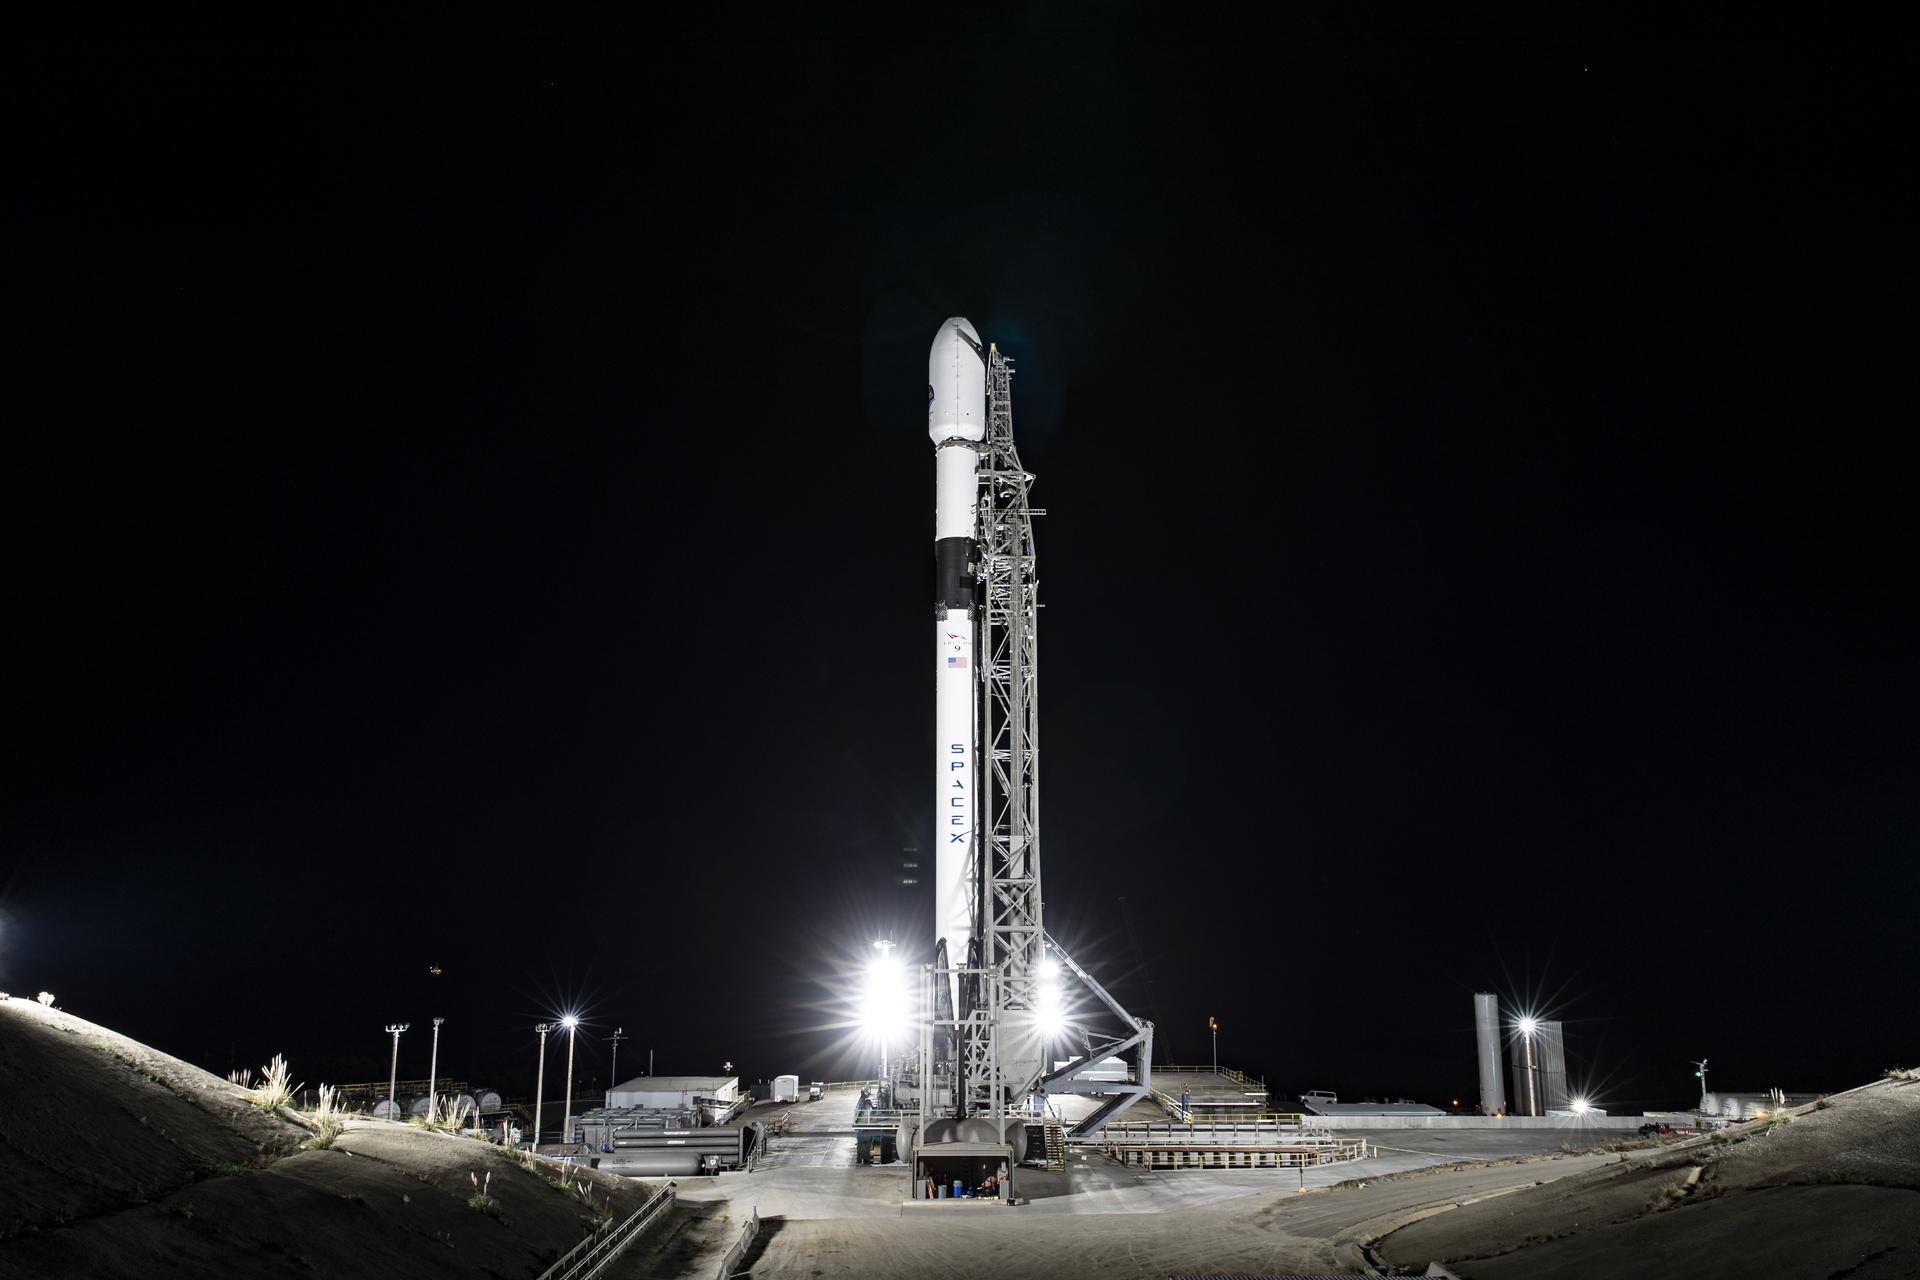
NASA, SpaceX Launch US-European Satellite to Monitor Earth’s Oceans
NASA, European Partners Set to Launch Sentinel-6B Earth Satellite
6 Things to Know From NASA About New US, European Sea Satellite

Sentinel-6/Jason-CS (Continuity of Service) Blog

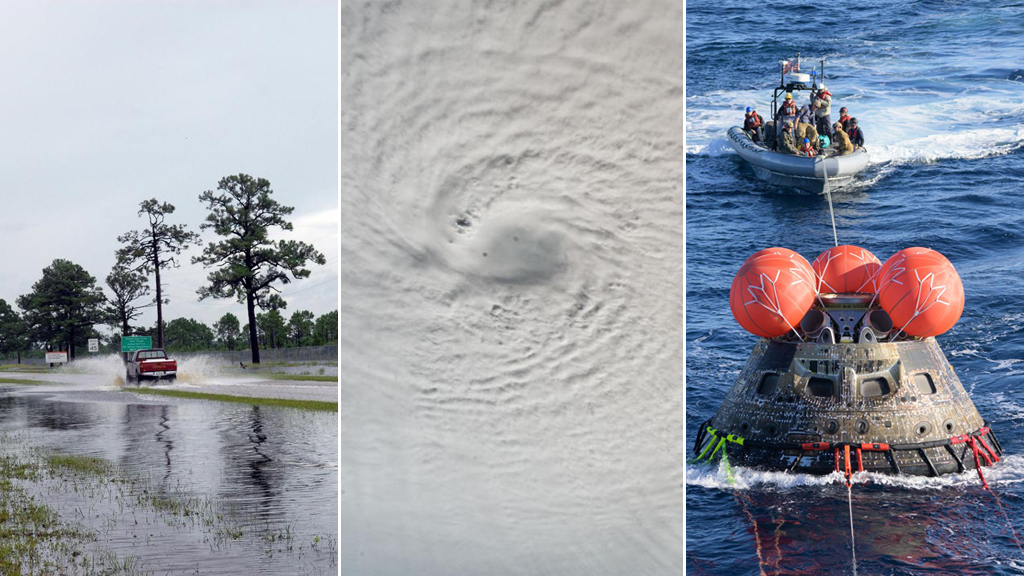
New US-European Sea Level Satellite Will Help Safeguard Ships at Sea
Science and Research
NASA’s Ocean Physics program directs multiple competitively-selected NASA’s Science Teams that study the physics of the oceans. Below are details about each science team.
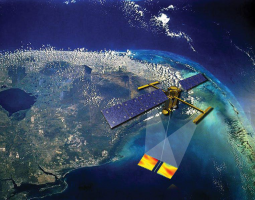
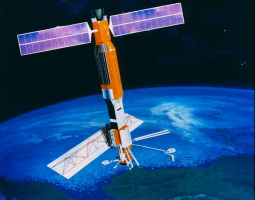
Missions
The Ocean Physics program currently provides scientific leadership for the following operational missions. Past and future missions (to be) lead by the Ocean Physics program are also highlighted separately.
Operational
Currently taking measurements
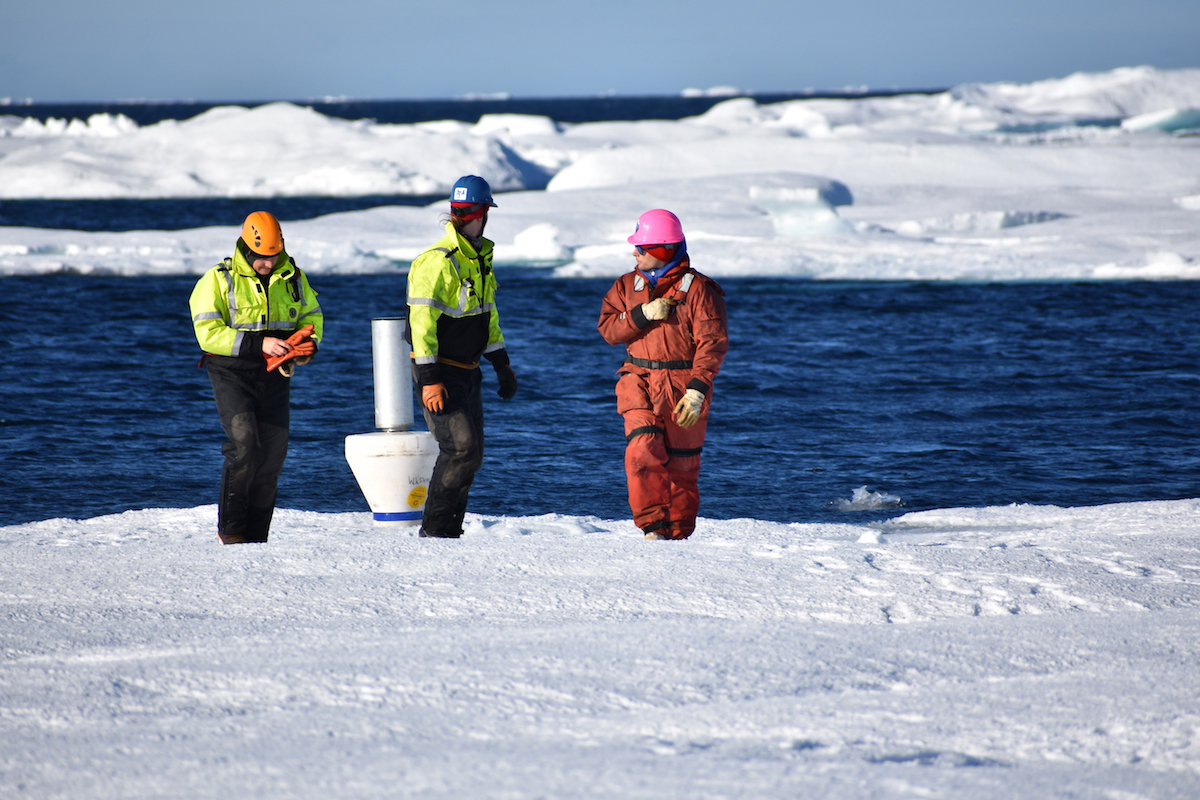
 Surface Water and Ocean Topography (SWOT) 2022 | 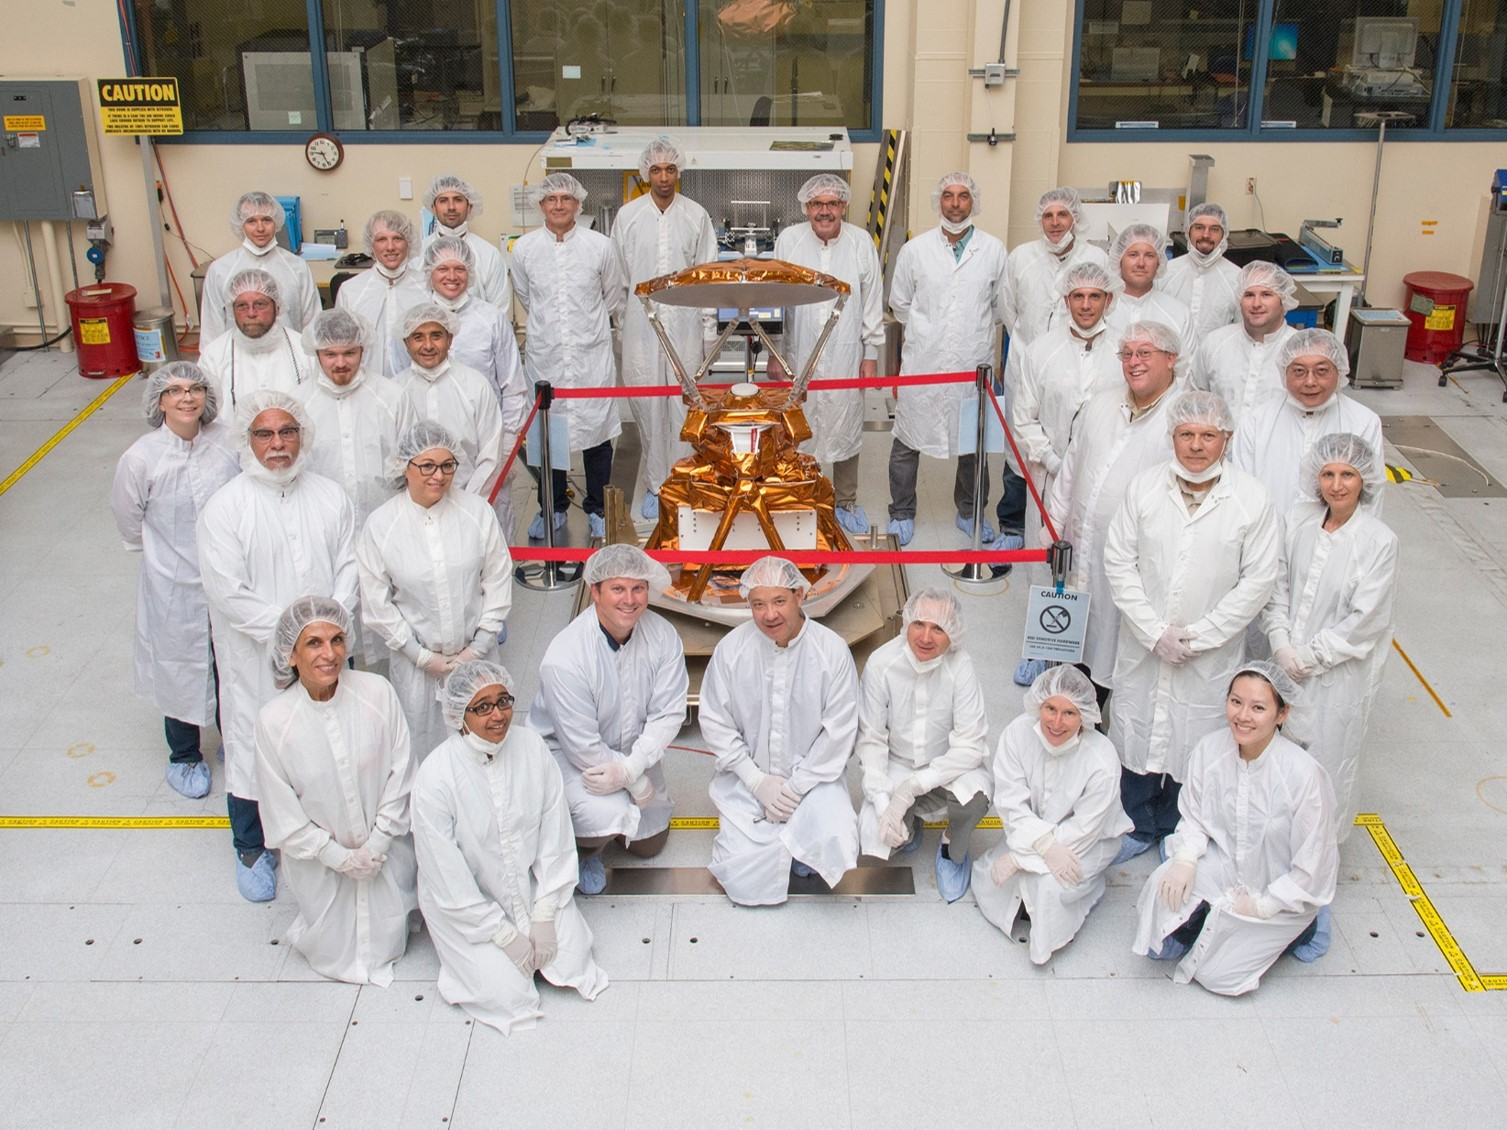 Compact Ocean Wind Vector Radiometer (COWVR) 2021 |  Salinity And Stratification at the Sea Ice Edge (SASSIE) 2021 | 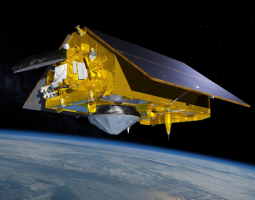 Sentinel-6 Michael Freilich/Jason-CS November 2020 |
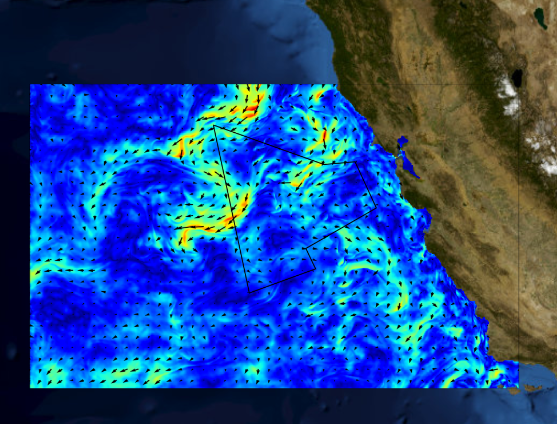
 Sub-Mesoscale Ocean Dynamics Experiment (S-MODE) April 2020 | 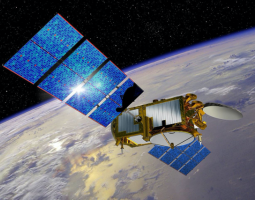 Jason-3 January 2016 | 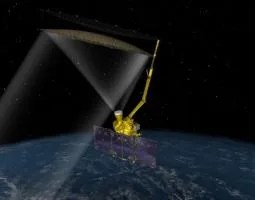 Soil Moisture Active Passive (SMAP) January 2015 |
Future
Upcoming missions
 Sentinel-6B 2025 |  Copernicus Polar Ice and Snow Topography Altimeter (CRISTAL) 2028 |
Non-Operational
Past missions providing data for current research
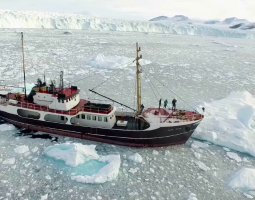 Oceans Melting Greenland (OMG) July 2015 | 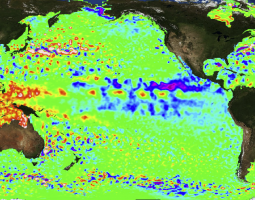 Ocean Surface Topography Mission (OSTM)/Jason-2 2008-2019 | 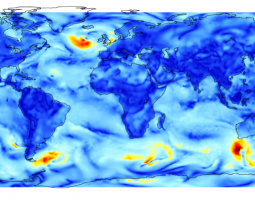 QuikSCAT 1999-2018 | 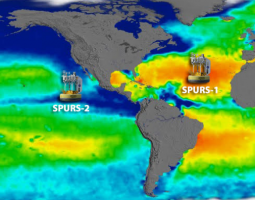 SPURS 1&2 2012-2013 & 2016-2017 |
 RapidScat 2014-2016 |  Aquarius 2011-2015 |  Jason-1 2001-2012 | 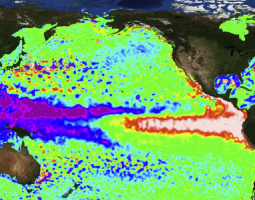 TOPEX/Poseidon 1992-2005 |
 Seasat 1978 |
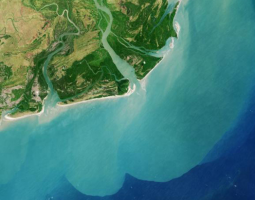
Access the Data
![]()
The Physical Oceanography Distributed Active Archive Center (PO.DAAC) preserves NASA's ocean and climate open data and makes these universally accessible and meaningful.
Partnerships
The Ocean Physics program actively engages in the following national and international partnerships that work together to sustain and enhance the Earth observing system.
 US Climate Variability and Predictability (CLIVAR) |  UN Decade of Ocean Science |  US Global Change Research Program (USGCRP) |  Interagency Ocean Observation Committee (IOOC) |
 National Oceanographic Partnership Program (NOPP) |  White House Subcommittee on Ocean Science and Technology (WH SOST) |  Committee on Earth Observing Satellites Virtual Constellation (CEOS VC) |  NASA-ESA Earth Science Joint Program Planning Group NASA-ESA Satellite and In situ Salinity Working Group |
Contacts
Nadya Vinogradova Shiffer
Lead, NASA Integrated Earth System Observatory
Ocean Physics Program Manager
Contact | Bio