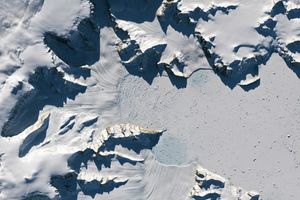
![Request for Information – Potential [Placeholder for Prize]](https://assets.science.nasa.gov/dynamicimage/assets/science/missions/a-step/FFR_Earth_Background_20251120%20.png?w=1024)


Introduction and History
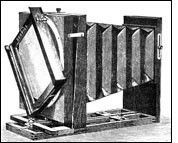
The technology of modern remote sensing began with the invention of the camera more than 150 years ago. Although the first, rather primitive photographs were taken as "stills" on the ground, the idea and practice of looking down at the Earth's surface emerged in the 1840s when pictures were taken from cameras secured to tethered balloons for purposes of topographic mapping. Perhaps the most novel platform at the end of the last century is the famed pigeon fleet that operated as a novelty in Europe. By the first World War, cameras mounted on airplanes provided aerial views of fairly large surface areas that proved invaluable in military reconnaissance. From then until the early 1960s, the aerial photograph remained the single standard tool for depicting the surface from a vertical or oblique perspective.
As with the camera, information could be obtained about subject without being in physical contact with it.
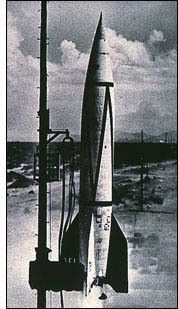
Satellite remote sensing can be traced to the early days of the space age (both Russian and American programs) and actually began as a dual approach to imaging surfaces using several types of sensors from spacecraft. In 1946, V-2 rockets acquired from Germany after World War II were launched to high altitudes from White Sands, New Mexico. These rockets, while never attaining orbit, contained automated still or movie cameras that took pictures as the vehicle ascended. Then, with the emergence of the space program in the 1960s, Earth-orbiting cosmonauts and astronauts acted much like tourists by taking photos out the window of their spacecraft
The term "remote sensing," first used in the United States in the 1950s by Ms. Evelyn Pruitt of the U.S. Office of Naval Research, is now commonly used to describe the science—and art—of identifying, observing, and measuring an object without coming into direct contact with it. This process involves the detection and measurement of radiation of different wavelengths reflected or emitted from distant objects or materials, by which they may be identified and categorized by class/type, substance, and spatial distribution.
Radiation
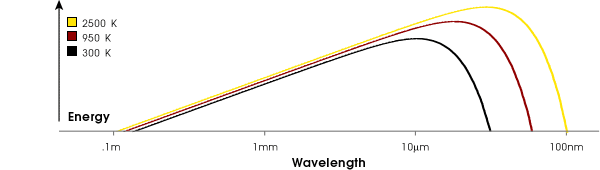
Unless it has a temperature of absolute zero (-273°C) an object reflects, absorbs, and emits energy in a unique way, and at all times. This energy, called electromagnetic radiation, is emitted in waves that are able to transmit energy from one place to another. For example, this computer, trees, air, the Sun, the Earth, and all the stars and planets are reflecting and emitting a wide range of electromagnetic waves. These waves originate from billions of vibrating electrons, atoms, and molecules, which emit and absorb electromagnetic radiation in unique combinations of wavelengths.
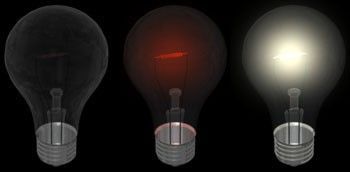
The amount of electromagnetic radiation an object emits depends primarily on its temperature. The higher the temperature of an object, the faster its electrons vibrate and the shorter its peak wavelength of emitted radiation. Conversely, the lower the temperature of an object, the slower its electrons vibrate, and the longer its peak wavelength of emitted radiation. This concept can be shown by gripping the end of a long rope and shaking it. Rapidly shaking the rope (high temperature) results in a series of short waves travelling along it, while shaking it slowly (low temperature) results in a series of longer waves.
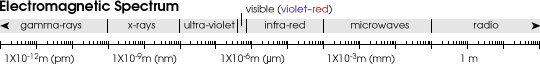
Electromagnetic Spectrum
The fundamental unit of electromagnetic phenomena is the photon, the smallest possible amount of electromagnetic energy of a particular wavelength. Photons, which are without mass, move at the speed of light—300,000 km/sec (186,000 miles/sec) in the form of waves analogous to the way waves propagate through the oceans. The energy of a photon determines the frequency (and wavelength) of light that is associated with it. The greater the energy of the photon, the greater the frequency of light and vice versa.
The entire array of electromagnetic waves comprises the electromagnetic (EM) spectrum. The waves are called electromagnetic because they consist of combined electric and magnetic waves that result when a charged particle (electron) accelerates. The EM spectrum has been arbitrarily divided into regions or intervals to which descriptive names have been applied. At the very energetic (high frequency; short wavelength) end are gamma rays and x-rays. Radiation in the ultraviolet region extends from about 1 nanometer to about 0.36 micrometers. It is convenient to measure the mid-regions of the spectrum in these two units: micrometers (µm), a unit of length equivalent to one-millionth of a meter, or nanometers (nm), a unit of length equivalent to one-billionith of a meter. The visible region occupies the range between 0.4 and 0.7 µm, or its equivalents of 400 to 700 nm. The infrared (IR) region, spans between 0.7 and 100 µm. At shorter wavelengths (near .7 µm) infrared radiation can be detected by special film, while at longer wavelengths it is felt as heat.
Longer wavelength intervals are measured in units ranging from millimeters (mm) through meters (m). The microwave region spreads across 1 mm to 1 m; this includes all of the intervals used by man-made radar systems, which generate their own active radiation directed towards (and reflected from) targets of interest. The lowest frequency (longest wavelength) region—beyond 1 m—is associated with radio waves.
Absorption Bands and Atmospheric Windows
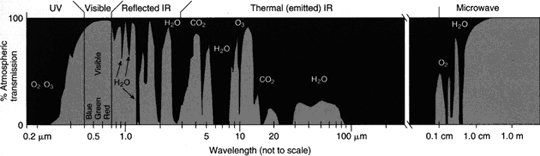
Some types of electromagnetic radiation easily pass through the atmosphere, while other types do not. The ability of the atmosphere to allow radiation to pass through it is referred to as its transmissivity, and varies with the wavelength/type of the radiation. The gases that comprise our atmosphere absorb radiation in certain wavelengths while allowing radiation with differing wavelengths to pass through.
The areas of the EM spectrum that are absorbed by atmospheric gases such as water vapor, carbon dioxide, and ozone are known as absorption bands. In the figure, absorption bands are represented by a low transmission value that is associated with a specific range of wavelengths.
In contrast to the absorption bands, there are areas of the electromagnetic spectrum where the atmosphere is transparent (little or no absorption of radiation) to specific wavelengths. These wavelength bands are known as atmospheric "windows" since they allow the radiation to easily pass through the atmosphere to Earth's surface.
Most remote sensing instruments on aircraft or space-based platforms operate in one or more of these windows by making their measurements with detectors tuned to specific frequencies (wavelengths) that pass through the atmosphere. When a remote sensing instrument has a line-of-sight with an object that is reflecting sunlight or emitting heat, the instrument collects and records the radiant energy.While most remote sensing systems are designed to collect reflected radiation, some sensors, especially those on meteorological satellites, directly measure absorption phenomena, such as those associated with carbon dioxide (CO2) and other gases. The atmosphere is nearly opaque to EM radiation in part of the mid-IR and all of the far-IR regions. In the microwave region, by contrast, most of this radiation moves through unimpeded, so radar waves reach the surface (although weather radars are able to detect clouds and precipitation because they are tuned to observe backscattered radiation from liquid and ice particles).
Spectral Signatures
A primary use of remote sensing data is in classifying the myriad features in a scene (usually presented as an image) into meaningful categories or classes. The image then becomes a thematic map (the theme is selectable e.g., land use, geology, vegetation types, rainfall). A farmer may use thematic maps to monitor the health of his crops without going out to the field. A geologist may use the images to study the types of minerals or rock structure found in a certain area. A biologist may want to study the variety of plants in a certain location.
For example, at certain wavelengths, sand reflects more energy than green vegetation while at other wavelengths it absorbs more (reflects less) energy. Therefore, in principle, various kinds of surface materials can be distinguished from each other by these differences in reflectance. Of course, there must be some suitable method for measuring these differences as a function of wavelength and intensity (as a fraction of the amount of radiation reaching the surface). Using reflectance differences, the four most common surface materials (GL = grasslands; PW = pinewoods; RS = red sand; SW = silty water) can be easily distinguished, as shown in the next figure.
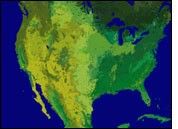
When more than two wavelengths are used, the resulting images tend to show more separation among the objects. Imagine looking at different objects through red lenses, or only blue or green lenses. In a similar manner, certain satellite sensors can record reflected energy in the red, green, blue, or infrared bands of the spectrum, a process called multispectral remote sensing. The improved ability of multispectral sensors provides a basic remote sensing data resource for quantitative thematic information, such as the type of land cover. Resource managers use information from multispectral data to monitor fragile lands and other natural resources, including vegetated areas, wetlands, and forests. These data provide unique identification characteristics leading to a quantitative assessment of the Earth's features.
Pixels and Bits
Using radio waves, data from Earth-orbiting satellites are transmitted on a regular basis to properly equipped ground stations. As the data are received they are translated into a digital image that can be displayed on a computer screen. Just like the pictures on your television set, satellite imagery is made up of tiny squares, each of a different gray shade or color. These squares are called pixels—short for picture elements—and represent the relative reflected light energy recorded for that part of the image.
Each pixel represents a square area on an image that is a measure of the sensor's ability to resolve (see) objects of different sizes. For example, the Enhanced Thematic Mapper (ETM+) on the Landsat 7 satellite has a maximum resolution of 15 meters; therefore, each pixel represents an area 15 m x 15 m, or 225 m2. Higher resolution (smaller pixel area) means that the sensor is able to discern smaller objects. By adding up the number of pixels in an image, you can calculate the area of a scene. For example, if you count the number of green pixels in a false color image, you can calculate the total area covered with vegetation.
How does the computer know which parts of the image should be dark and which one should be bright? Computers understand the numeric language of binary numbers, which are sets of numbers consisting of 0s and 1s that act as an "on-off" switch. Converting from our decimal system to binary numbers, 00 = 0, 01 = 1, 10 = 2, 11 = 3. Note that we cannot use decimal numbers since all computers are fussy—they only like "on" and "off."
For example, consider an image that is made up of 8 columns by 5 rows of pixels. In this figure, four shades are present: black, dark gray, light gray and white. The darkest point is assigned the binary number 00, dark gray as 01, light gray as 10, and the brightest part the binary number 11. We therefore have four pixels (B5, C4, D7 and E2) that the spacecraft says are 00. There are three dark gray pixels (B3, C2, C6 and E6) assigned the binary number 01, three light gray pixels (D3, D6 and E5) that are binary number 10, and 29 white pixels are assigned the binary number 11.
Four shades between white and black would produce images with too much contrast, so instead of using binary numbers between 00 and 11, spacecraft use a string of 8 binary numbers (called "8-bit data"), which can range from 00000000 to 11111111. These numbers correspond from 0 to 255 in the decimal system. With 8-bit data, we can assign the darkest point in an image to the number 00000000, and the brightest point in the image to 11111111. This produces 256 shades of gray between black and white. It is these binary numbers between 0 and 255 that the spacecraft sends back for each pixel in every row and column—and it takes a computer to keep track of every number for every pixel!
Color Images
Another essential ingredient in most remote sensing images is color. While variations in black and white imagery can be very informative, the number of different gray tones that the eye can separate is limited to about 20 to 30 steps (out of a maximum of about 200) on a contrast scale. On the other hand, the eye can distinguish 20,000 or more color tints, enabling small but often important variations within the target materials or classes to be discerned.
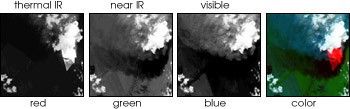
Since different bands (or wavelengths) have a different contrast, computers can be used to produce a color image from a black and white remote sensing data set. Remember, satellites record the reflected and emitted brightness in the different parts of the spectrum, as is demonstrated in the figure above.
Similar to the screen on a color television set, computer screens can display three different images using blue light, green light and red light. The combination of these three wavelengths of light will generate the color image that our eyes can see. This is accomplished by displaying black and white satellite images corresponding to various bands in either blue, green, or red light to achieve the relative contrast between the bands. Finally, when these three colors are combined, a color image—called a "false color image"—is produced (it's called "false color" because colors are assigned that we can see and easily interpret with our eyes).
In order to understand what the colors mean in the satellite image, we must know which band (or wavelength) is used for each of the blue, green and red parts of the computer display. Without detailed knowledge of how each band has been changed for contrast and brightness, we cannot be sure why the colors are what they are.
Remote Sensing Methods
There are two types of remote sensing instruments—passive and active. Passive instruments detect natural energy that is reflected or emitted from the observed scene. Passive instruments sense only radiation emitted by the object being viewed or reflected by the object from a source other than the instrument. Reflected sunlight is the most common external source of radiation sensed by passive instruments. Scientists use a variety of passive remote sensors.
Radiometer
An instrument that quantitatively measures the intensity of electromagnetic radiation in some band of wavelengths in the spectrum. Usually a radiometer is further identified by the portion of the spectrum it covers; for example, visible, infrared, or microwave.
Imaging Radiometer
A radiometer that includes a scanning capability to provide a two-dimensional array of pixels from which an image may be produced is called an imaging radiometer. Scanning can be performed mechanically or electronically by using an array of detectors.
Spectrometer
A device designed to detect, measure, and analyze the spectral content of the incident electromagnetic radiation is called a spectrometer. Conventional, imaging spectrometers use gratings or prisms to disperse the radiation for spectral discrimination.
Spectroradiometer
A radiometer that can measure the intensity of radiation in multiple wavelength bands (i.e., multispectral). Oftentimes the bands are of a high spectral resolution—designed for the remote sensing of specific parameters such as sea surface temperature, cloud characteristics, ocean color, vegetation, trace chemical species in the atmosphere, etc.
Active instruments provide their own energy (electromagnetic radiation) to illuminate the object or scene they observe. They send a pulse of energy from the sensor to the object and then receive the radiation that is reflected or backscattered from that object. Scientists use many different types of active remote sensors.
Radar (Radio Detection and Ranging)
A radar uses a transmitter operating at either radio or microwave frequencies to emit electromagnetic radiation and a directional antenna or receiver to measure the time of arrival of reflected or backscattered pulses of radiation from distant objects. Distance to the object can be determined since electromagnetic radiation propagates at the speed of light.
Scatterometer
A scatterometer is a high frequency microwave radar designed specifically to measure backscattered radiation. Over ocean surfaces, measurements of backscattered radiation in the microwave spectral region can be used to derive maps of surface wind speed and direction.
Lidar (Light Detection and Ranging)
A lidar uses a laser (light amplification by stimulated emission of radiation) to transmit a light pulse and a receiver with sensitive detectors to measure the backscattered or reflected light. Distance to the object is determined by recording the time between the transmitted and backscattered pulses and using the speed of light to calculate the distance traveled. Lidars can determine atmospheric profiles of aerosols, clouds, and other constituents of the atmosphere.
Laser Altimeter
A laser altimeter uses a lidar (see above) to measure the height of the instrument platform above the surface. By independently knowing the height of the platform with respect to the mean Earth's surface, the topography of the underlying surface can be determined.
NASA Remote Sensing Accomplishments
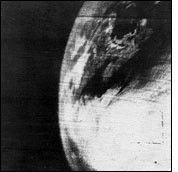
Beginning with the April 1, 1960 launch of the Television and Infrared Observation Satellite (TIROS 1), which proved that satellites can observe Earth's weather patterns, NASA has been studying the global perspective of our environment. Other NASA accomplishments in observing the Earth include:
1966: Environmental Science Services Administration (ESSA) I and II gave the United States its first global weather satellite system.
1972: NASA began the Landsat series with the launch of the Earth Resources Technology Satellite 1, which was later renamed Landsat 1.
1975: The Synchronous Meteorological Satellites (SMS)-A, the first spacecraft to observe the Earth from geosynchronous orbit, and SMS-B started producing cloud cover pictures every 30 minutes for weather forecasters.
1976: Laser Geodynamic Satellite I (LAGEOS 1) provided scientists with the ability to track very precisely the movements of the Earth's surface, increasing our understanding of earthquakes and other geological activity.
1978: The Heat Capacity Mapping Mission (HCMM) satellite demonstrated the ability to measure variations in the Earth's temperature from space, paving the way for future climate studies.
1978: Seasat demonstrated techniques for global monitoring of the Earth's oceans.
1978: Nimbus 7, the final satellite in that series, was launched carrying a Total Ozone Mapping Spectrometer (TOMS) instrument that provided 14 years of data on the Earth's ozone layer. Data from the TOMS were part of the scientific basis for the Montreal Protocol and other treaties banning the manufacture and use of ozone-depleting chemicals. In addition, Nimbus 7's Coastal Zone Color Scanner (CZCS) obtained a data set that is widely used to study the links between the oceans' biology and the Earth's climate.
1984: The Earth Radiation Budget (ERBE) satellite began its study of how the Earth absorbs and reflects the Sun's energy.
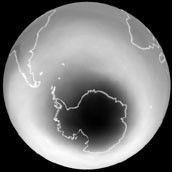
1991: The Upper Atmosphere Research Satellite (UARS) began its study of the chemistry and physics of the Earth's atmosphere. UARS data are used to create global maps of ozone-destroying chemicals and to understand the processes related to ozone depletion better. By 1994, UARS' comprehensive data set provided conclusive evidence that human-made chemicals are responsible for the annual Antarctic ozone depletion.
1992: Data from the U.S.-French TOPEX/Poseidon satellite began to detail the links between the Earth's ocean and climate. By 1994, TOPEX data indicated that the Earth's average global sea level had risen in the two previous years.
Spring 1992: The first Atmospheric Laboratory for Applications and Science (ATLAS) flew on the Space Shuttle Atlantis. The mission carried fourteen experiments to study the chemistry of the Earth's upper atmosphere and the Sun's energy, and the effect of those two elements on ozone levels. Two additional ATLAS payloads were carried on subsequent shuttle missions in 1993 and 1994.
1994: The Space Radar Laboratory, which flew on two shuttle missions, demonstrated the uses of a complex radar to study the Earth's surface, with applications in ecology, geology, water-cycle studies, and other areas. Related research released in 1996 shed new light on the Great Wall of China and the geological history of the Nile River.
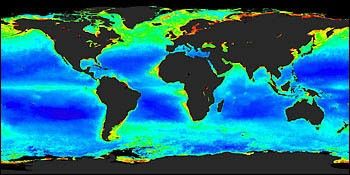
1997: The Sea-viewing Wide-field-of-view sensor, the only sensor onboard the OrbView-2 satellite, was launched into low-Earth orbit from a Pegasus rocket attached to the belly of a modified Lockheed L-1011 aircraft. Data gathered from SeaWiFS is helping scientists identify oceanic "hot spots" of biological activity, measure global phytoplankton biomass, and estimate the rate of oceanic carbon uptake. This information will yield a better understanding of the sources and sinks in the carbon cycle and the processes that shape global climatic and environmental change.
1997: NASA, along the National Space Development Agency of Japan, launched the Tropical Rainfall Measuring Mission (TRMM) from the Tanegashima Space Center in Japan. TRMM houses five separate instruments including the first-ever precipitation radar to fly in space. Designed to help our understanding of the role that the water cycle plays in the current climate system, TRMM is providing much-needed data on rainfall and the associated heat released during the condensation-precipitation process in the tropics and sub-tropics.
1999: The latest mission in the Landsat series—Landsat 7—launched from Vandenberg Air Force Base. Landsat 7 is continuing the flow of global change information to users worldwide. Scientists use the Landsat satellites to gather remotely-sensed images of the land surface and surrounding coastal regions for global change research, regional environmental change studies, and other civil and commercial purposes.
1999: The QuikSCAT satellite was launched from Vandenberg Air Force Base atop a U.S. Air Force Titan II launch vehicle. QuikSCAT houses a scatterometer called SeaWinds that is being used to acquire all-weather, high-resolution measurements of near-surface winds over the Earth's oceans. These data will be combined with measurements from scientific instruments in other disciplines to help us better understand the mechanisms of global climate change and weather patterns.
Beginning in late 1999, NASA will launch the Terra satellite (formerly EOS AM-1), the flagship of the Earth Observing System (EOS)—a series of spacecraft that represent the next landmark steps in NASA's leadership role to observe the Earth from the unique vantage point of space. Focused on key measurements identified by a consensus of U.S. and international scientists, Terra will enable new research into the ways that Earth's lands, oceans, air, ice, and life function as a total environmental system. Terra is scheduled to launch from Vandenberg Air Force Base, California.
References
Virtually Hawaii
NASA Observatorium
NASA's Earth Science Enterprise CD-ROM (NP-1999-01-005-GSFC)
Earth Observatory story by Steve Graham