


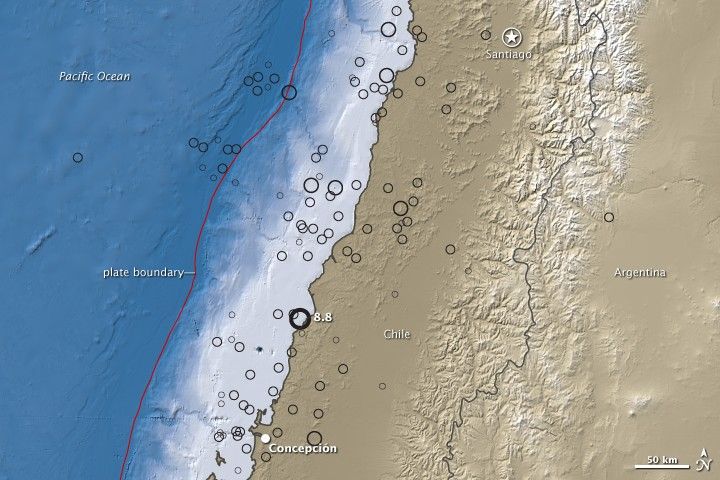
The west coast of South America is a subduction zone, where the Nazca Plate is plowing under the South America Plate at an average rate of 80 millimeters (3 inches) per year. Their collision gives rise to the spectacular Andes Mountains as well as to devastating earthquakes, such as the 8.8-magnitude quake that struck offshore to the north-northeast of Concepción on February 27, 2010.
This map of topography and water depth reveals subduction’s influence on the landscape. Lighter colors indicate higher elevation on land and shallower depth in the water. Quake locations and magnitudes are indicated by black circles. The topography is based on radar data collected during the Shuttle Radar Topography Mission, which flew onboard Space Shuttle Endeavour in mid-February 2002.
The boundary where the two plates converge is marked by a red line, but even without the line, its location would be revealed by the trench located about 100 kilometers (62 miles) offshore. The trench occurs where the Nazca Plate begins its descent beneath the South America Plate. The trench is most sharply defined on the eastern (continental) side: depth plunges rapidly from a few hundred meters (light blue) to several thousand meters (deep blue).
In places along their boundary, the two plates may slide easily past each other, but in other locations, they become locked together for a time. Eventually the pressure is too great for the rocks to withstand, and they break. The plates lurch past each other violently: an earthquake. When large quakes occur underwater, the seafloor may heave or sink. The ground movement is what triggers a tsunami.
The Chilean coast has a long history of very large earthquakes. In fact, the February 27 quake occurred about 230 kilometers (140 miles) north of the strongest earthquake ever measured: a magnitude 9.5 event that occurred in 1960. A magnitude 8.5 quake occurred about 870 kilometers (540 miles) farther north in 1922.
References & Resources
- U.S. Geological Survey. (n.d.). Magnitude 8.8 - OFFSHORE MAULE, CHILE. Earthquake Hazards Program. Retrieved March 1, 2010.
NASA Earth Observatory image created by Jesse Allen, using earthquake and plate tectonics data from the USGS Earthquake Hazard Program, elevation data from the Shuttle Radar Topography Mission (SRTM) provided by the University of Maryland’s Global Land Cover Facility, and ocean bathymetry data from the British Oceanographic Data Center’s Global Bathmetric Chart of the Oceans (GEBCO). Caption by Rebecca Lindsey.
None