


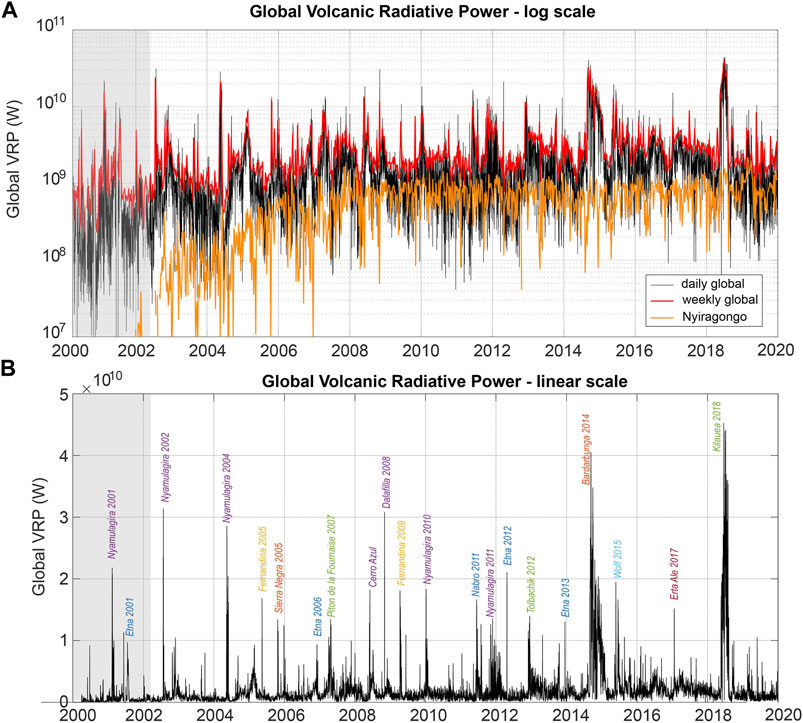
Of the hundreds of active volcanoes that NASA satellites have observed since the early 2000s, Kīlauea stands out. It's one of the world's leading emitters of thermal infrared energy, according to observations from the Aqua and Terra satellites. (Other top emitters include Bárðarbunga in Iceland and the Democratic Republic of the Congo's Nyiragongo.)
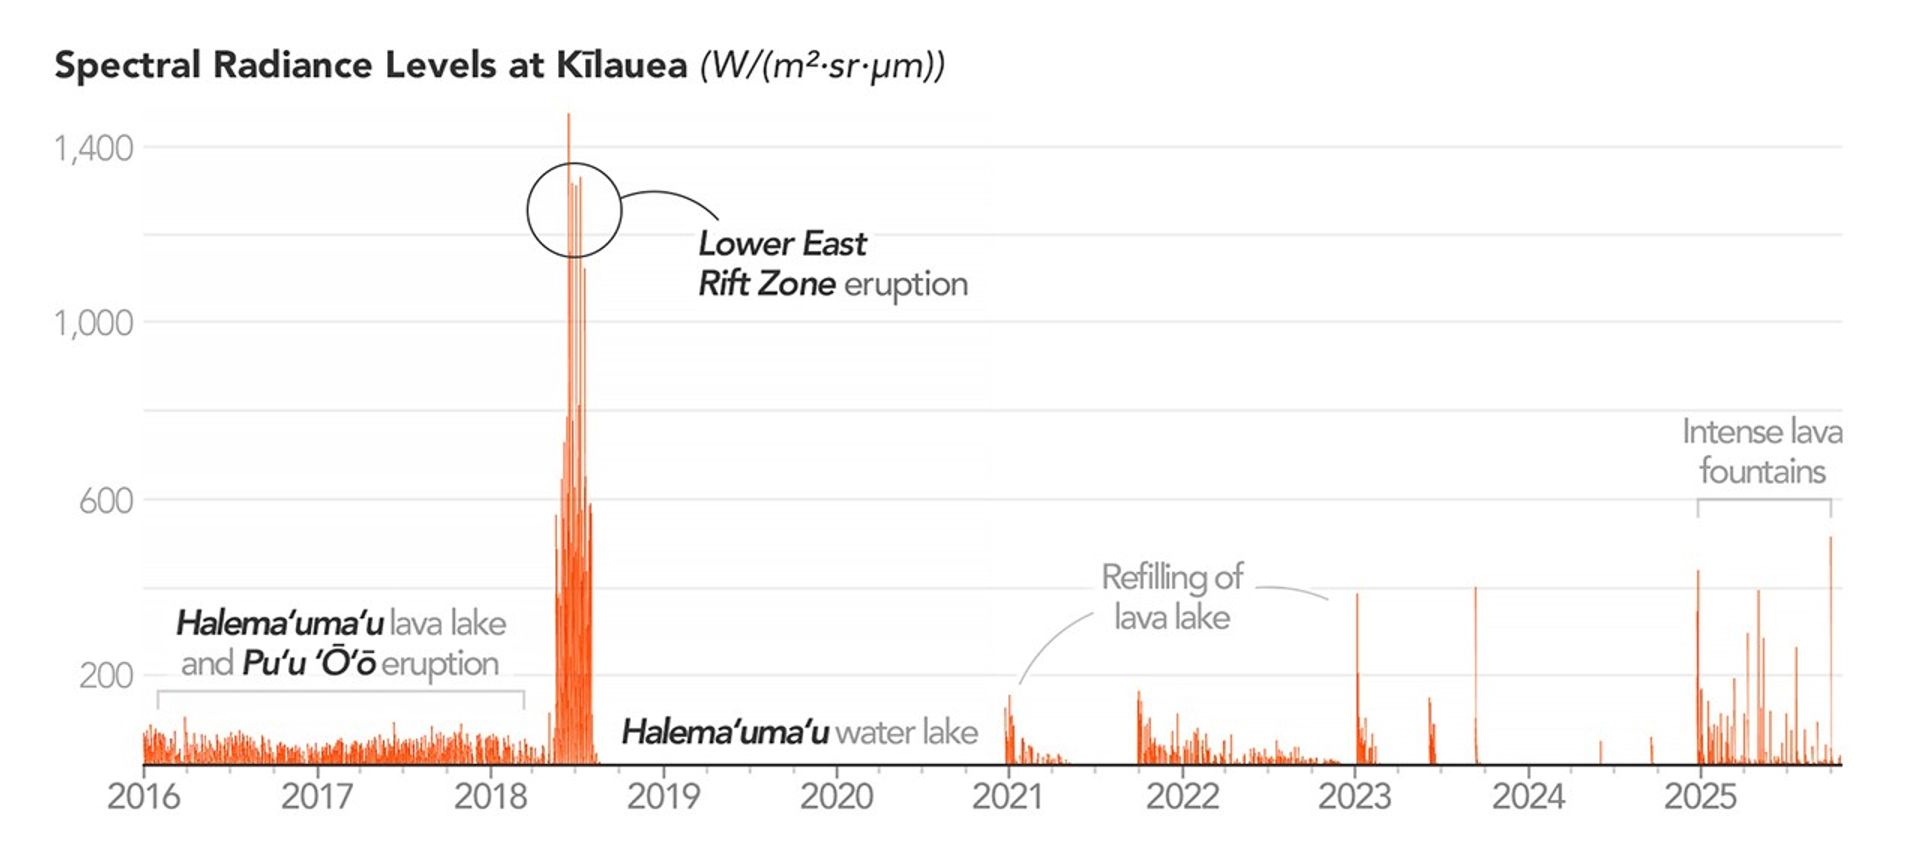
This chart shows the volcano's daily average spectral radiance from 2016 to 2025, underscoring its frequent activity and variability. The chart draws on data from MODVOLC, an automated volcano monitoring system developed by scientists at the University of Hawai'i. The system processes observations of all the world's volcanoes from MODIS (Moderate Resolution Imaging Spectroradiometer) sensors and detects thermal anomalies, or "hot spots," on a daily basis. Here, Kīlauea's spectral radiance is shown, depicting the amount of energy emitted in a specific direction, from a specific area, at a specific wavelength.
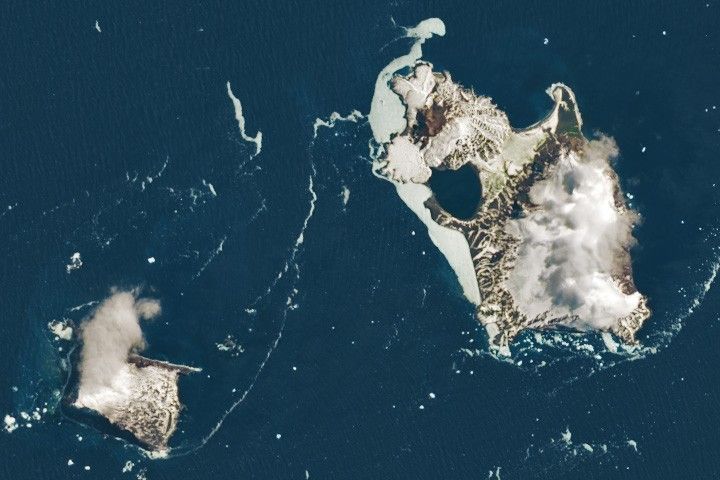
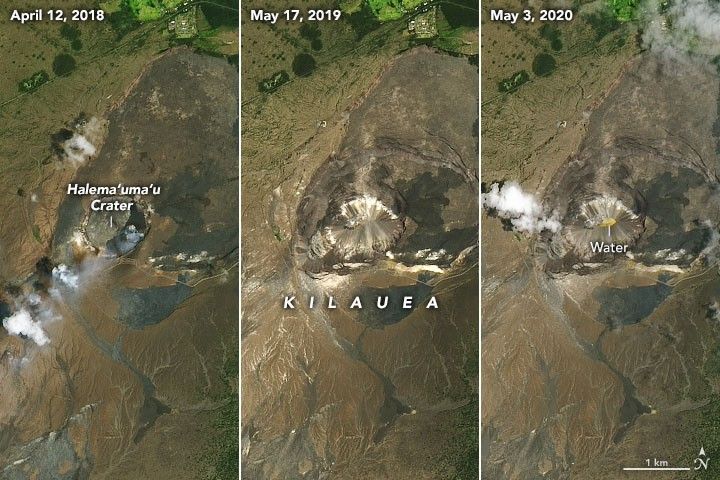
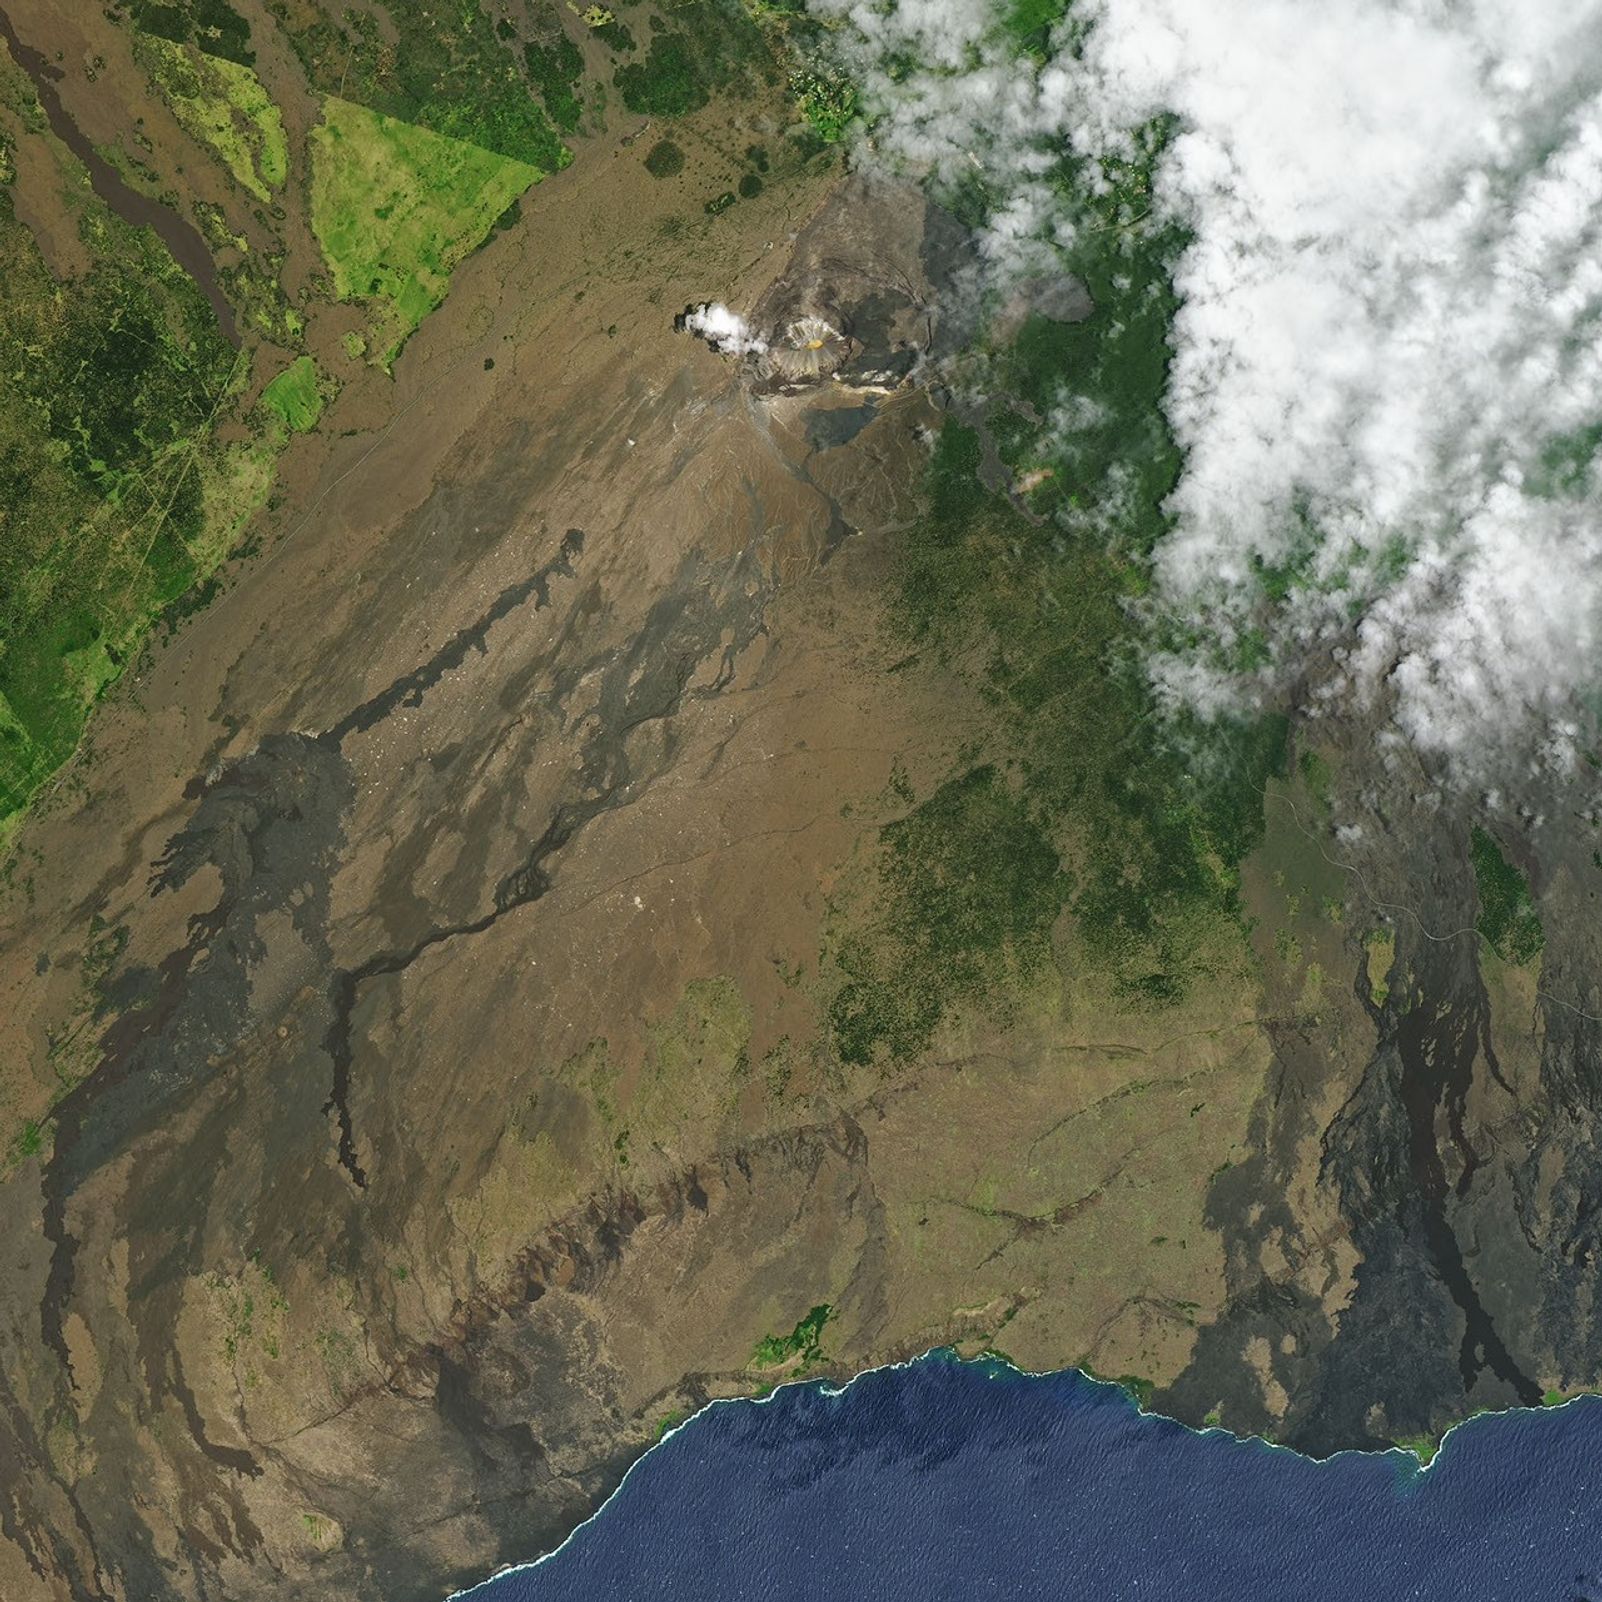
From 2016 to 2018 (left side of the chart), Kīlauea showed low but continuous activity due to relatively gentle, long-lived eruptions at two separate vents. At Halema‘uma‘u (below), the summit crater, a previously unstable lava lake had stabilized and grown to cover about 42,000 square meters (452,000 square feet). This made it the world's second-largest lava lake, surpassed only by Nyiragongo's. Kīlauea's lava lake frequently sloshed, spattered, and sometimes overflowed, sending lava across the crater floor and producing many low-level thermal anomalies.
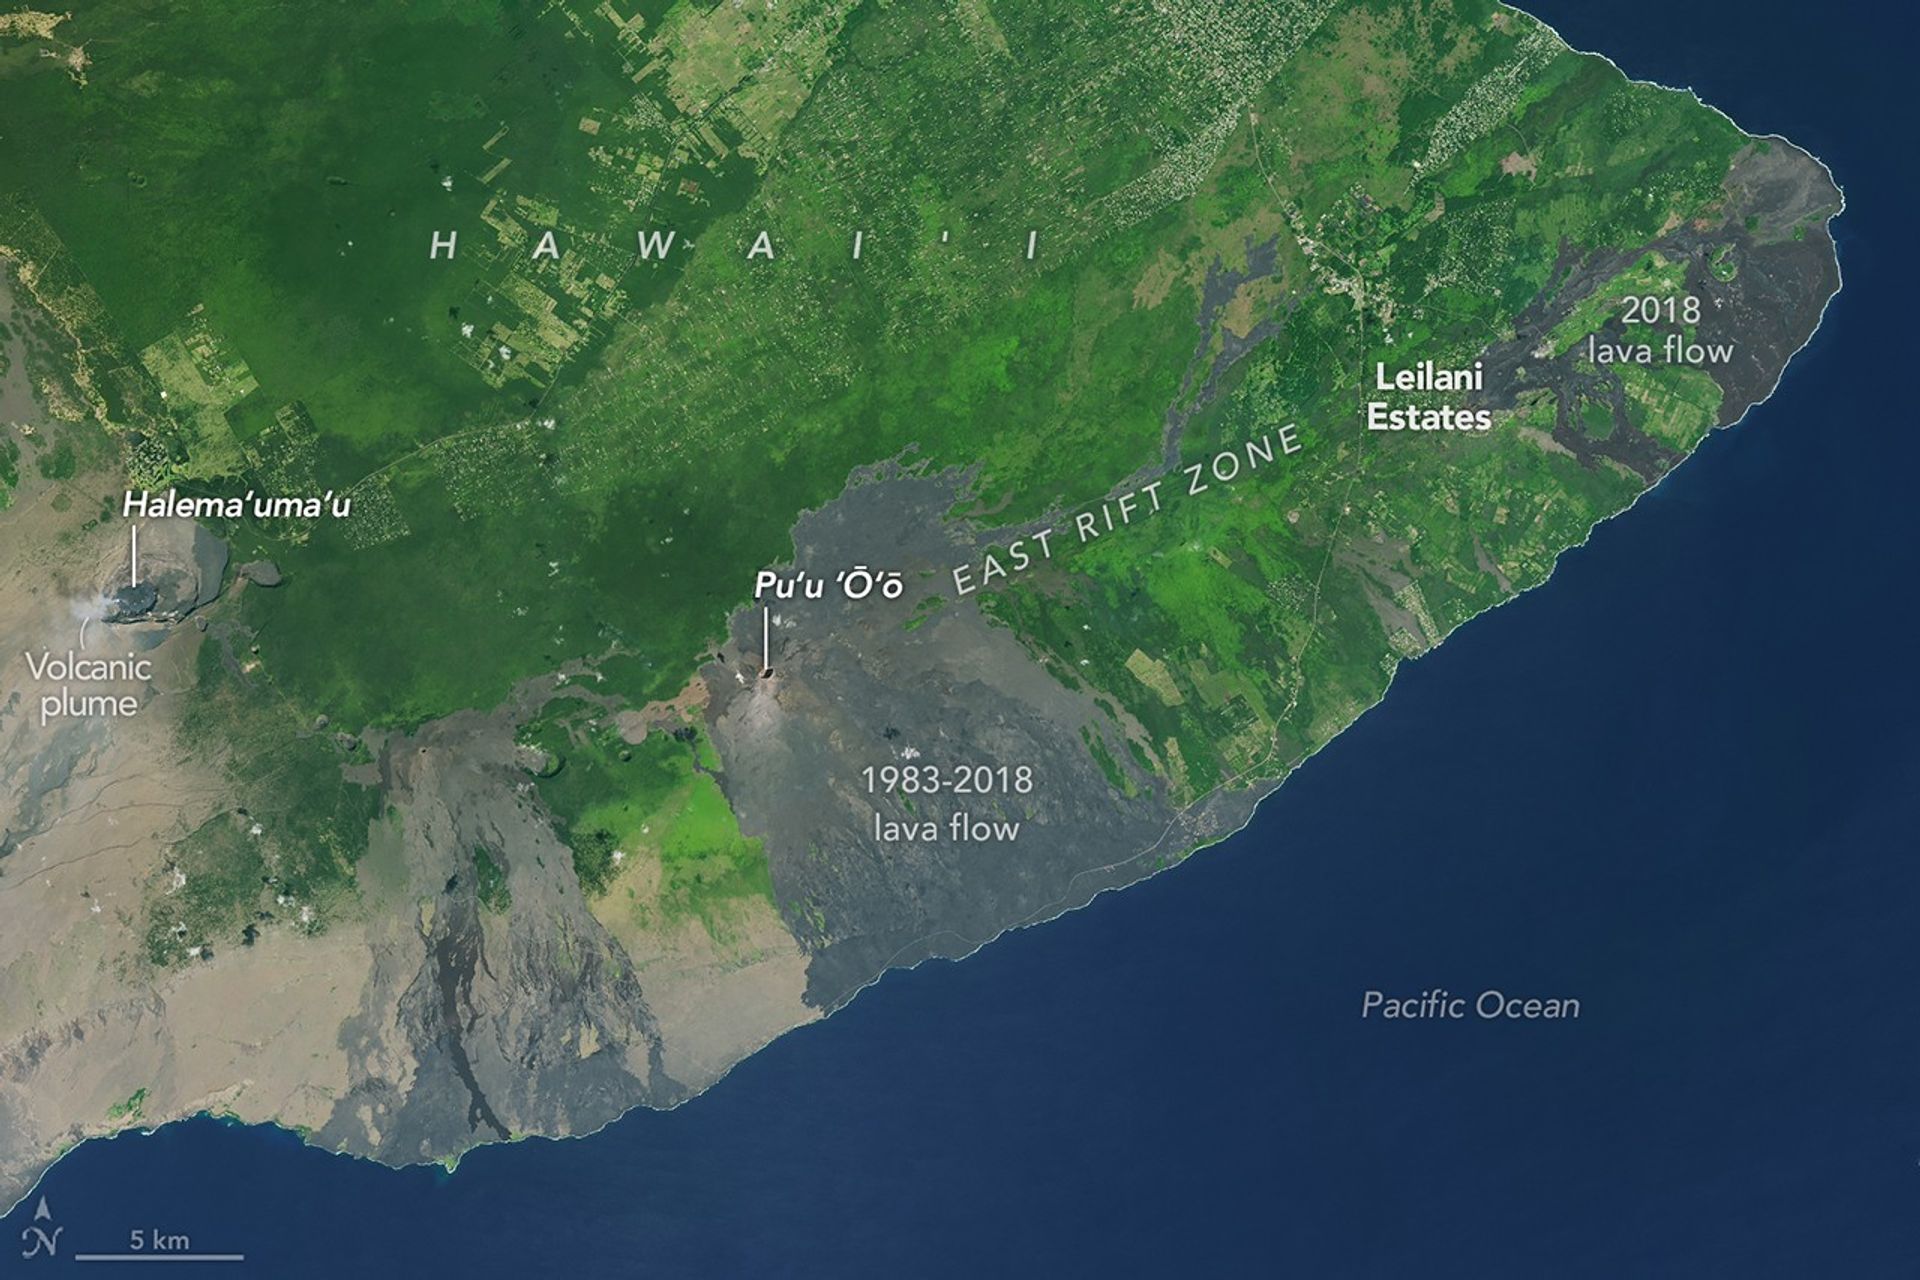
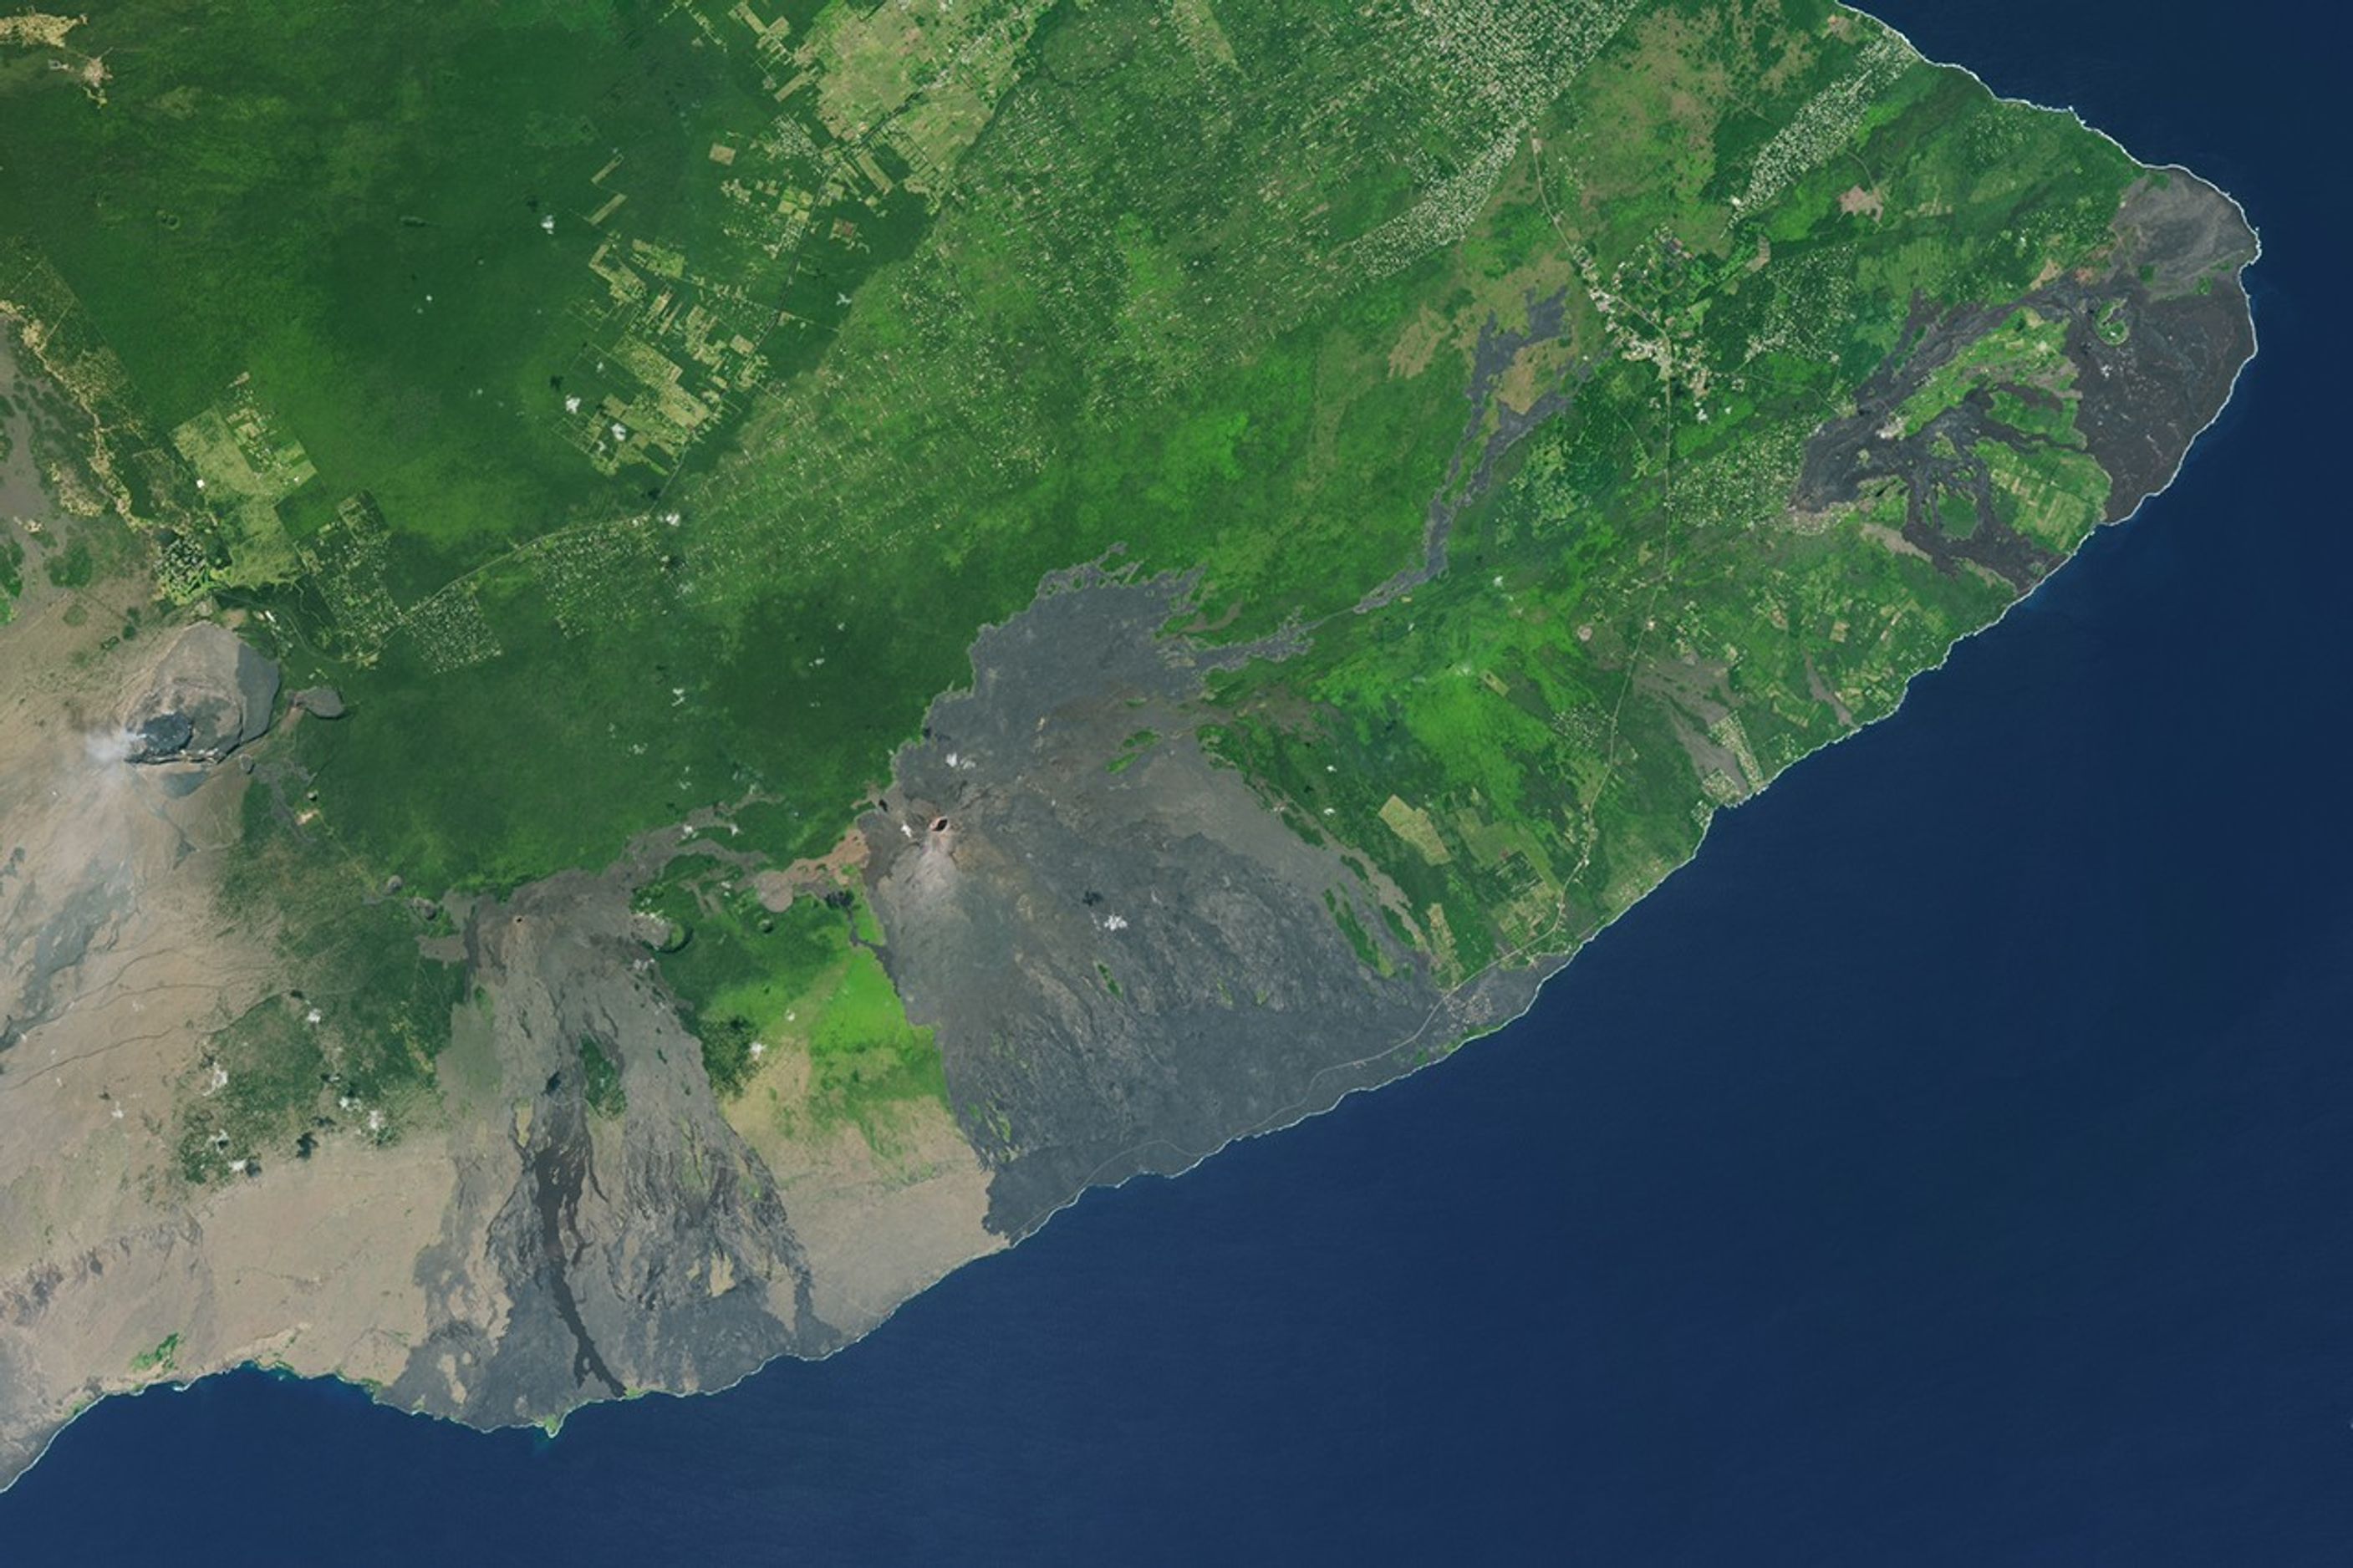
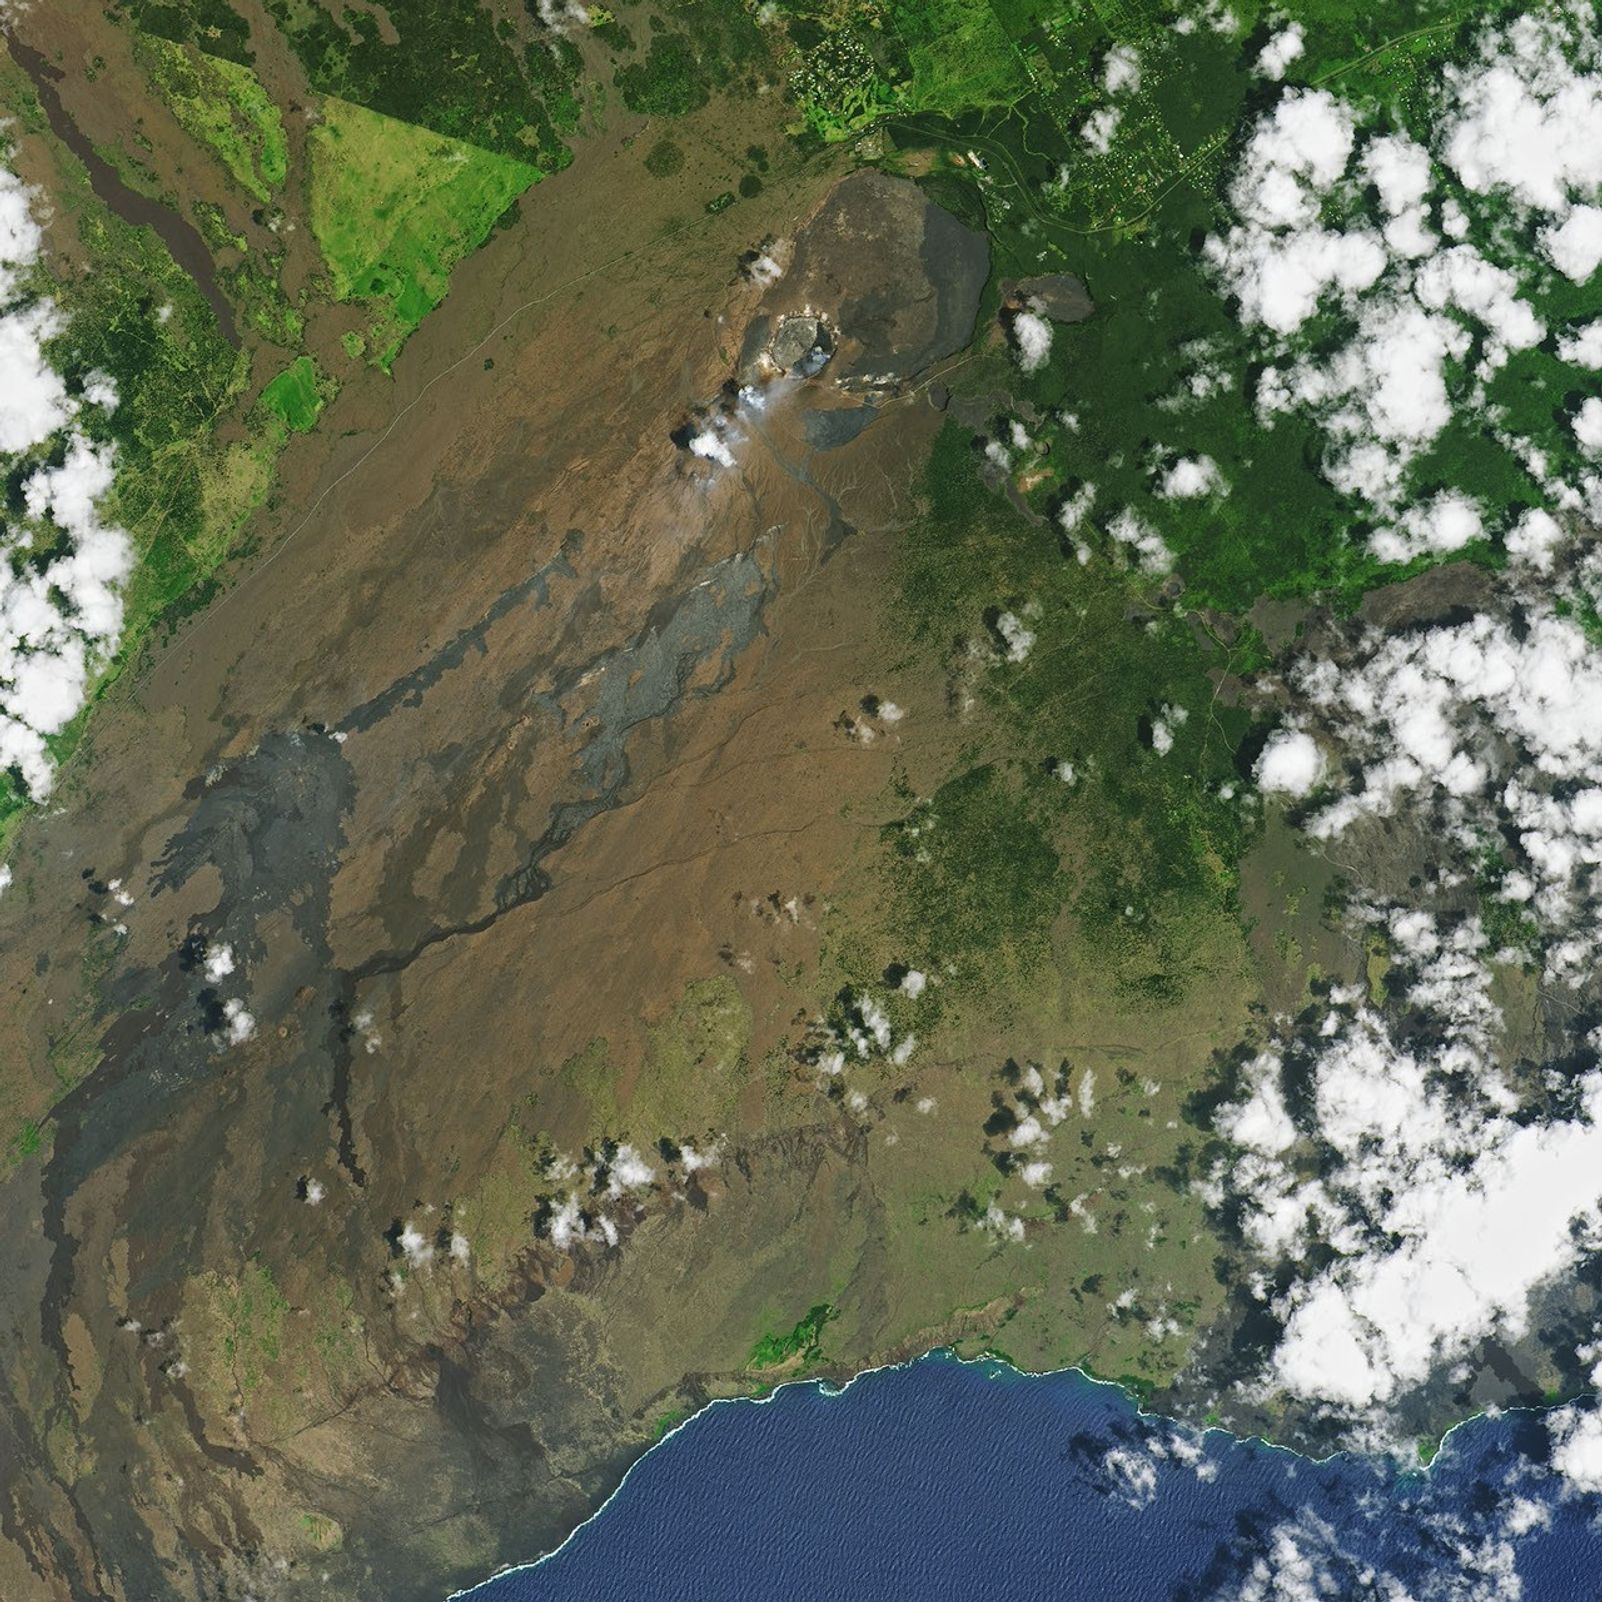
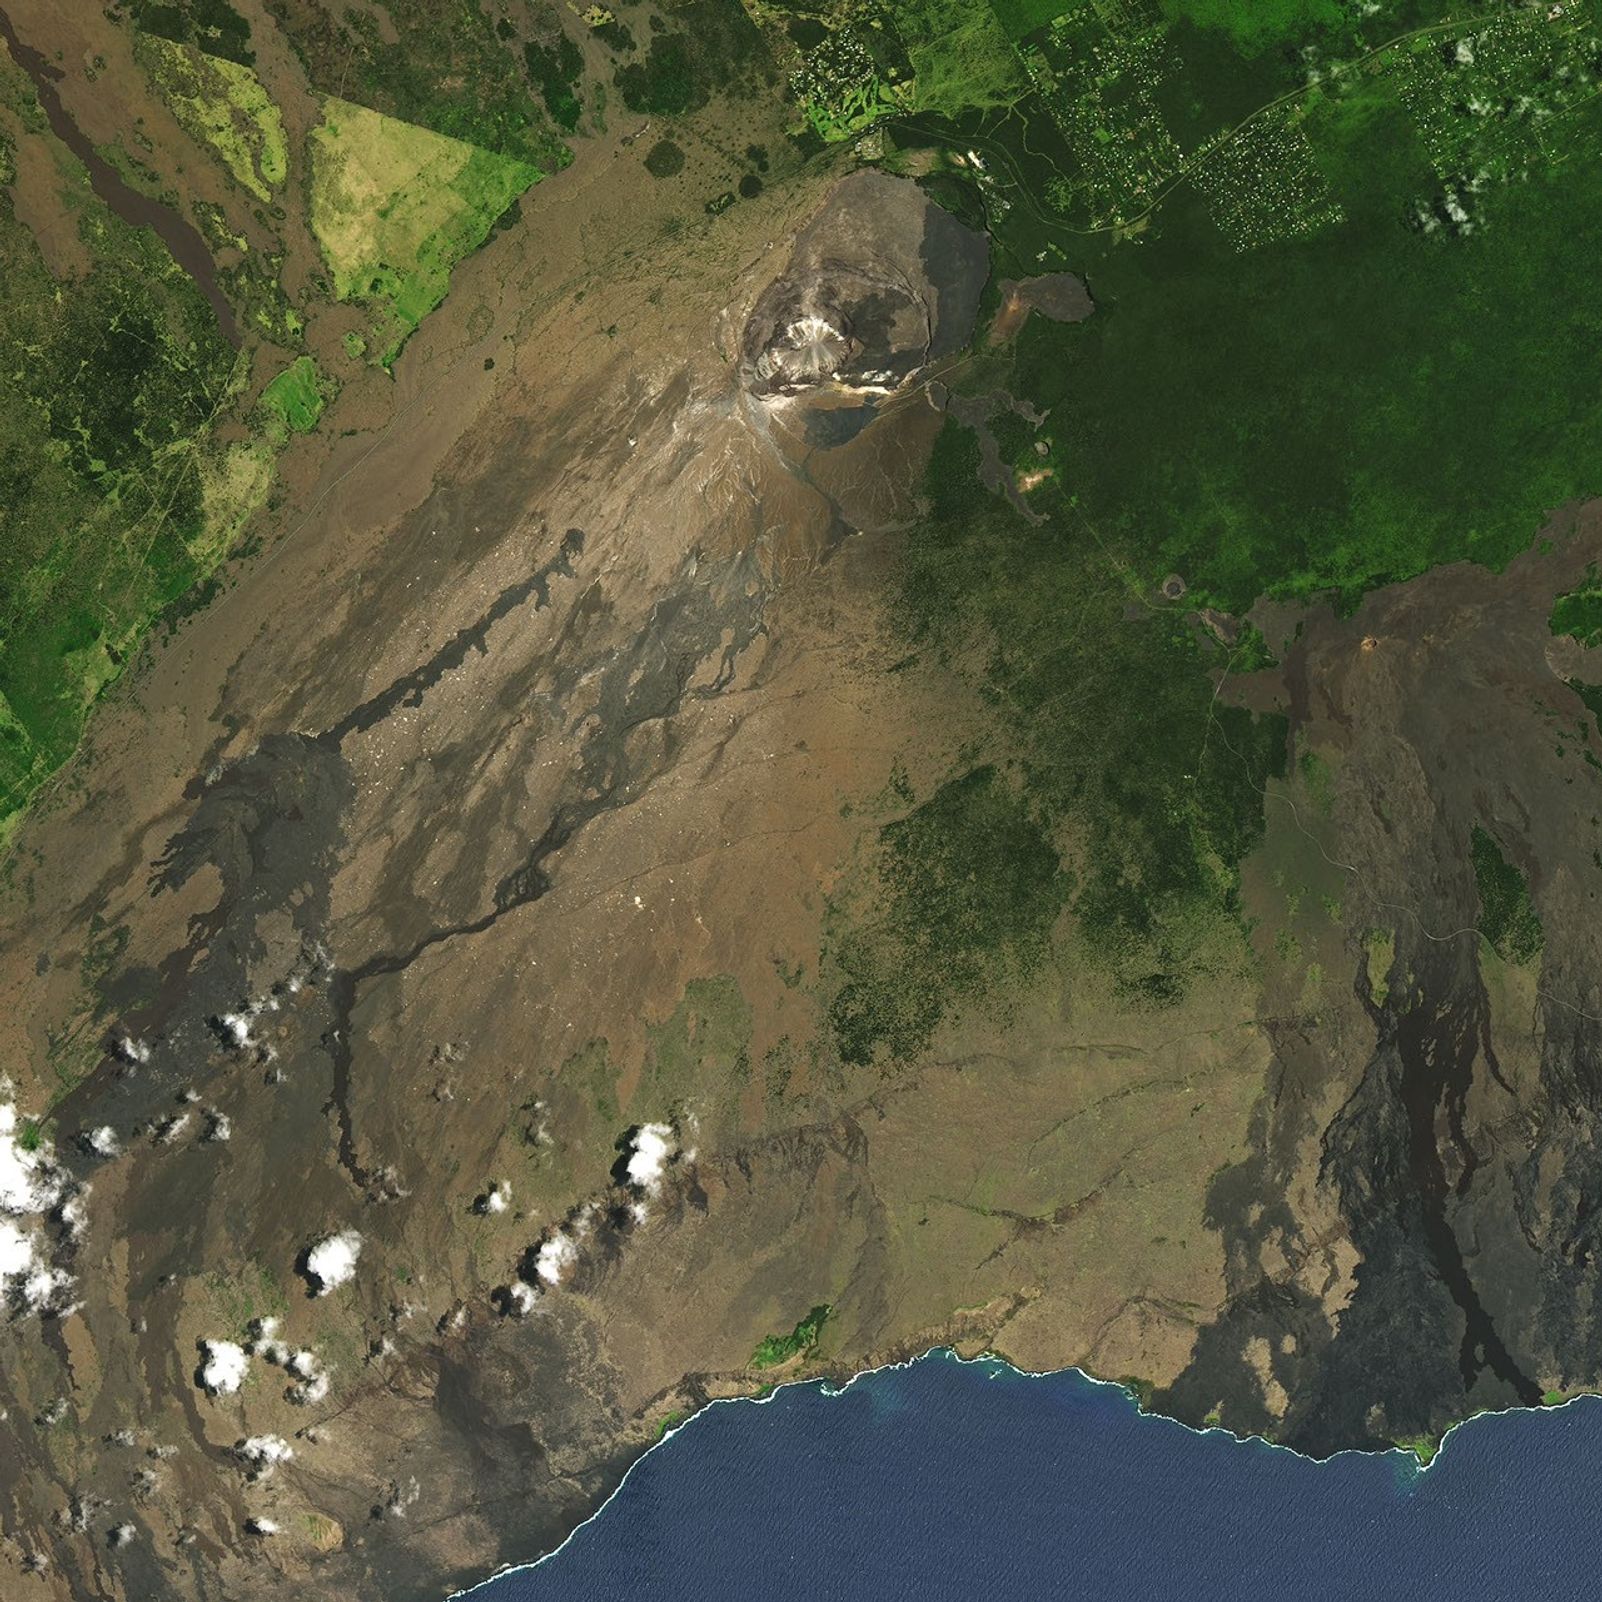
At the same time, lava poured from Puʻu ʻŌʻō (above), a cone farther down the mountain in the East Rift—a geologically active area where eruptions are most likely. In this period, lava spilling from Puʻu ʻŌʻō sometimes formed "breakout" flows that drained all the way to the coastline and built a delta at Kamokuna as lava entered the sea.
On April 30, 2018, the situation changed abruptly. Signaling the end of Kīlauea's longest and most voluminous known outpouring of lava in 500 years, Puʻu ʻŌʻō's crater floor collapsed, and Puʻu ʻŌʻō stopped erupting. Magma moved through underground conduits farther east into the Lower East Rift Zone (LERZ) rather than flowing south down the hillside and into the sea, as it had since 1983. A few days later, the ground split open in Leilani Estates, and lava flows bulldozed and burned whole neighborhoods in the densely populated subdivision.

By the time the three-month LERZ eruption wound down, an outpouring of more than 320,000 Olympic-sized pools of lava had destroyed 700 homes and caused up to $1 billion in economic losses. So much lava spread across the surface at once that the eruption pushed the volcano's spectral radiance to more than ten times the 2016 baseline. That was enough to cause a large spike in Earth's total thermal emissions from volcanoes, according to one global analysis from researchers based in Italy.
After the big 2018 LERZ eruption, Kīlauea was quiet for a few years. In 2019, a new water lake formed (below) in the area where Halema‘uma‘u's lava lake had existed, and it slowly deepened until December 2020, when a new eruption at the summit quickly boiled off the water. Over the next three years, a series of five small eruptions in Halema‘uma‘u gradually refilled the lava lake.
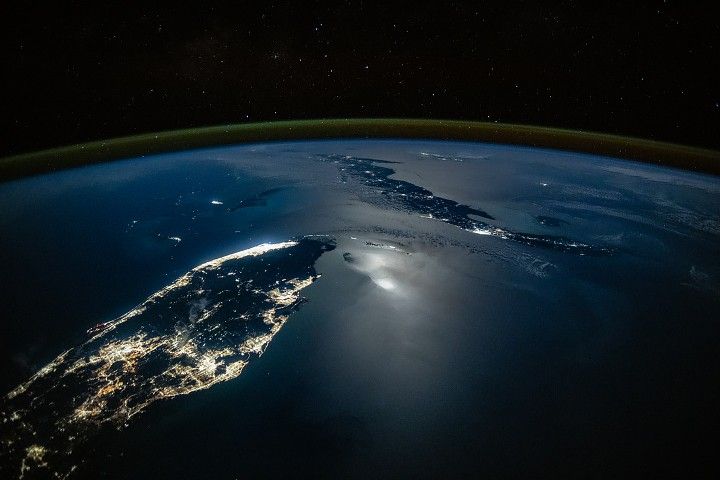
Then, starting in December 2024 (below), events took an unexpected turn. Even more intense surges of activity began to occur in Halema‘uma‘u every few weeks, usually in the form of huge lava fountains that lasted for several hours, contributing to the spikes on the right side of the chart.
One recent eruptive episode, the 37th since December 2024, produced fountains that soared up to 1,000 feet (300 meters), while plumes of particles and volcanic gases swirled into "volnados" that wowed onlookers in November 2025. On December 6, 2025, the 38th episode produced a lava fountain that sprayed beyond Halemaʻumaʻu's rim and destroyed a U.S. Geological Survey camera site.
"The height of the fountaining we've started to see at Halema‘uma‘u is amazing," said Ian Flynn, a volcanologist at the University of Pittsburgh. Scientists are seeing a surge in volatile-rich magma coming from the volcano since December 2024. This means the magma has more dissolved gases, causing it to rise and "fizz" as it erupts from the surface, much like a shaken bottle of soda, he added. According to MODVOLC data, these frequent spikes in activity often push Kīlauea's spectral radiance to double or triple the baseline levels prior to the 2018 eruption.

It's unclear what Kīlauea's future will bring. For the past 200 years, relatively gentle effusive eruptions have dominated, but the geologic record makes clear that Kīlauea cycles into periods of more explosive eruptions, as occurred between 1500 and 1800, when groundwater mixed with magma and made eruptions much more violent.
It is unknown when a similar transition will occur, but whatever happens, scientists will analyze how new developments compare to the volcano's past behavior. Such analysis would be impossible without decades of thermal observations from MODIS and data processing systems like MODVOLC and MIROVA (the Near Real Time Volcanic Hot Spot Detection System), a similar tool developed at the University of Turin. These tools allow researchers and anyone else to freely access and analyze thermal activity observed by MODIS for all the world's active volcanoes.
As Terra and Aqua age and grow closer to the end of their missions, both the MODVOLC and MIROVA teams are updating their systems to ingest data from a newer generation of sensors called VIIRS (Visible Infrared Imaging Radiometer Suite) to ensure that they can continue building long-term datasets for individual volcanoes.
"Long-term datasets and monitoring tools like these are powerful and absolutely critical," said Flynn. "They make it possible to study, on a global scale, how volcanic activity is changing over long periods and to better predict the thermal precursors of eruptions."
NASA Earth Observatory chart and East Rift Zone image by Michala Garrison, using MODVOLC data from the University of Hawaiʻi at Mānoa and Landsat data from the U.S. Geological Survey. Story by Adam Voiland.
References & Resources
- Coppola, D., et al. (2023) Global radiant flux from active volcanoes: the 2000–2019 MIROVA database. Frontiers of Earth Science, 11, 1240107.
- Eos (2020, September 25) From Lava to Water: A New Era at Kīlauea. Accessed December 8, 2025.
- MIROVA (2025, December 8) Near Real Time Volcanic Hot Spot Detection System. Accessed December 8, 2025.
- MIROVA (2025) Kilauea. Accessed December 8, 2025.
- NASA Earthdata (2020, July 28) Sensing Remote Volcanoes. Accessed December 8, 2025.
- National Park Service (2025) What's Going On With The Volcanoes? Accessed December 8, 2025.
- Scientific American (2025, December 8) Hawaii’s Kilauea Volcano Absolutely Destroys This Webcam in a Fiery New Video. Accessed December 8, 2025.
- Swanson, D., et al. (2012) Keanakākoʻi Tephra produced by 300 years of explosive eruptions following collapse of Kīlauea's caldera in about 1500 CE. Journal of Volcanology and Geothermal Research, (215-216), 8-25.
- The University of Hawaiʻi (2025) MODVOLC. Accessed December 8, 2025.
- U.S. Geological Survey (2025) Kīlauea. Accessed December 8, 2025.
- U.S. Geological Survey (2025) Geology and History of Kīlauea. Accessed December 8, 2025.
- U.S. Geological Survey (2025) Photo & Video Chronology. Accessed December 8, 2025.
- Wright, R., et al. (2004) MODVOLC: near-real-time thermal monitoring of global volcanism. Journal of Volcanology and Geothermal Research, 135(1-2), 29-49.


