


browse image of orbit 14553 (340 KB JPEG)
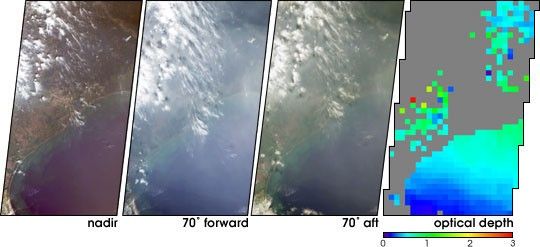
In the year 2000 Houston officially exceeded Los Angeles as the citywith the worst air quality in the United States. Since then, majorresearch has been underway to characterize the type, extent and sourcesof air pollutants in and around Houston. The Multi-angle ImagingSpectroRadiometer (MISR) is participating in work underway to studyHouston’s air quality. These MISR viewsportray Houston and Galveston Bay on September 12, 2002, and displaydata from three of MISR’s nine cameras along with a map ofretrieved aerosol optical thickness.
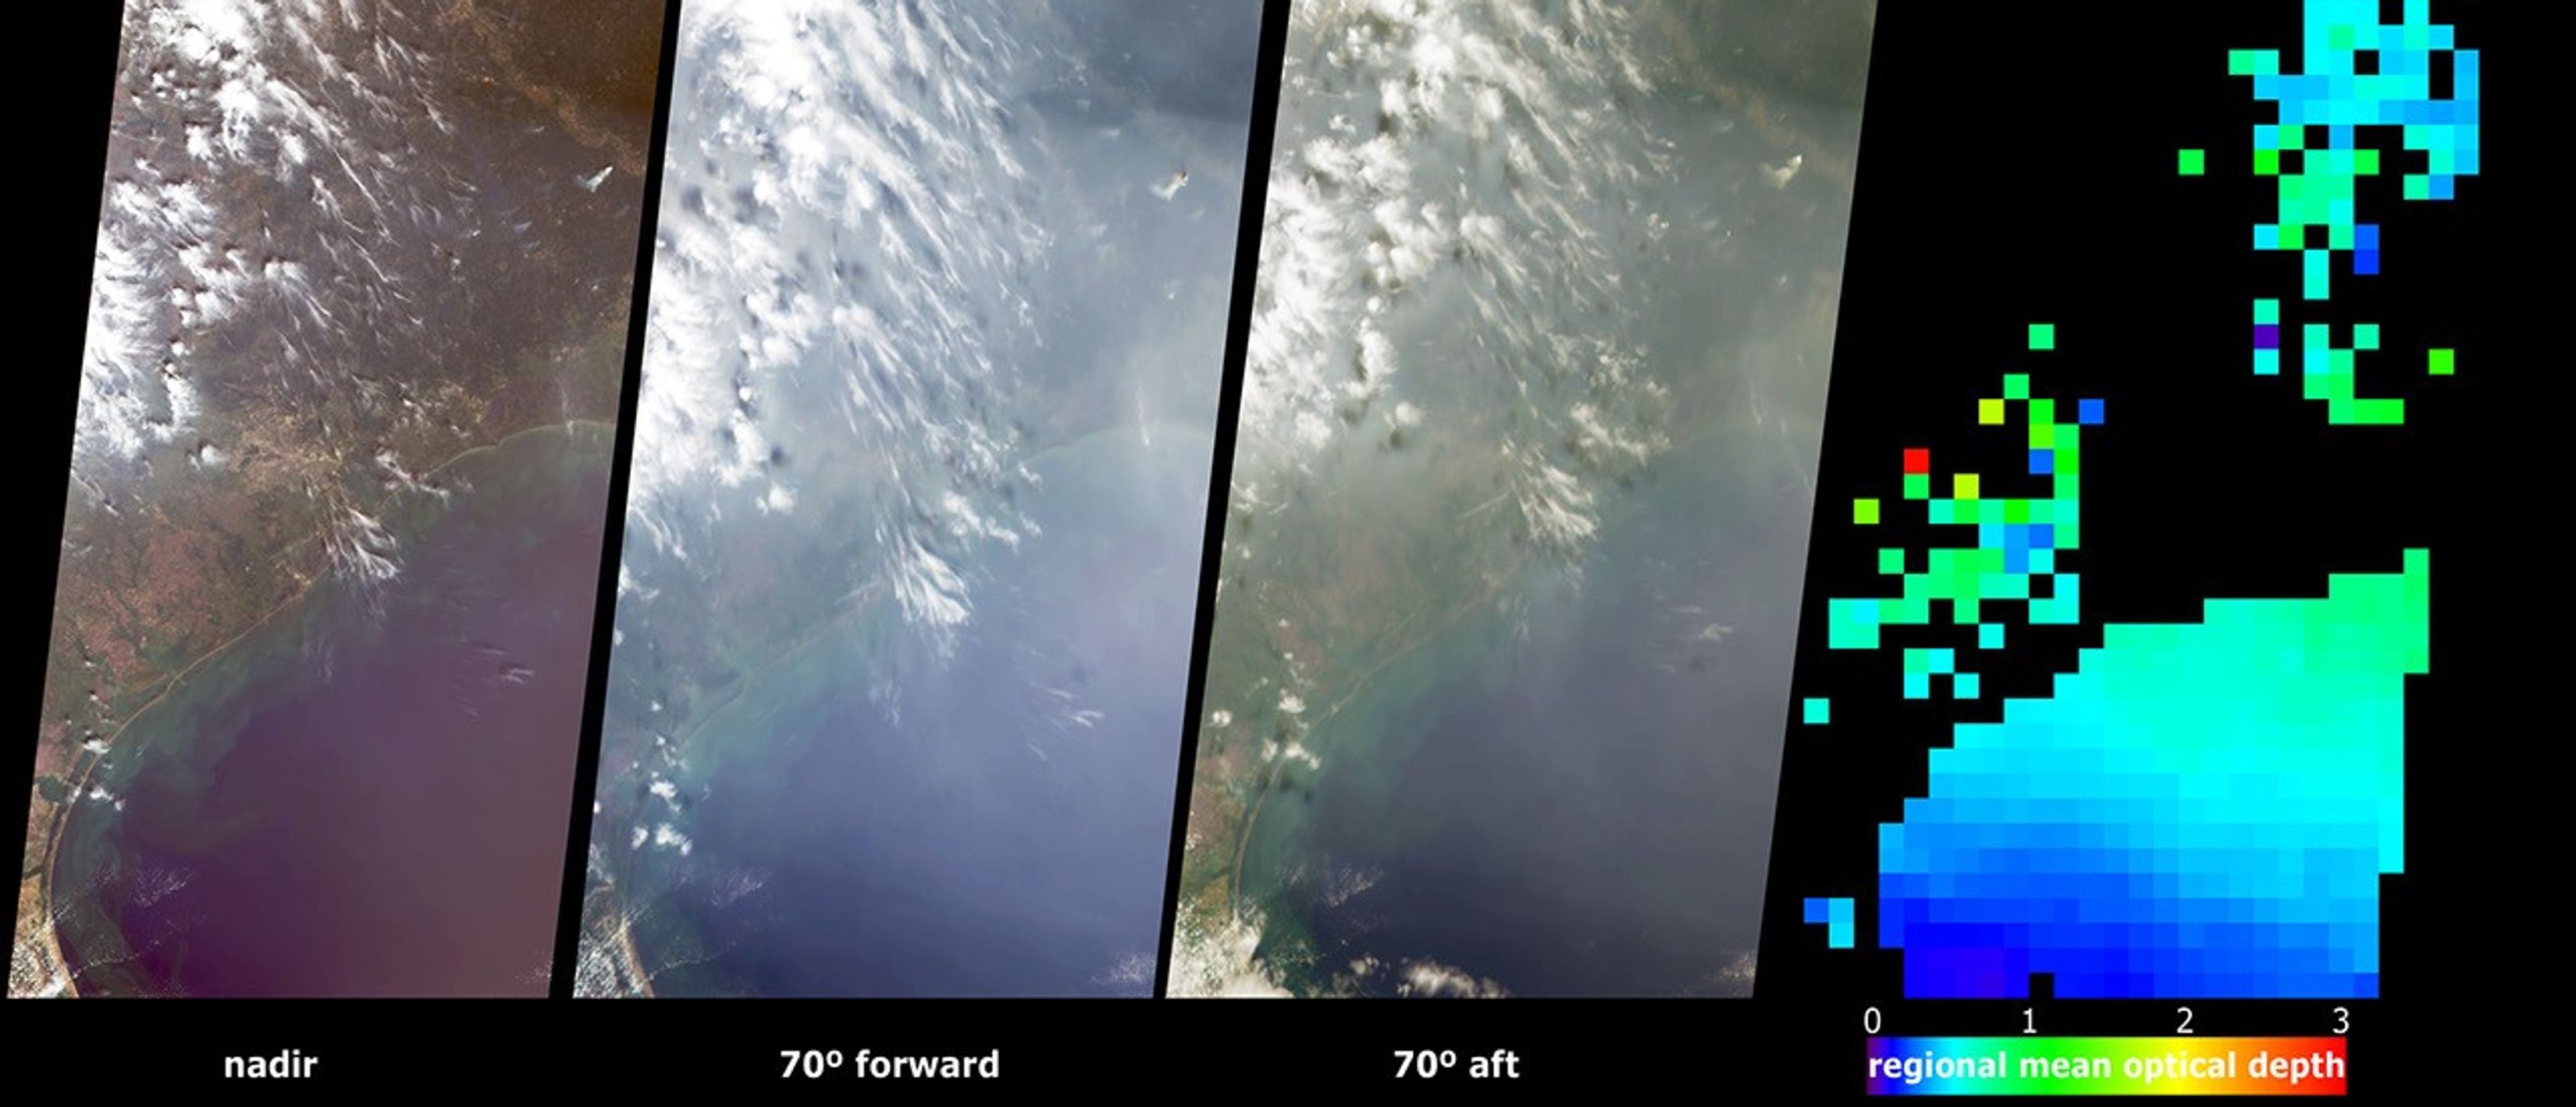
The left-hand panel is a natural-color view from MISR’svertical-viewing (nadir) camera. The center images cover the samegeographic area, from the perspectives of the 70-degree forward-viewingand 70-degree backward viewing cameras. The appearance of haze isenhanced in these oblique views, and the overall area appearssignificantly brighter in the oblique forward view because theatmospheric particles scatter more sunlight into the forward direction.Due to geometric parallax, clouds appear to move relative to the groundas the view angle changes.
At right is a map of aerosol optical depth, a measure of the amount ofaerosol present in the atmosphere and one of several key variables usedto characterize their climatic and environmental influence. The extentof haze across Galveston Bay can be identified by the presence of lightblue and green pixels, and places where clouds or other factorsprecluded a retrieval are shown in dark grey. MISR uses the changes inthe atmosphere’s ability to transmit light and the variation inscene brightness at different viewing angles to retrieve aerosol opticaldepth, and to deduce some information about particle properties, such assize, shape and composition.
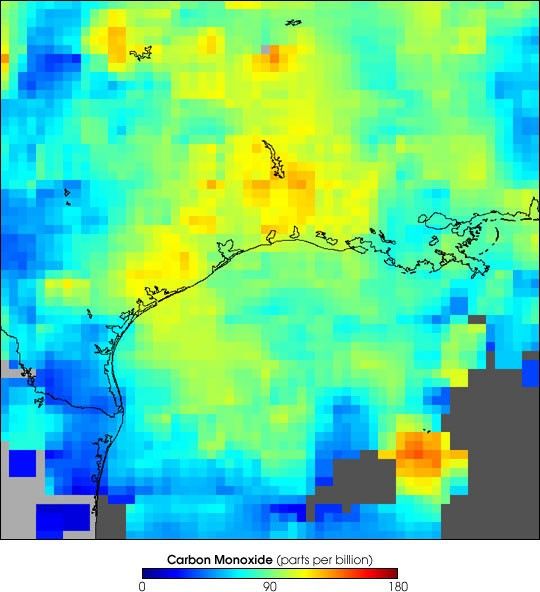
These data are being used as part of the Houston regional air qualitystudy. Airborne pollution particles that contribute to the poor airquality come in part from upwind power plants and petrochemicalmanufacturing facilities. Over a dozen local observing stations arescattered across the area to monitor air qualtiy. The MISR aerosol datahelp provide a context into which the particulate pollution sources, themonitoring site observations, and locations downwind, can all be placed. (Also, Terra MOPITT measurements of carbon monoxide in the atmosphere over this region are also available for this same time period.)
The Multi-angle Imaging SpectroRadiometer observes the daylit Earthcontinuously and every 9 days views the entire globe between 82 degreesnorth and 82 degrees south latitude. The MISR Browse Image Viewer provides access tolow-resolution true-color versions of these images. These data products were generatedfrom a portion of the imagery acquired during Terra orbit 14553. Thepanels cover an area of 380 kilometers x 704 kilometers, and utilizedata from blocks 65 to 69 within World Reference System-2 path 25.
References & Resources
Image courtesy NASA/GSFC/LaRC/JPL, MISR Team. Text by Clare Averill (Acro Service Corporation/JPL), Ralph Kahn (JPL)


