


When Seiji Kato tells people that he studies the atmosphere and the climate for a living, the usual response, he says, is “Oh! So tell me about hurricanes!” On that subject, however, Kato would have little to tell them. It’s not hard to imagine their response would be at least a little less enthusiastic when he tells them what he really does. At first, “I use satellite data to study the flux of photons at the top of the atmosphere,” just doesn’t seem as exciting as say, predicting whether global warming is making hurricanes stronger. That’s an unfair situation, really, because although it might not seem as exciting, Kato’s photon-flux job is just as important.

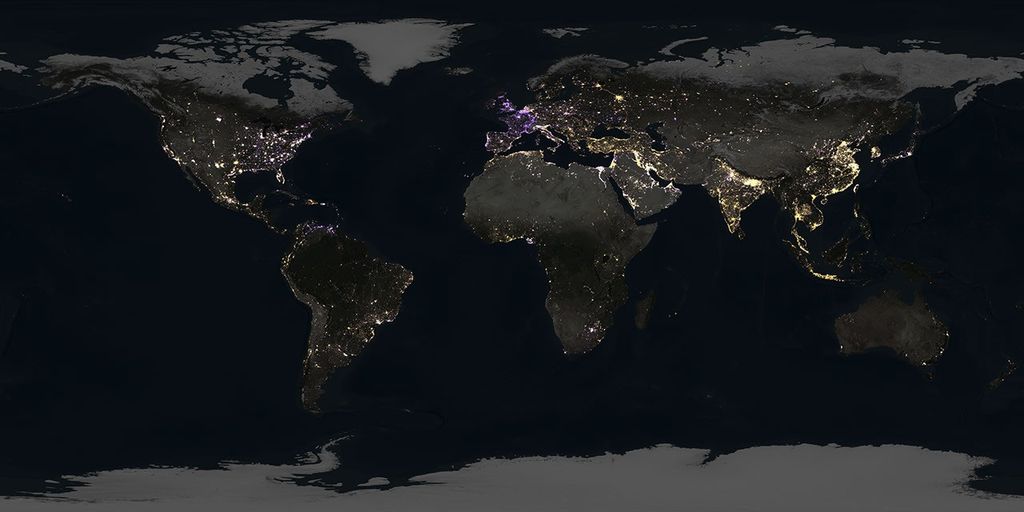
After all, Earth’s climate, in particular its average temperature, is all about photons. All day, every day the Sun hurls a steady stream of photons toward the Earth in the form of high-energy, shortwave radiation. Some photons are reflected by atmospheric particles, clouds, snow and ice, even ocean whitecaps. Other photons are absorbed by the Earth’s land and ocean surfaces, which heat up. These heated surfaces emit photons back to the atmosphere in the form of lower-energy, long-wavelength radiation. Some of these photons eventually make it all the way back out to space. The balance of incoming and outgoing photons over the whole planet, the net radiative flux, determines Earth’s temperature “set point.” The ability of greenhouse gases to absorb and emit photons is what global warming is all about.
So while it might not seem glamorous, keeping tabs on the atmosphere’s radiative flux and all the factors that influence it is crucial to understanding present and future climate. As increasing amounts of greenhouse gases tip the average global temperature toward a warmer “set point,” other parts of the Earth system—like clouds, ice, and snow—change as well. Lately, Kato, an atmospheric scientist affiliated with NASA’s Langley Research Center through Hampton University, has become interested in how those ‘other things’ feed back into the climate system by changing how much radiation the Earth absorbs or emits. About two years ago, Kato began investigating whether, as climate scientists have long anticipated, the retreat of highly reflective snow and ice in the Arctic has already produced a measurable drop in the amount of sunlight the region reflects.
From Plastics to the Poles, A Career Shifts Course
Since he arrived at NASA’s Langley Research Center from graduate school at Penn State in 1998, Kato’s task has been to use NASA satellite data to calculate the radiative flux over the polar regions. It’s not a career he pictured himself in until his early 30s. Born and raised in Japan, Kato studied mechanical engineering as a college student, and ended up in the plastics manufacturing industry. When the company he worked for developed a joint venture company with a U.S. business, it needed someone to relocate to Pennsylvania. Kato volunteered.
“When I first came to the U.S., where I was living, between Pittsburgh and Erie,” he says, “was very rural. In the winter, we would get a lot of snow, and there was nothing to do, so I had a lot of time to think. I began to really think about my life, my future. I asked myself, “What can I do with my life, what do I know?’ and I realized I didn’t really know about anything. I thought ‘You know, I’d really like to know something about nature, maybe about global warming.”
Kato says it’s good for him that he was living in the United States when this impulse to switch careers hit him. He doesn’t think he would have had the opportunity to go back to school in Japan. “There,” he says, “people don’t think a 30-year-old man should be going back to school. He should be working.” Instead, in the early 1990s, Kato entered the graduate program at the Pennsylvania State University, where one of the meteorology department’s veteran climate researchers, Tom Ackerman, took him under his wing. “That was a big moment in my life. I still remember the feeling—kinda scared—when I walked into his office.” He started taking atmospheric science classes and conducting research into the underlying physics of how light and heat pass into and out of Earth’s atmosphere.

In the late 1990s, he was invited to NASA’s Langley Research Center to give a presentation on the research he had been doing using observations from a Department of Energy project known as ARM, for Atmospheric Radiation Measurements. Soon after, NASA offered him a job working with radiation observations being collected by instruments known as CERES, short for “Clouds and the Earth’s Radiant Energy System.” The sensors measure the shortwave solar radiation the Earth reflects, as well as the longwave radiation the Earth emits. When Kato arrived at Langley in 1998, one CERES instrument was already in space, and two more were planned, one on NASA’s Terra satellite, to be launched in 1999, and one on the Aqua satellite, to be launched in 2002.
“When I came to NASA, I was given the task of estimating the energy budget over polar regions—the Arctic and the Antarctic—using CERES data,” says Kato. To get the budget, Kato has to tally up how much of the Sun’s incoming energy the Earth reflects, how much it absorbs, and how much energy it radiates back to space. This energy balance determines the Earth’s temperature “set point.” The first part of the story is figuring out Earth’s albedo, which is the percentage of incoming sunlight the Earth reflects. Earth’s albedo determines how much solar energy actually enters the system and becomes available to heat up the land, the oceans, and the atmosphere.
Kato’s interest in the polar regions has focused on what goes on at an altitude that scientists call the “top of the atmosphere,” the nebulous boundary between Earth and space, where the atmosphere becomes thinner, and thinner, and ever-so-gradually, ceases to exist. “There is no such thing as the true ‘top of the atmosphere,’” explains Kato, no one place where you can say “Here the atmosphere ends,” but a ballpark is maybe 100 kilometers above the Earth. It is here that scientists can observe the bottom line of the Earth’s energy budget: how many photons are coming and going.
But even though he focuses his attention on the top of the atmosphere, Kato says it has been impossible to ignore all the talk in recent years about what’s been happening on the surface below. Unlike the Antarctic, where the sea ice has retreated and expanded on a less consistent basis, the Arctic has experienced steady declines over the past 20 years or so—for as long as we have been observing it with satellites. In the past few years, Kato says, everyone has been talking about how Arctic sea ice and snow cover are shrinking very rapidly. The talk got him thinking.
Like most scientists, Kato has a hyper-active sense of curiosity. He tries to describe what drives it. “You don’t have to get a Nobel prize or anything,” he says, “but even a tiny, tiny thing…I’m just excited if I am the only one who knows this, for this first time, and nobody else knows. For example, if you go to a different town that you have never visited, and you start walking in the town, and you see a corner…well, I just want to go around that corner and see what’s there. I could do that forever. For this particular study, people were talking about how the Arctic is changing very quickly, how the sea ice is shrinking very rapidly, and I just wanted to know what the atmospheric response is, how the atmosphere is changing with the change of the sea ice. It’s just something that I want to know.”
The answer is more important than just a means to satisfy one scientist’s curiosity, however. Almost all climate models predict that the effects of global warming will be most rapid and dramatic in the polar regions. The main reason usually given for this polar amplification is something scientists call the ice albedo feedback. As anyone who has been outside in fresh snow on a sunny day can remember, the surface is blindingly bright. These bright surfaces are like a giant reflector stretched over the poles. But as ice and snow melt, the ocean and land surfaces will emerge like solar panels. When skies are clear, sunlight that would normally have reflected back into space from the bright white surfaces will soak in, which will warm and melt even more ice and snow. The relationship between melting sea ice and the decreasing reflective power of the poles is a positive climate feedback because warming ends up causing more warming. (The reverse is true as well: cooling creates more cooling because more snow and ice reflect more sunlight.)

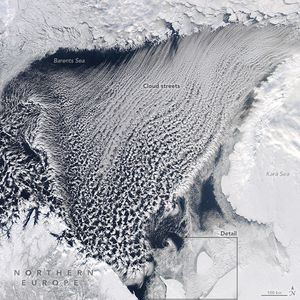
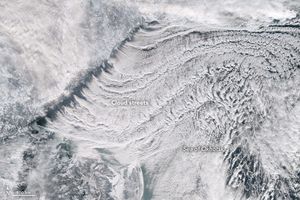
But, as is usually the case with climate processes, that simple description isn’t the whole story: the positive ice albedo feedback may have a competitor. “If the sea ice shrinks,” says Kato, “intuitively we would think that more water is exposed to the atmosphere, and so more water vapor is available to the atmosphere to form clouds. So in addition to changing sea ice, we can kind of guess that something must be happening in the atmosphere over the Arctic, too.” Clouds are bright, too, and an increase in clouds could cancel out the impact of melting snow and ice on polar albedo.
A Strategy for Detecting Climate Change Feedbacks
Kato wanted to know if either of these possible outcomes of melting snow and ice—decreases in reflected sunlight or increases in cloudiness—could be observed yet over the polar regions. Was polar amplification already underway? Peering at the Earth from 700 kilometers away, could satellites reveal whether loss of Arctic ice cover was already making our planet less reflective? If clouds had replaced snow and ice as a polar reflector, would the new sensors onboard the Terra satellite be able to tell?

For measuring the reflected light at the top of the atmosphere, Kato could use the CERES data he had been working with for years. For clouds, he would turn to another Terra satellite sensor: a radiometer called MODIS, short for Moderate Resolution Imaging Spectroradiometer. “Detecting clouds over snow and ice is a very, very difficult problem in remote sensing because the clouds are bright, and the snow and ice are bright,” says Kato. To previous satellite sensors, many of which observed only a handful of wavelengths of light, it all looked the same: white. Previous studies that tried to identify long-term or even seasonal changes in Arctic clouds couldn’t agree. Some analyses indicated that summer was cloudier than winter; others that that reverse was true. Still others found no seasonal difference at all.
With the launch of its Terra satellite, however, NASA introduced remote sensors with dramatically improved cloud-detection abilities, including devices that can observe the Earth in more than 20 different parts of the electromagnetic spectrum—from visible light, to shortwave infrared, to thermal infrared. Although a cloud and ice might look identical in visible light—white—they don’t look the same in other wavelengths, such as near- or thermal infrared. The more wavelengths a sensor observes, the more chances the scientists have to distinguish clouds from snow and ice. With this additional information, says Kato, “we think we are doing a much better job of detecting clouds over snow and ice, and that with MODIS we were ready to detect a trend in clouds over the Arctic region.”

The main concern when he began the study, says Kato, was that they simply wouldn’t have a long enough data record to detect any trends. Small changes occurring over a large area can have a big impact on climate. But the smaller the change, the longer the data record needs to be to make sure that the change is real. At the time Kato and his colleagues began their study, Terra’s sensors had only accumulated four years of cloud and energy balance data, spanning 2000-2004; Aqua, launched later, had only collected data between 2002-2004. Although he suspected four years of data would be a bare minimum—and probably not enough—Kato figured if the change in the Arctic was dramatic enough, they just might be able to find it.
With those doubts lingering in the back of their minds, Kato and his colleagues began processing, mapping, and analyzing the satellite data. Snow and ice extent data came from a series of microwave-frequency remote sensors nicknamed SSM/I, flown on a series of Department of Defense meteorological satellites. Cloud data came from NASA’s MODIS, and energy budget data came from CERES.
The goal was to create, in essence, a virtual map with three layers that could be laid on top of one another: sea ice and snow, clouds, and albedo. The scientists divided up the Arctic and Antarctic (60-90 degrees North and South, respectively) into a grid in which each box was a bit smaller than 100 kilometers by 100 kilometers. Team members wrote computer software that sorted the satellite observations—usually multiple observations each day— into their appropriate grid box and merged them. Computers continued churning through the data, turning daily observations into monthly averages for the four-year period. Once the virtual maps were complete, the team could test whether changes in the sea ice and snow layer of the virtual map were matched by changes in the maps of clouds or albedo.
Sea Ice and Snow Change, but Reflection Remains the Same
Among the first things the data revealed was a definite seasonal difference in cloudiness over the polar regions. Cloud fraction (the fraction of the area in a map’s grid box covered by cloud) over the Arctic was about 0.5 in the winter and 0.8 in the summer. Over the Antarctic, the seasonal difference was more subtle. Even though the cloud fraction over ocean areas increased from 0.7 to 0.9 between winter and summer, the cloud fraction over land decreased from 0.65 to 0.45. For the Antarctic as a whole, the changes essentially cancelled each other out. To confirm their findings in the Arctic, the team compared the satellite results to ground-based observations made by radars and lidars in a remote field station in Barrow, Alaska. (Lidar is like radar except it uses laser pulses instead of microwaves.) They found a good match.

Being able to establish a definite seasonal cycle in polar clouds during this period would have been an important contribution to climate change research all on its own. But the results only got more interesting. Although sea ice and snow cover had noticeably declined in the Arctic from 2000 to 2004, there had been no detectable change in the albedo measured at the top of the atmosphere: the proportion of light the Arctic reflected hadn’t changed. In other words, the ice albedo feedback that most climate models predict will ultimately amplify global warming apparently hadn’t yet kicked in.
Kato quickly understood why: not only is the Arctic’s average cloud fraction on summer days large enough—on average 0.8, or 80 percent—to mask sea ice changes, but an increase in cloudiness between 2000 and 2004 further hid any impact that sea ice and snow losses might have had on the Arctic’s ability to reflect incoming light. According to the MODIS observations, cloud fraction had increased at a rate of 0.65 percent per year between 2000 and 2004. If the trend continues, it will amount to a relative increase of about 6.5 percent per decade. At least during this short time period, says Kato, increased cloudiness in the Arctic appears to have offset the expected decline in albedo from melting sea ice and snow.
Being able to demonstrate these effects from such a short span of data was a bit of surprise, admits Kato. “If I have a hundred ideas,” he says with a laugh, “maybe one percent turn out to be good ones. You have to try to let measurements speak for themselves, but it can be very frustrating at times, when intuitively you think your ideas must be right, but because of measurement errors, or other problems, you can’t prove it. Normally, four years of data would not be enough, but with this one,” he jokes, “maybe we just got lucky.”
Bruce Wielicki, lead scientist for the CERES instruments, helps to put these results in context. The response of clouds to global warming—or any other climate change—is one of the biggest sources of uncertainty in climate predictions. Those uncertainties are why studies like this one are so important, says Weilicki. “These results give modelers an opportunity to test their cloud feedbacks against something specific.”
Clouds are chameleon-like characters. Whether clouds will aggravate or ameliorate global warming depends on an almost bewildering array of factors: cloud fraction, altitude, type, latitude, season, to name a few. They can reflect incoming sunlight, lessening global warming. They can also absorb energy radiated from the Earth’s surface, and, in turn, emit more energy back toward the surface than greenhouse gases. In the Arctic, scientists suspect that clouds’ energy-absorbing and emitting effects outweigh their sun-shielding effects, making their overall feedback on the surface a warming one.
This question of Arctic clouds’ overall influence on the energy balance is the next idea that has gripped Kato’s scientific curiosity. In addition to extending his analysis as a longer time series of data becomes available from Terra and Aqua, Kato plans to investigate whether CERES has detected any changes in the amount of radiation the Earth emitted over the Arctic during this period. The question of what he will do next prompts Kato to return to the topic of curiosity, and what creates his intense interest in “seeing what’s around the corner.”
Partly, the reason is wrapped up in his answer to another question: do you personally feel scared or worried about global warming? “Before I started studying this, I would say, yes, I did feel a little worried.” Now that he is learning about the problem, he says, he feels less worried, though not because his studies have led him to believe global warming isn’t real. It’s just that there is a satisfaction, a relief, in knowing that he is doing something to address the problem. “I’m not making policy or developing an efficient car,” he says, “but I am helping us better understand the problem.” For Kato, there is another, simpler, source of satisfaction: the pleasure of knowing things about how nature works. “I guess I would say that it’s like if you go to a museum,” he says. “If you know something about history, you’re probably going to enjoy the things you see more. I feel that way about nature. The more I know about nature, the more enjoyable life is.
References
- Kato S., Loeb, N.G., Minnis, P., Francis, J.A., Charlock, T.P., Rutan, D.A., Clothiaux, E.E., and Sun-Mack, S. (2006). Seasonal and interannual variations of top-of-atmosphere irradiance and cloud cover over polar regions derived from the CERES data set. Geophysical Research Letters, 33, L19804. doi:10.1029/2006GL026685.
- Parkinson, C. (2004). Southern Ocean sea ice and its wider linkages: insights revealed from models and observations. Antarctic Science, 16 (4), 387-400. doi 10.1017/S0954102004002214.
NASA Earth Observatory story by Rebecca Lindsey. Design by Robert Simmon. The author would like to thank Claire Parkinson and Bruce Weilicki for providing background information and reviewing this article.