


Blue Marble: Next Generation
Topography and Bathymetry Maps
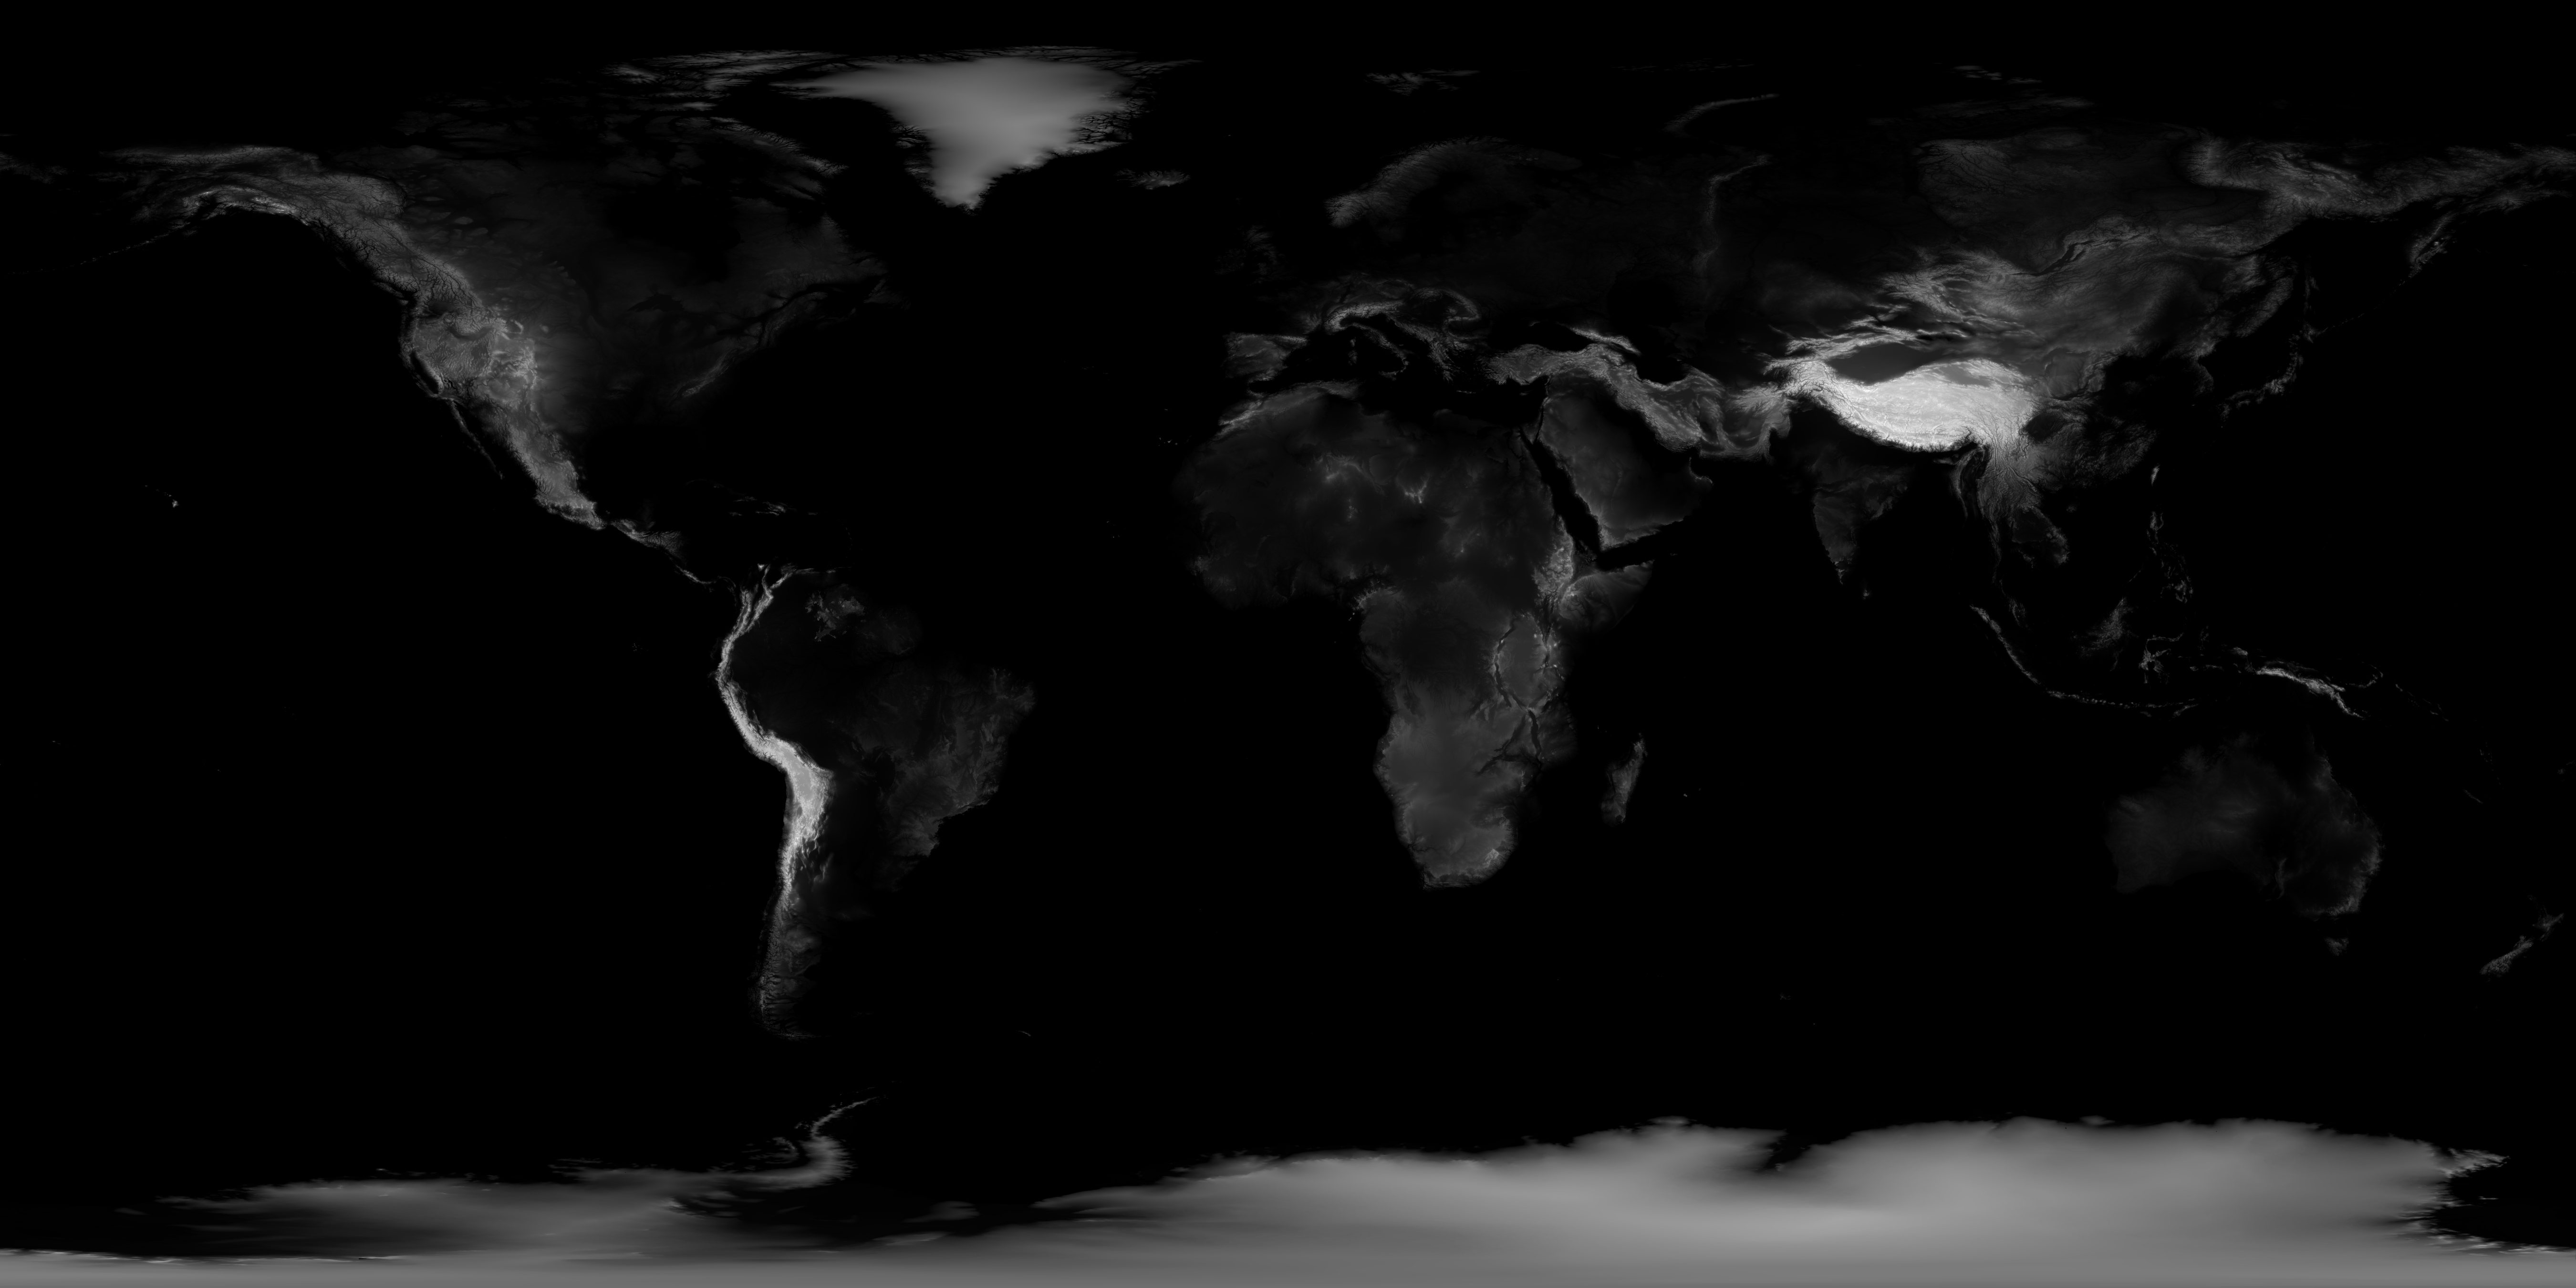
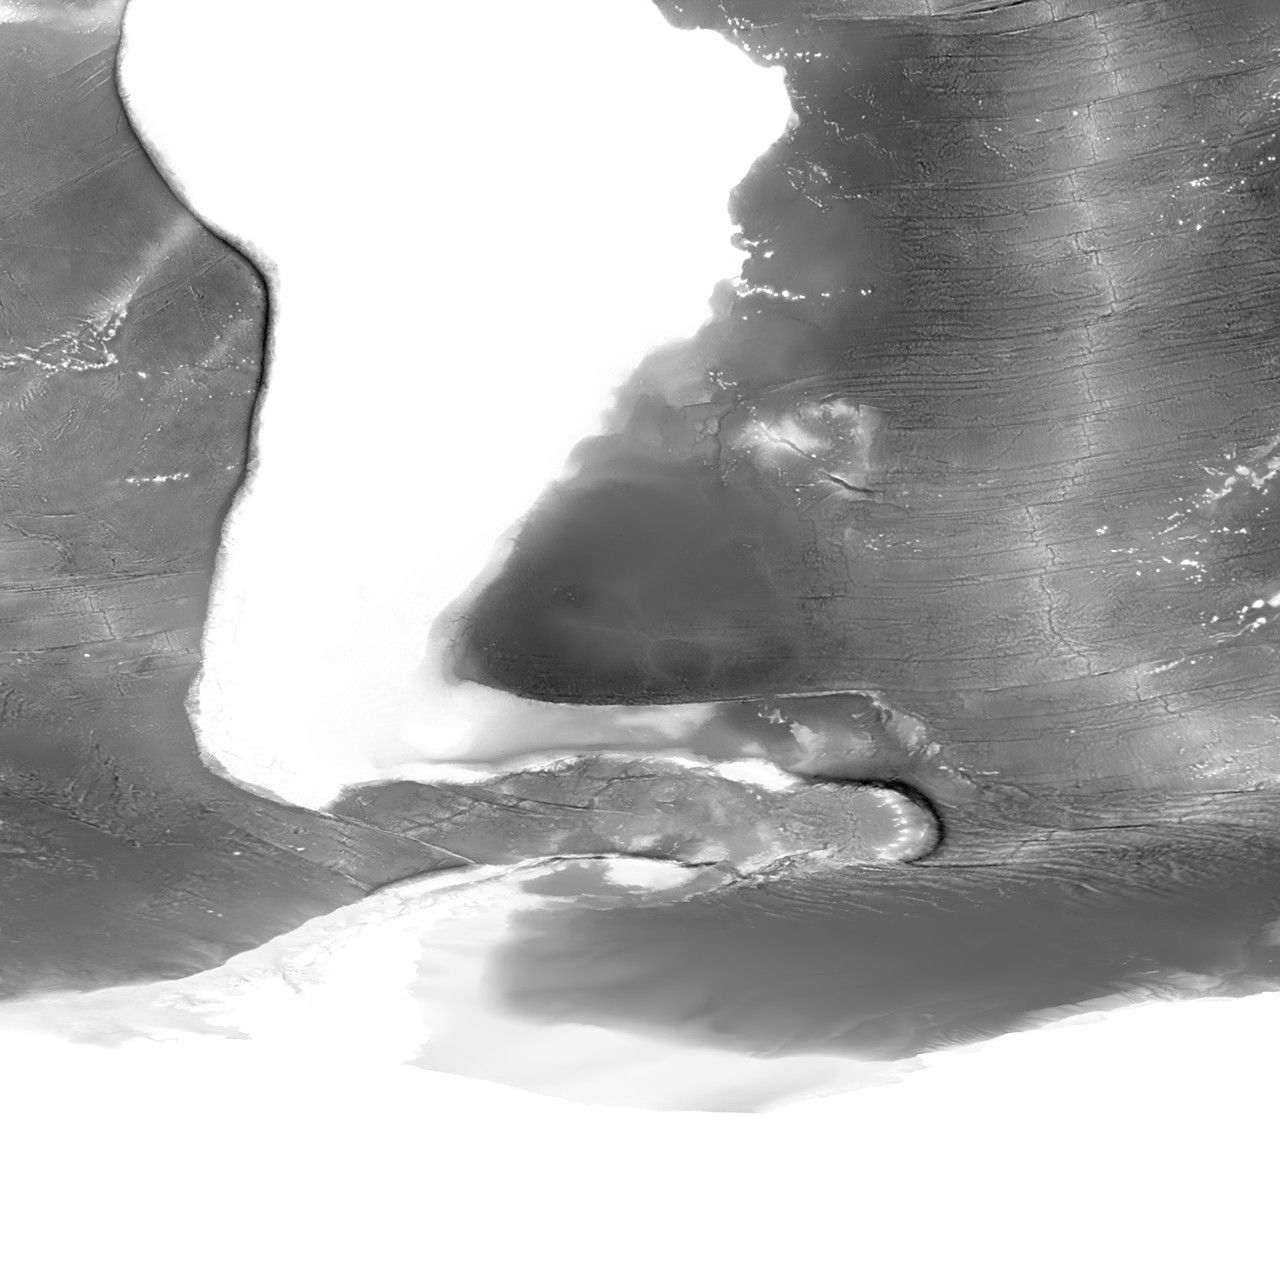
Topography
Land topography is a digital image of the three-dimensional structure of the Earth's surface. Shading indicates changes in slope or elevation. The relief shading in this topographic map comes mostly from elevation data collected by space-based radars. A radar in space sends a pulse of radio waves toward the earth and measures the strength and length of time it takes a signal to bounce back. From this information, scientists can determine the height and shape of the features on the surface.
Topography not only gives a realistic picture of what the Earth's surface actually looks like, it also helps scientists determine things like how rivers and streams drain through the landscape, where lowlands are prone to flooding, how plate tectonics or erosion are building or wearing away mountains, where hills may be prone to landslides, or how a volcanic eruption changed the shape of a mountain. Topography is also one of the factors that influences where particular ecosystems exist. Therefore topography is one of the factors that scientists can use to predict where certain plants or animals, such as endangered species, might be found.
Data in these images were scaled 0-6400 meters.

Global
High Resolution (1 km/pixel), tiled
| A1 (JPEG | GeoTIFF) | B1 (JPEG | GeoTIFF) | C1 (JPEG | GeoTIFF) | D1 (JPEG | GeoTIFF) |
 |  |  |  |
 |  |  |  |
| A2 (JPEG | GeoTIFF) | B2 (JPEG | GeoTIFF) | C2 (JPEG | GeoTIFF) | D2 (JPEG | GeoTIFF) |
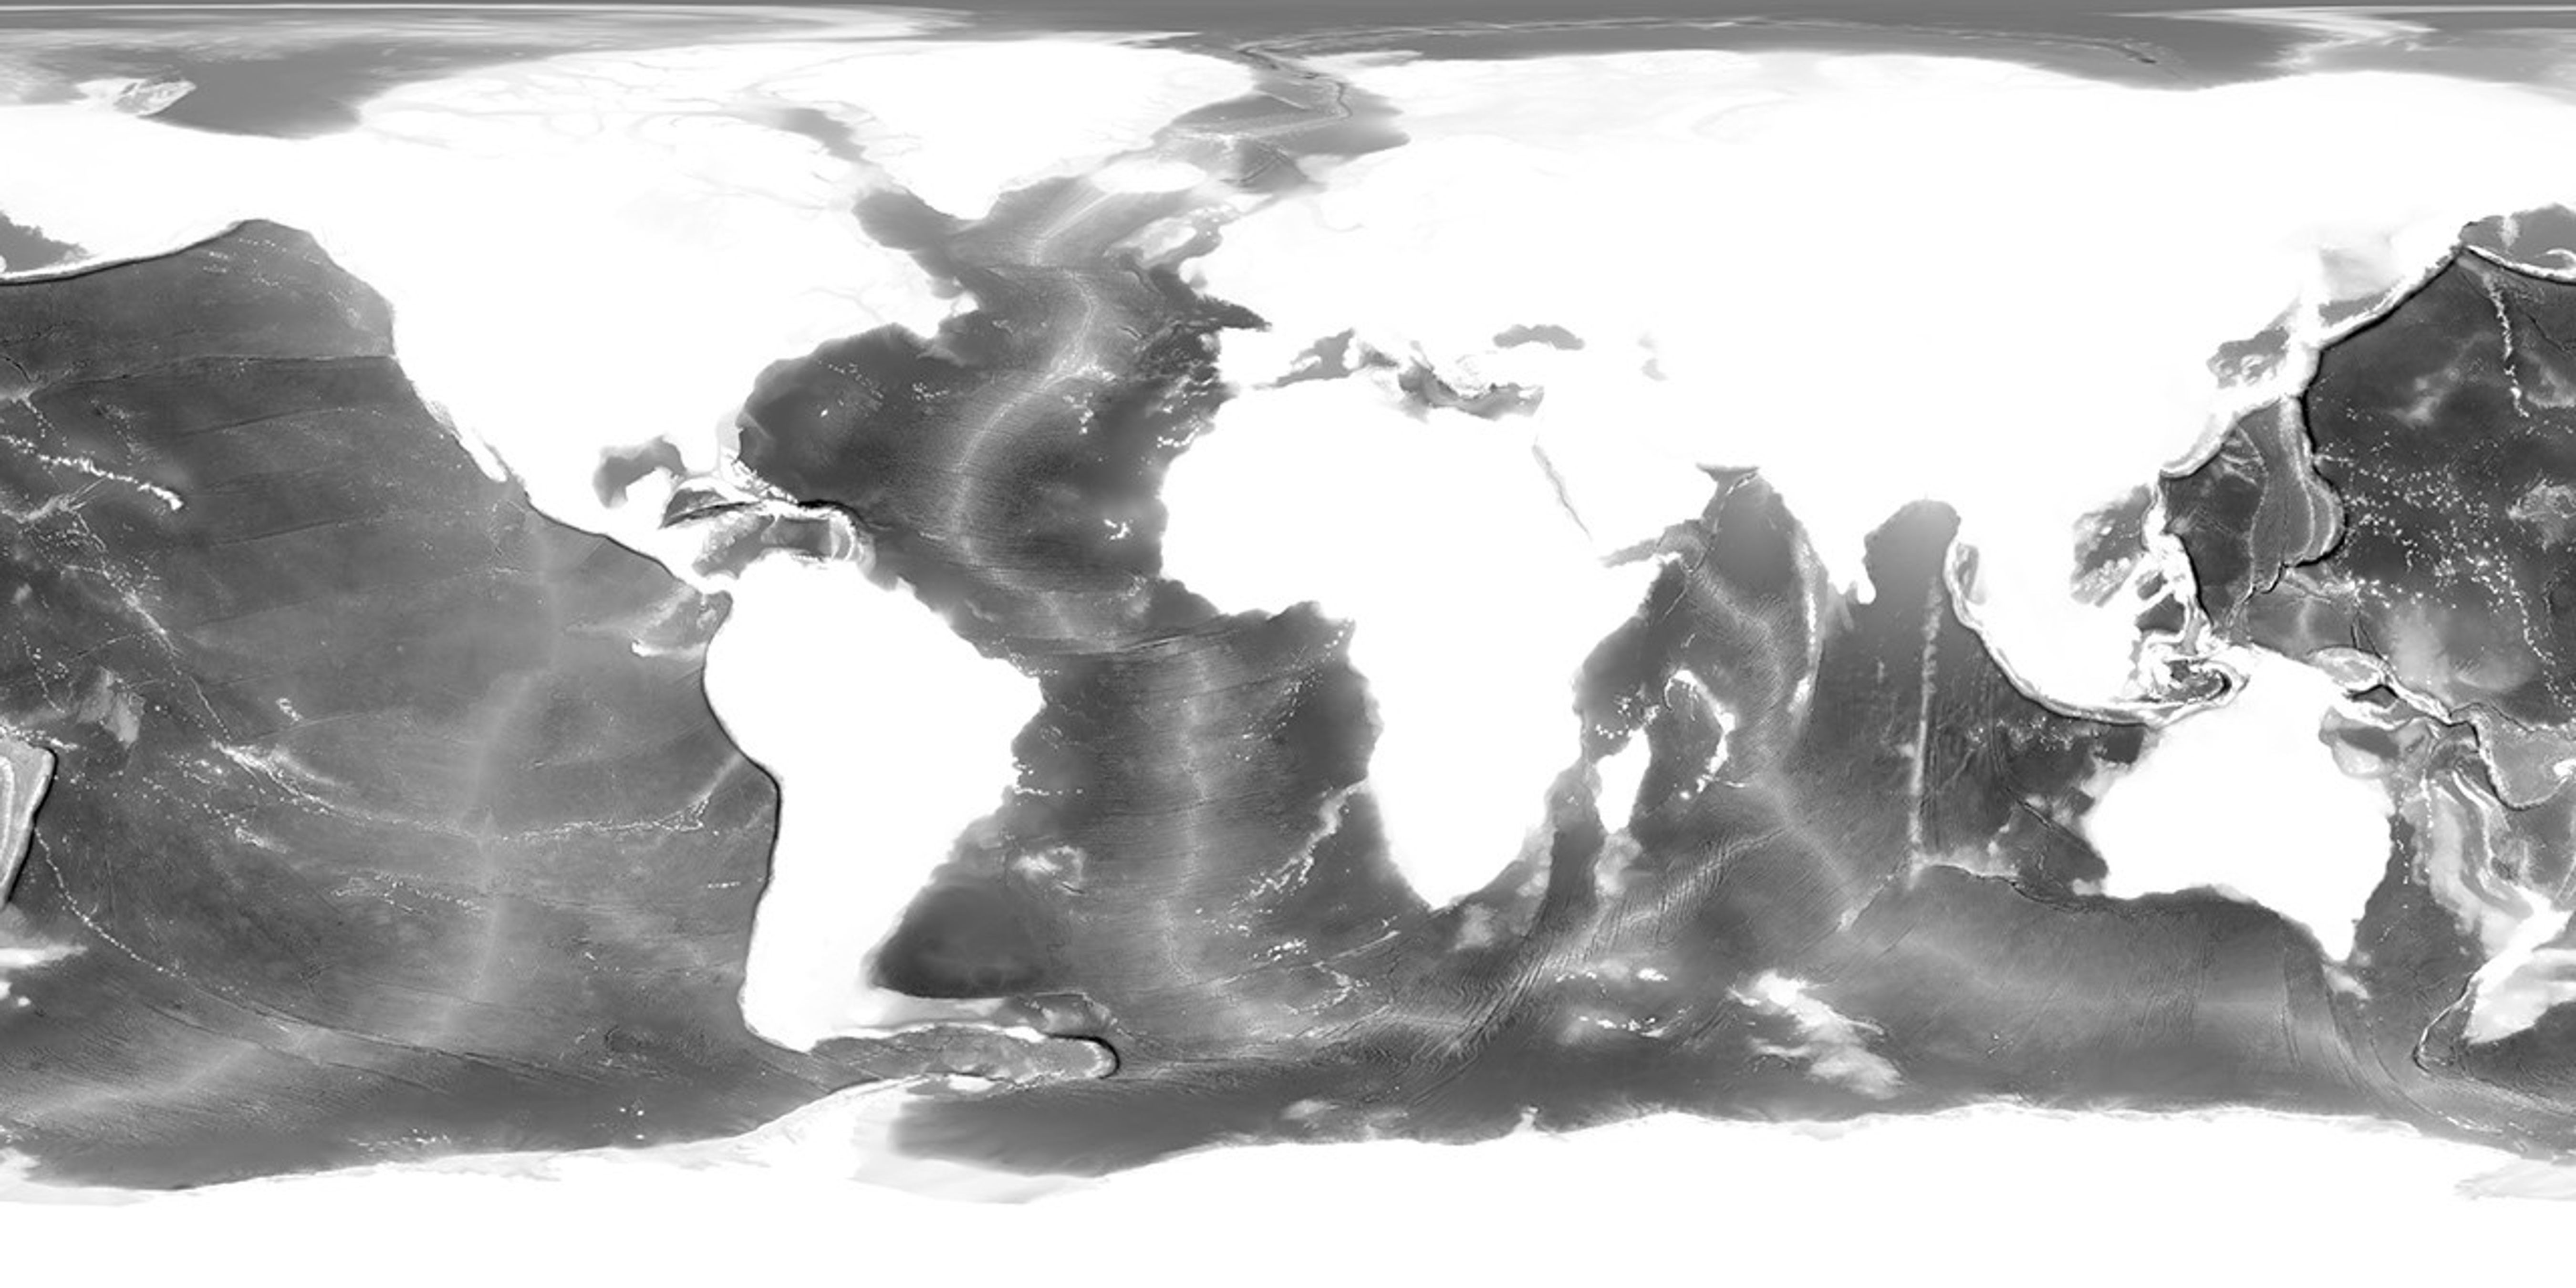
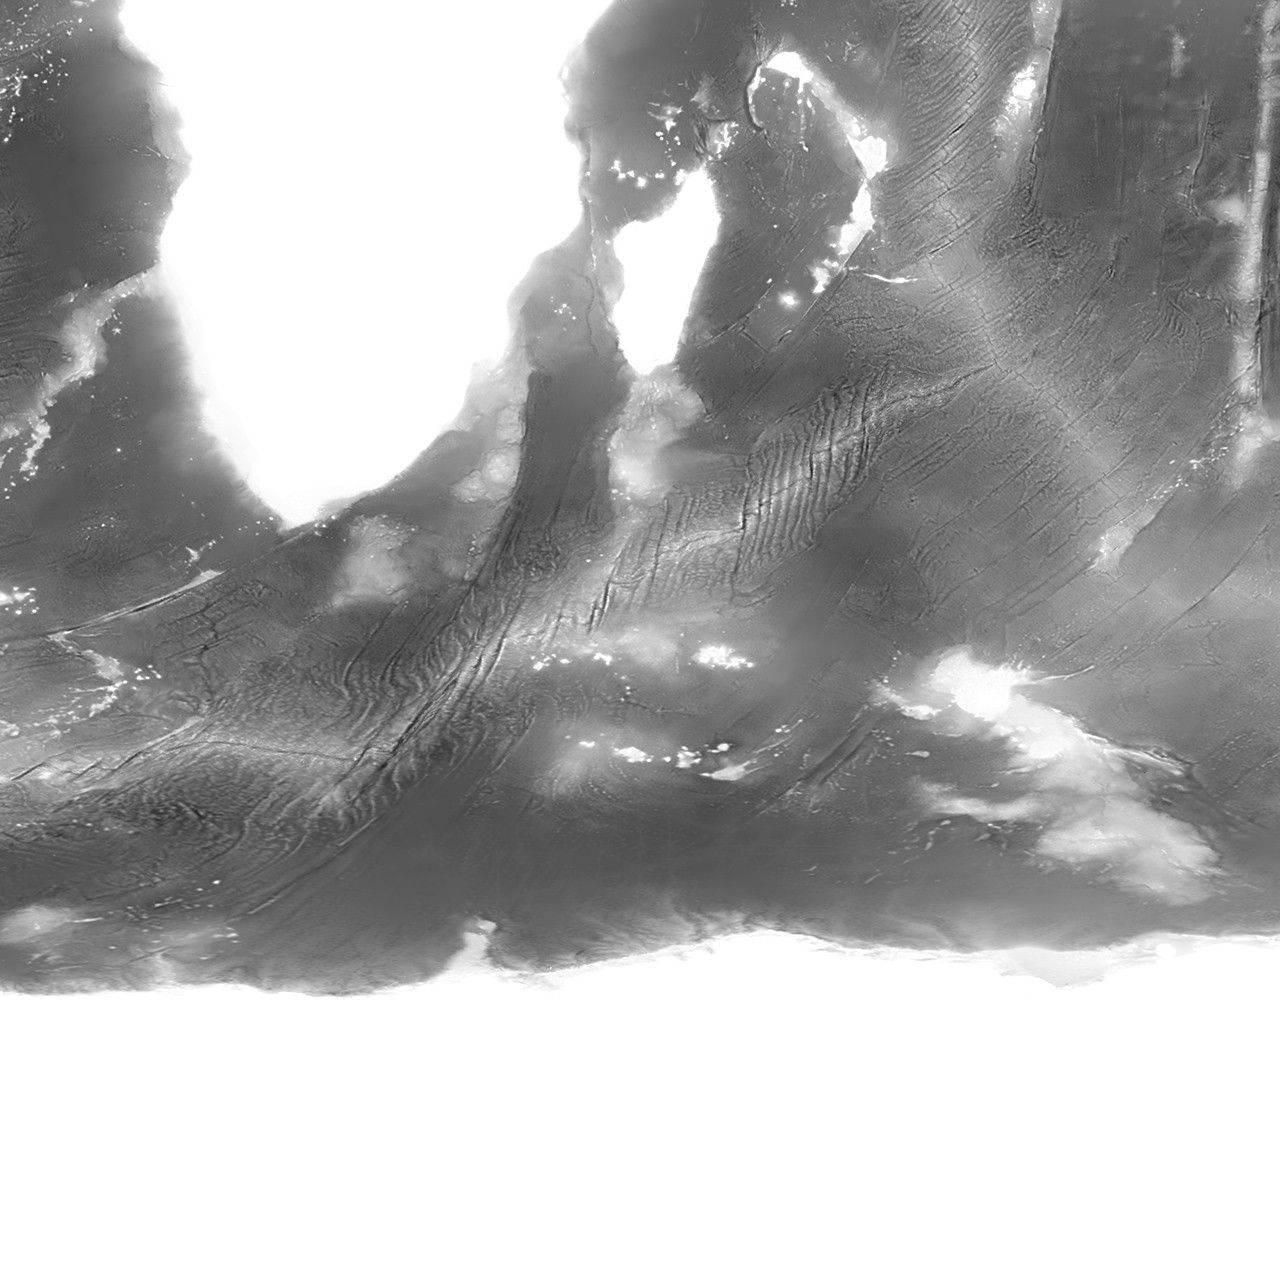
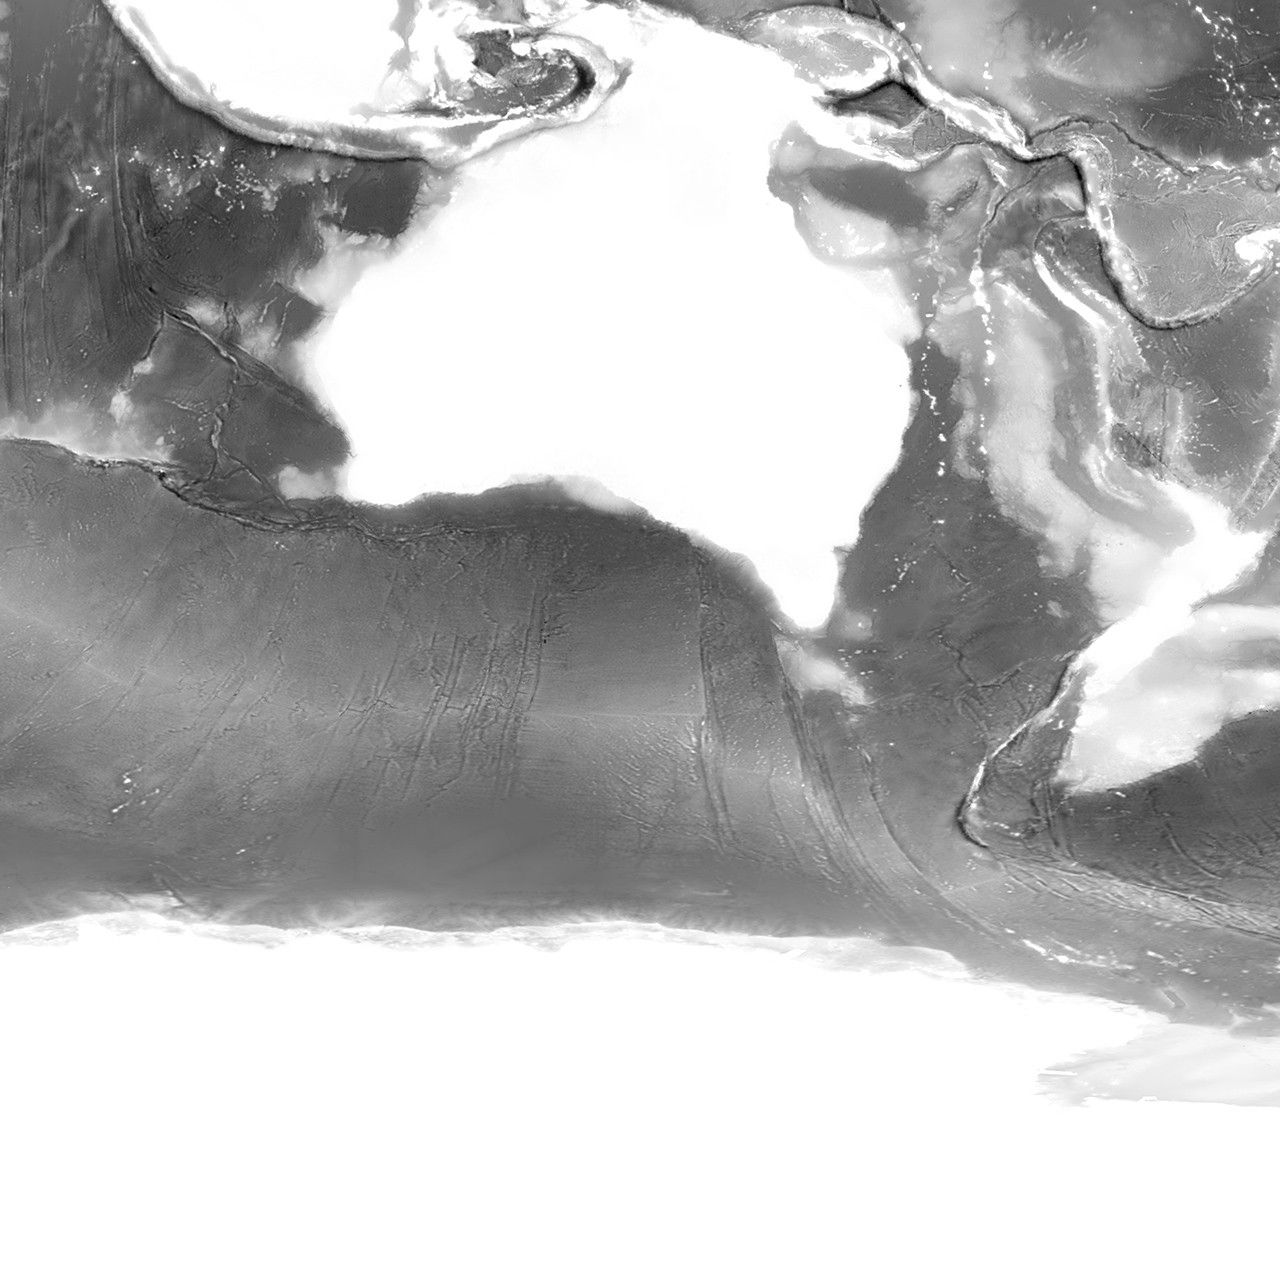
Bathymetry
Bathymetry is a digital image of the undersea land surface and water depth. Bathymetry is the underwater equivalent of land topography. In the maps provided here, shading indicates changes in slope or depth. Much of the data on ocean bathymetry come from "soundings." To collect a sounding, scientists use sonar devices to emit a sound wave that passes into the water. By measuring how long it takes the sound wave to bounce off the ocean floor and return to the sonar, scientists can estimate the depth of the water. Other characteristics of the returned sound wave can help reveal the shape and size of features on the sea floor.
These images represent ocean depths between -8000m and 0m (surface).
Global
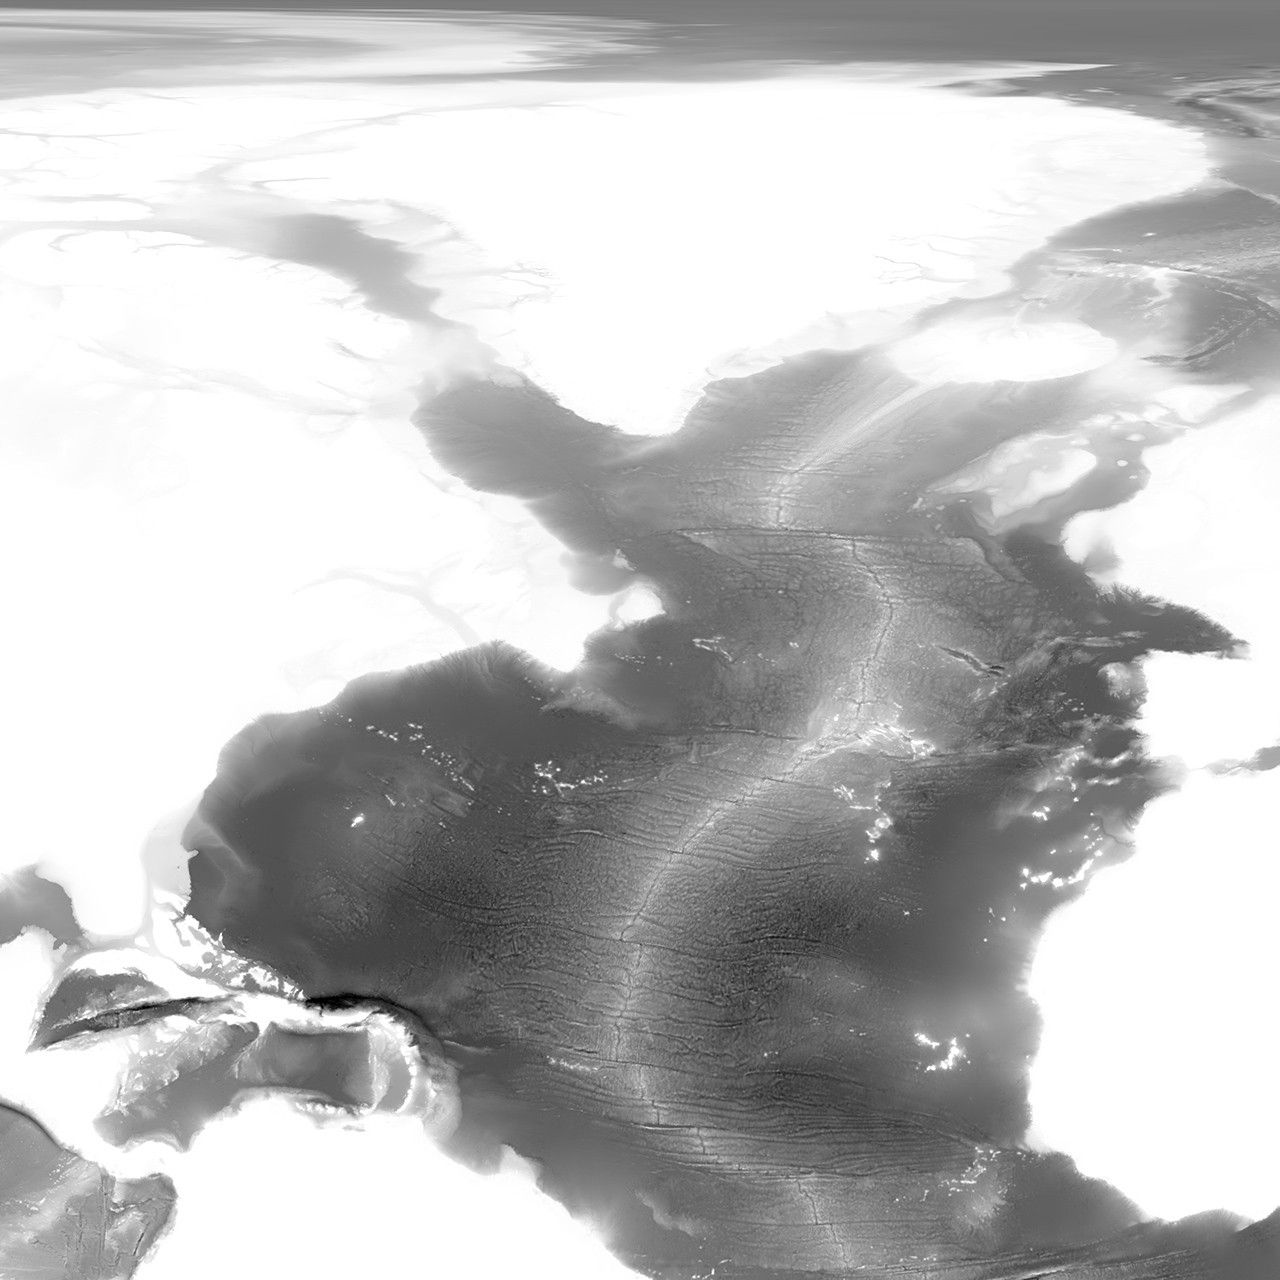
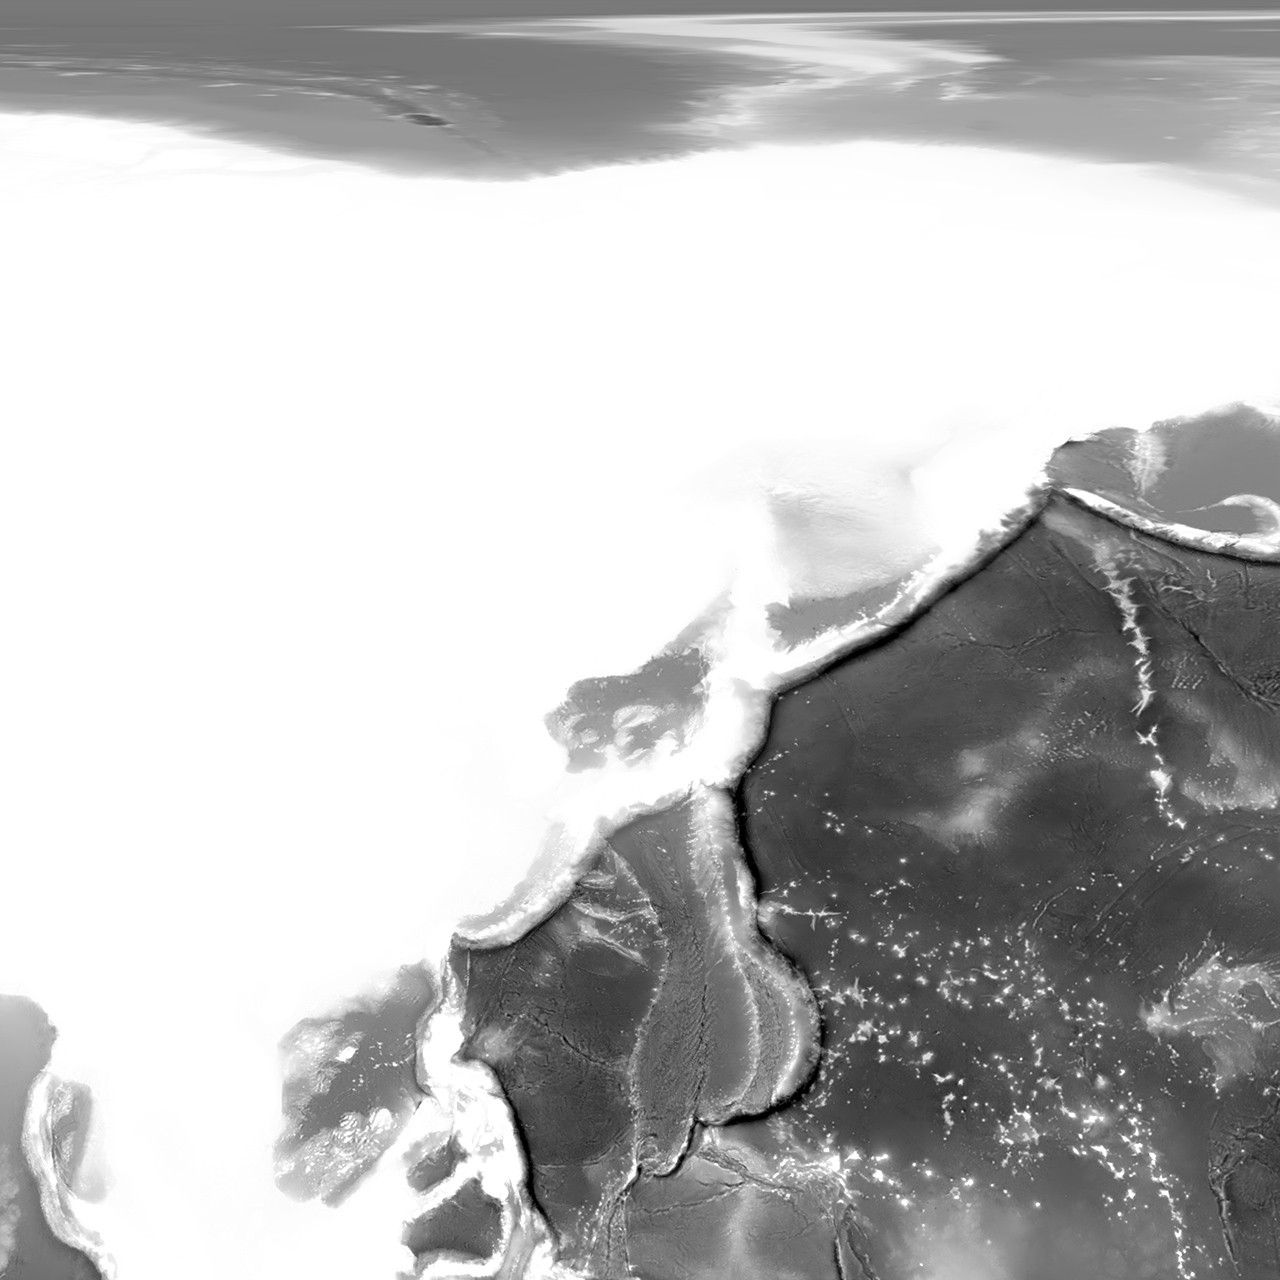
High Resolution (1km/pixel), tiled
| A1 (JPEG | GeoTIFF) | B1 (JPEG | GeoTIFF) | C1 (JPEG | GeoTIFF) | D1 (JPEG | GeoTIFF) |
 |  |  |  |
 |  |  |  |
| A2 (JPEG | GeoTIFF) | B2 (JPEG | GeoTIFF) | C2 (JPEG | GeoTIFF) | D2 (JPEG | GeoTIFF) |
Imagery by Jesse Allen, NASA's Earth Observatory, using data from the General Bathymetric Chart of the Oceans (GEBCO) produced by the British Oceanographic Data Centre.