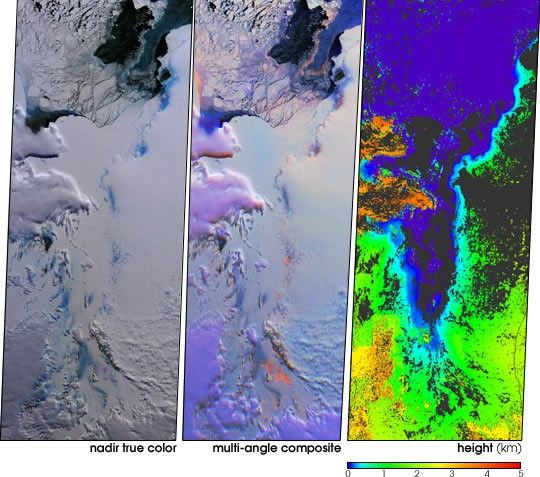
These views from the Multi-angle Imaging SpectroRadiometer (MISR)illustrate ice surface textures and cloud-top heights over the Amery IceShelf/Lambert Glacier system in East Antarctica on October 25, 2002.
The left-hand panel is a natural-color view from MISR’sdownward-looking (nadir) camera. The center panel is a multi-angularcomposite from three MISR cameras, in which color acts as a proxy forangular reflectance variations related to texture. Here, data from thered-band of MISR’s 60° forward-viewing, nadir and 60° backward-viewingcameras are displayed as red, green and blue, respectively. With thisdisplay technique, surfaces which predominantly exhibitbackward-scattering (generally rough surfaces) appear red/orange, whilesurfaces which predominantly exhibit forward-scattering (generallysmooth surfaces) appear blue. Textural variation for both the groundedand sea ice are apparent. The red/orange pixels in the lower portion ofthe image correspond with a rough and crevassed region near thegrounding zone, that is, the area where the Lambert and four othersmaller glaciers merge and the ice starts to float as it forms the AmeryIce Shelf. In the natural-color view, this rough ice is spectrally bluein color.
Clouds exhibit both forward and backward-scattering properties in themiddle panel and thus appear purple, in distinct contrast with theunderlying ice and snow. An additional multi-angular technique fordifferentiating clouds from ice is shown in the right-hand panel, whichis a stereoscopically derived height field retrieved using automatedpattern recognition involving data from multiple MISR cameras. Areasexhibiting insufficient spatial contrast for stereoscopic retrieval areshown in dark gray. Clouds are apparent as a result of their heightsabove the surface terrain. Polar clouds are an important factor inweather and climate. Inadequate characterization of cloud properties iscurrently responsible for large uncertainties in climate predictionmodels. Identification of polar clouds, mapping of their distributions,and retrieval of their heights provide information that will help toreduce this uncertainty.
The Multi-angle Imaging SpectroRadiometer observes the daylit Earthcontinuously and every 9 days views the entire Earth between 82 degreesnorth and 82 degrees south latitude. The MISR Browse Image Viewer provides access tolow-resolution true-color versions of these images. These data products were generatedfrom a portion of the imagery acquired during Terra orbit 15171. Thepanels cover an area of 380 kilometers x 984 kilometers, and utilizedata from blocks 145 to 151 within World Reference System-2 path 127.
References & Resources
Image courtesy NASA/GSFC/LaRC/JPL, MISR Team. Text by Clare Averill (Acro Service Corporation/Jet Propulsion Laboratory), and Helen A. Fricker (Scripps Institution of Oceanography).