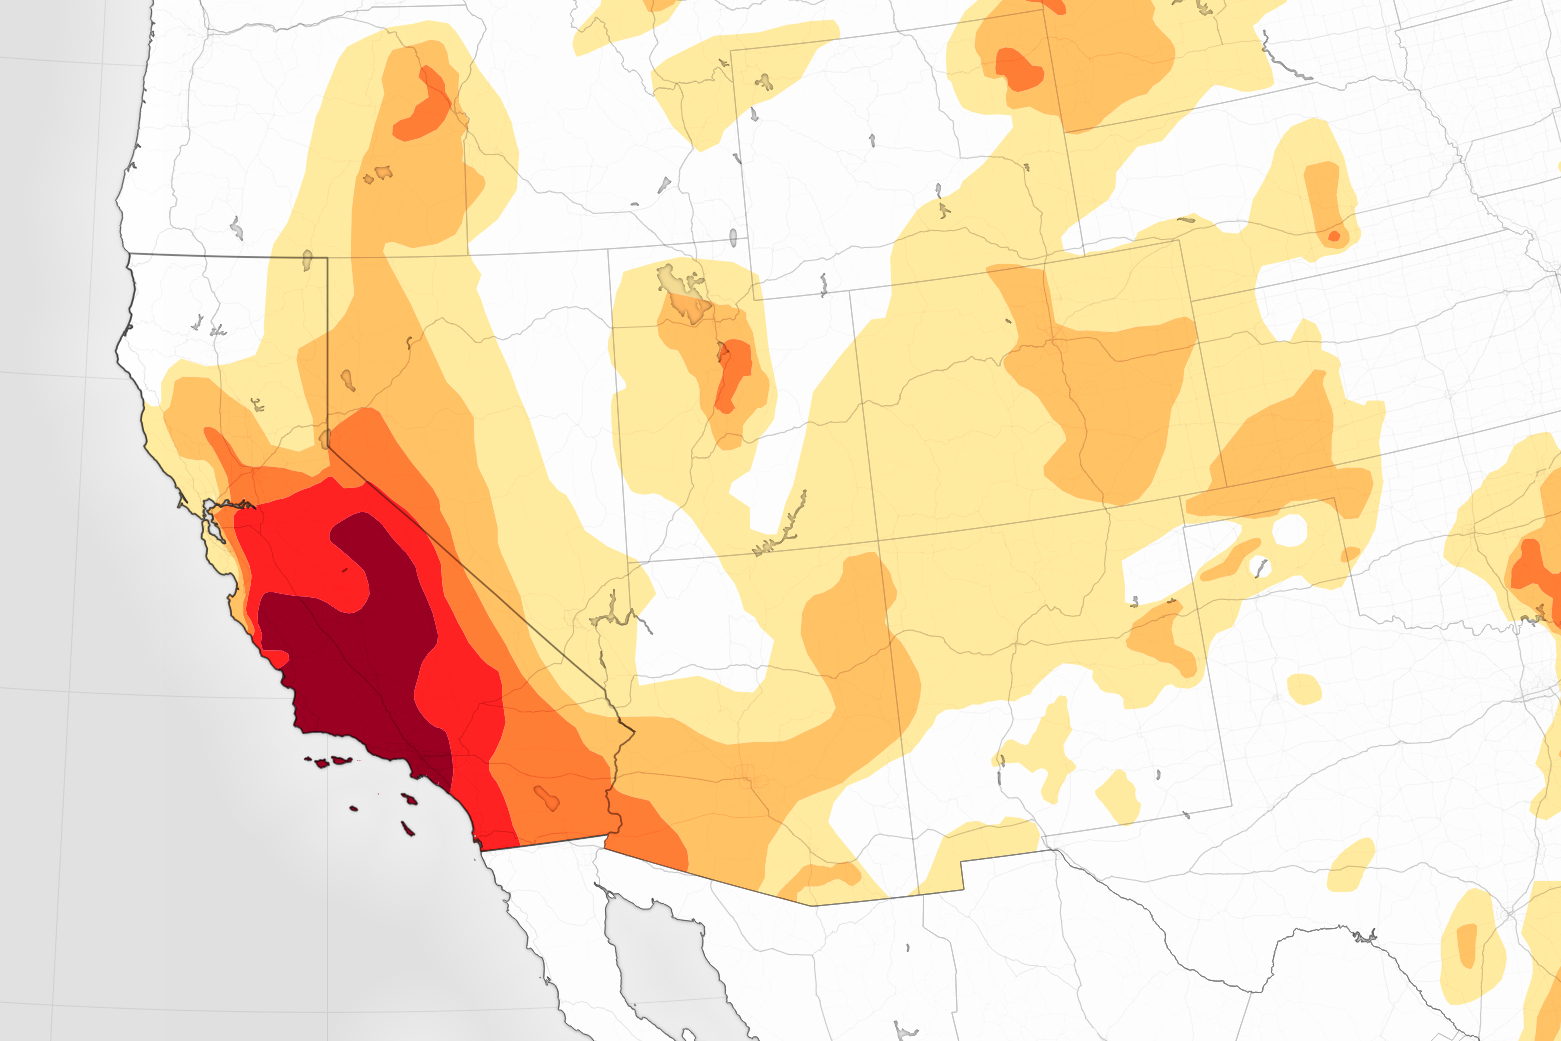
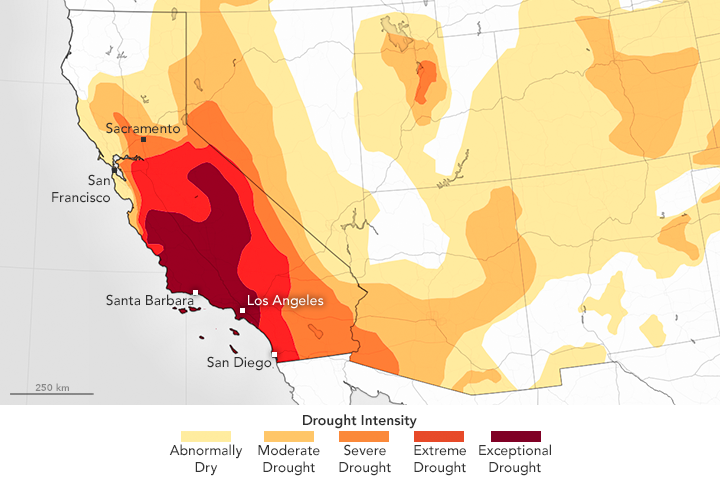
While late summer and autumn rains offered some relief to Northern California, drought continues to torment the southern part of the state. New data from the U.S. Drought Monitor show exceptional drought in California’s Central Valley, Central Coast, and South Coast.
The map at the top of this page depicts drought conditions as of November 8, 2016. Areas facing exceptional drought (the highest on the scale) are shown in maroon and extreme drought is red. According to the Drought Monitor classification system, exceptional drought can bring widespread crop and pasture losses, as well as water emergencies due to low reservoirs, streams, and wells. The map is based on measurements of soil, water, and climate conditions collected by federal, state, and local observers. (NASA also provides experimental measurements and models to the drought monitoring effort.)
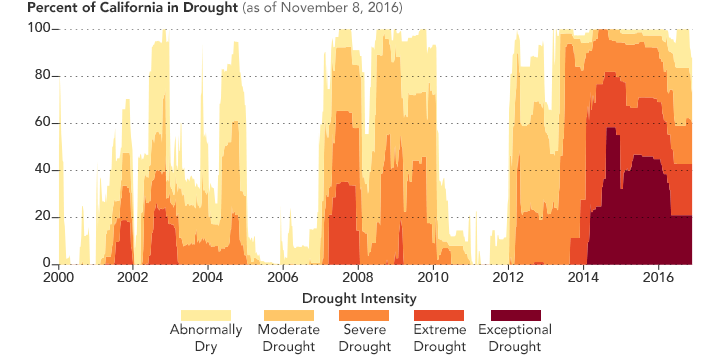
While the extent and severity of drought has fluctuated over the months and years, the large zone of exceptional drought in Southern California has persisted since January 2014. The chart below shows how extreme the current drought has been in comparison to past dry spells. While the state has experienced several dry periods since 2000, none pushed any portion of the state into exceptional drought. About 20 percent of California remains in exceptional drought now.
In Southern California, the effects have been far reaching. Some farmers have had to switch to crops that require less water. So much groundwater has been pumped from underground aquifers (to make up for the lack of surface water) that the land in the Central Valley has been sinking at an unusually rapid rate. Some towns and cities have put strict conservation measures in place to minimize water use.
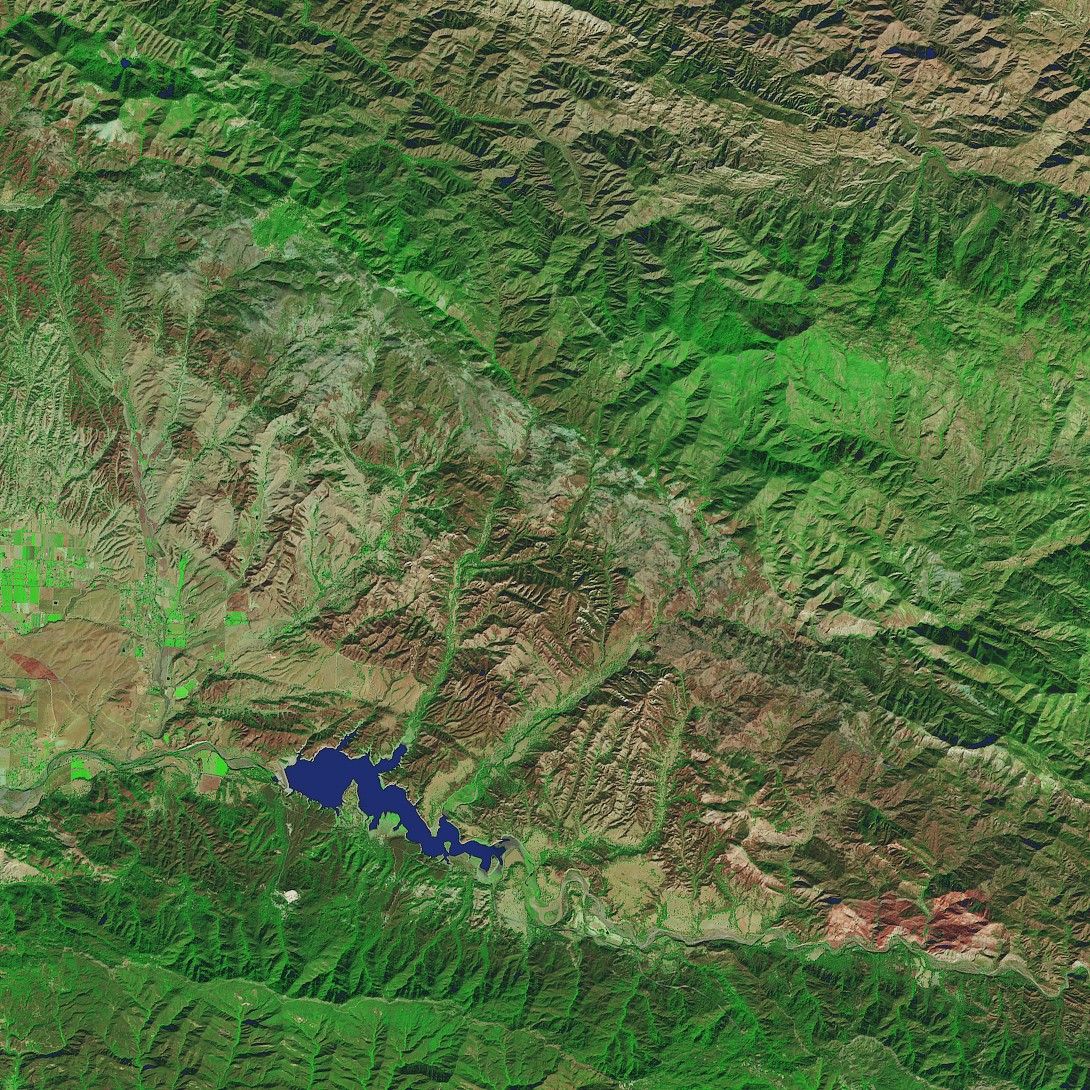
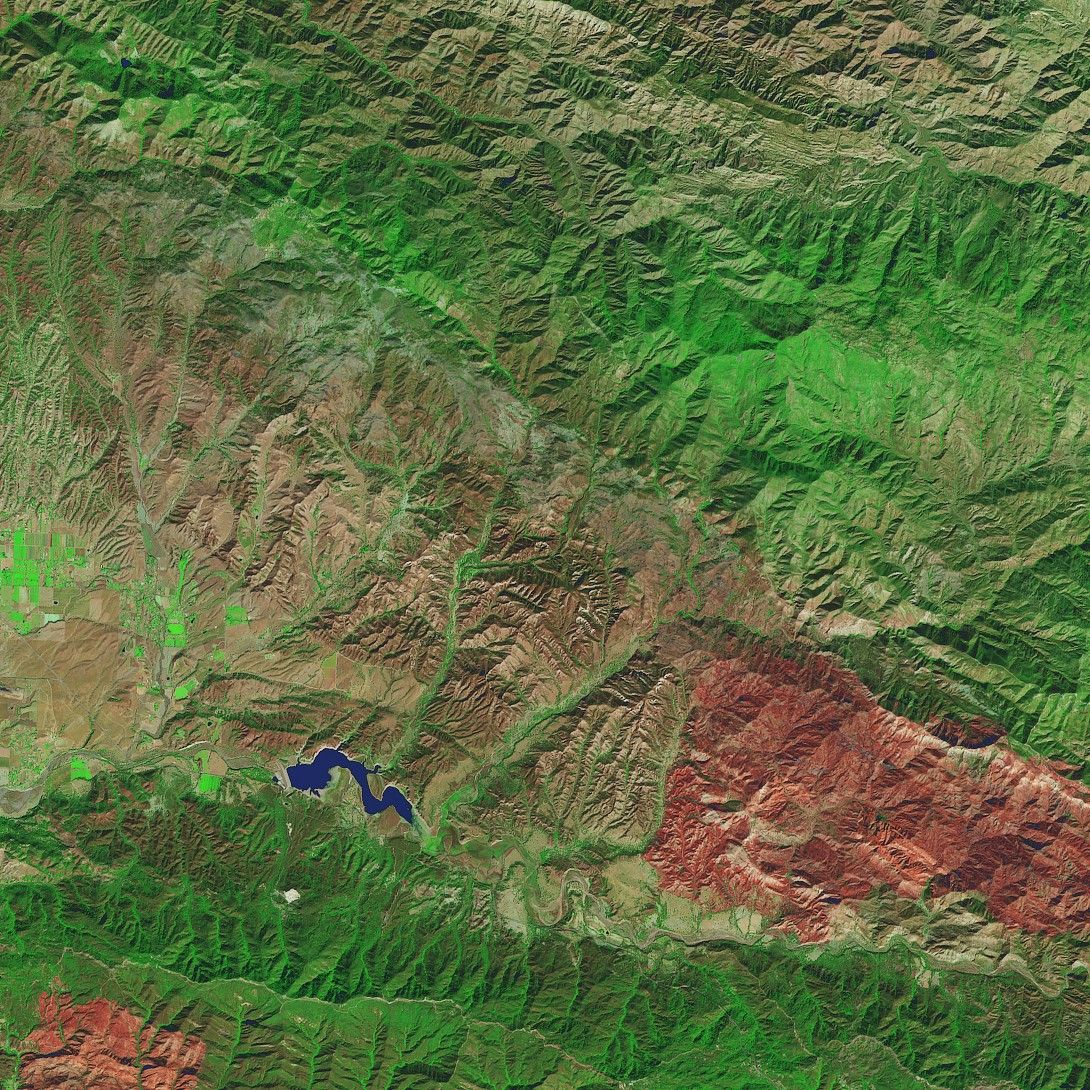
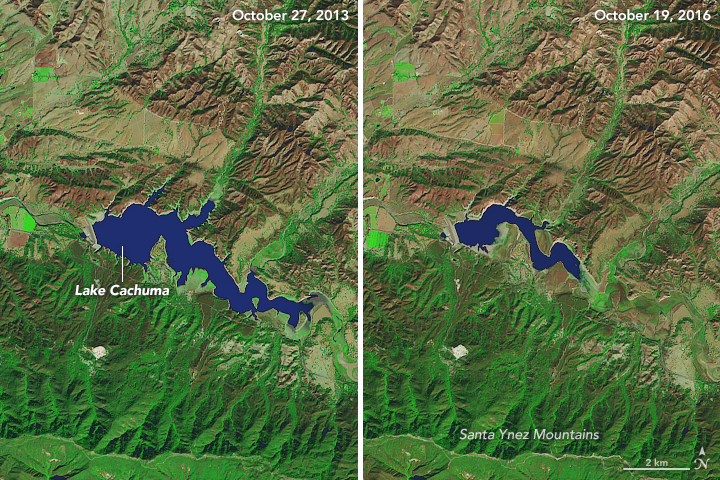
Remarkably low water levels in many reservoirs in Southern California are another indicator of the severity of the drought. For instance, the volume of water in Lake Cachuma—which supplies Santa Barbara with drinking water—has fallen to about 7 percent of capacity. The Operational Land Imager (OLI) captured images (below) of the reservoir on October 27, 2013, and October 26, 2016. The sharp decline in water levels has exposed much of the bottom of the reservoir.
References & Resources
- California (2015, February) California’s Most Significant Droughts. Accessed November 15, 2016.
- City of Santa Barbara (2016, November 9) Drought Information. Accessed November 15, 2016.
- Climate Central (2016, November 10) La Niña Arrives, Likely to Exacerbate Southern Drought. Accessed November 15, 2016.
- Lakepedia (2016, November 9) 10 Images That Show How California’s Reservoirs Have Shrunk in the 21st Century. Accessed November 15, 2016.
- NASA (2015, August 19) California Drought Causing Valley Land to Sink. Accessed November 16, 2016.
- Pro Publica (2016, June 25) California’s Drought is Part of a Much Bigger Water Crisis. Here’s what You Need to Know. Accessed November 15, 2016.
- Pacific Institute (2016, November) Current Conditions. Accessed November 15, 2016.
- Santa Barbara Independent (2016, November 9) Want to See the Bottom of Lake Cachuma? Accessed November 15, 2016.
- The Washington Post (2016, November 13) There won’t be enough water for the communities near this lake without a miracle. Accessed November 15, 2016.
- The Washington Post (2016, November 13) A giant reservoir that supplies a California county’s drinking water is nearly empty. Accessed November 15, 2016.
- United States Drought Monitor (2016, November 8) U.S. Drought Monitor Map Archive. Accessed November 15, 2016.
- United States Geological Survey California Drought. Accessed November 15, 2016.
NASA Earth Observatory images by Joshua Stevens, using data from the U.S. Geological Survey and the United States Drought Monitor at the University of Nebraska-Lincoln. Caption by Adam Voiland.