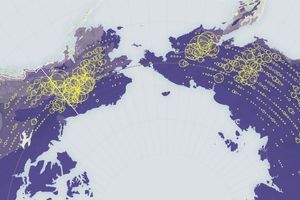
Since 2000, the Moderate Resolution Imaging Spectroradiometer (MODIS) on NASA’s Terra satellite has been measuring global patterns of aerosols—tiny particles suspended in the air—in order to help scientists understand the complicated influences that aerosols have on Earth’s climate. The maps above show average global aerosol patterns based on data from 2000-2007 (top) and 2007 aerosols compared to the average (bottom).
The top map shows aerosol optical thickness in shades of yellow (few aerosols) to dark red (many aerosols). Aerosol optical thickness indicates how much light aerosols prevented from passing though the atmosphere. (In this case, MODIS measured light with a 550-nanometer wavelength, which is yellow-green.) Gray areas, such as Antarctica and the Sahara Desert, show where the Earth’s surface is too bright for scientists to be able to calculate the fainter “signal” from aerosols.
The aerosol patterns shown result from a mixture of human and natural activities. Northern Africa, eastern China, and the Middle East all experience dust storms. China’s coal-fired power plants and vehicles produce large amounts of aerosols. Northern and central Africa, Southeast Asia, Indonesia, and Central and South America all have significant agricultural burning seasons. In the North American West, both natural and human-caused forest fires occur in the mountain forests; a sinuous line of red follows the Rocky Mountains. North of Antarctica, relentless winds whip salty sea spray into the air.
The second map shows how the 2007 annual mean deviated from the eight-year mean. Places where there were more aerosols than average are red, while places where there were fewer aerosols than average are blue. Burning in South America was particularly strong in 2007. Smoke from the Amazon Basin spread southward to coastal Uruguay and northern Argentina. Eastern China stands out as a strong positive anomaly in 2007, exhibiting higher annual mean aerosols than even its already high, eight-year mean. India shows a slightly positive anomaly, as does the Sahel region of West Africa.
On the other hand, smoke from Indonesia, particularly the island of Borneo, where peat fires often choke the skies in the burning season, was unusually low, as was smoke from central Africa. Aerosol levels in high boreal latitudes were also unusually low, indicating that 2007 was not a big year for boreal forest fires.
References & Resources
NASA images by Jesse Allen, based on MODIS aerosol data provided by Richard Kleidman (SSAI), Lorraine Remer (NASA/GSFC), and Shana Mattoo (SSAI). Caption by Rebecca Lindsey, based on interpretation provided by these scientists on the NASA-GSFC Climate and Radiation Branch Website.
None