![Request for Information – Potential [Placeholder for Prize]](https://assets.science.nasa.gov/dynamicimage/assets/science/missions/a-step/FFR_Earth_Background_20251120%20.png?w=1024)


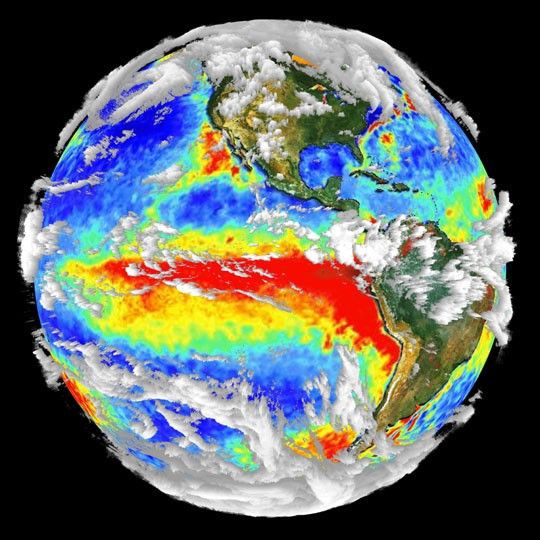
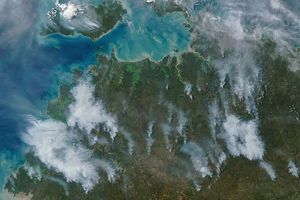
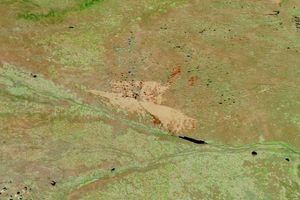
This is the first map of the equatorial distribution of fires derived from satellite data since December 1993. It shows man-made and natural fires for September, 1999. Dark red indicates low numbers of fires (1-5 per month), orange and white represent increasing numbers of fires, up to about 100.
The data, derived from the Visible and Infrared Scanner (VIRS) aboard theTropical Rainfall Measuring Mission (TRMM), show the number of 4.4 square kilometer pixels in each half-degree grid cell (each cell is 2500 square kilometers at the equator), that are hot enough to contain a large fire. Each data point was normalized to acount for TRMM's unique orbit, and the latitude dependant change inarea for each half-degree pixel.
These data, summarized for each month are currently being used to monitor natural and man-made fires in the Tropical and Sub-tropical zones (+/- 40 degrees from the equator). Forest and savanna fires in the tropics are known to affect both regional and global climate, ecology, biodiversity, and air quality.
For more information, see:
4km2 Fires (Monthly Data)
Global Fire Monitoring
Tropical Deforestation
Fire!
References & Resources
Courtesy L. Giglio, J. Kendall, and C. Mayhew, SSAI; data from TRMM VIRS
None