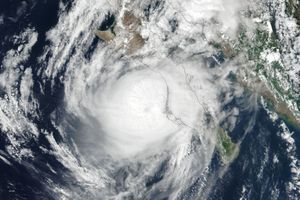

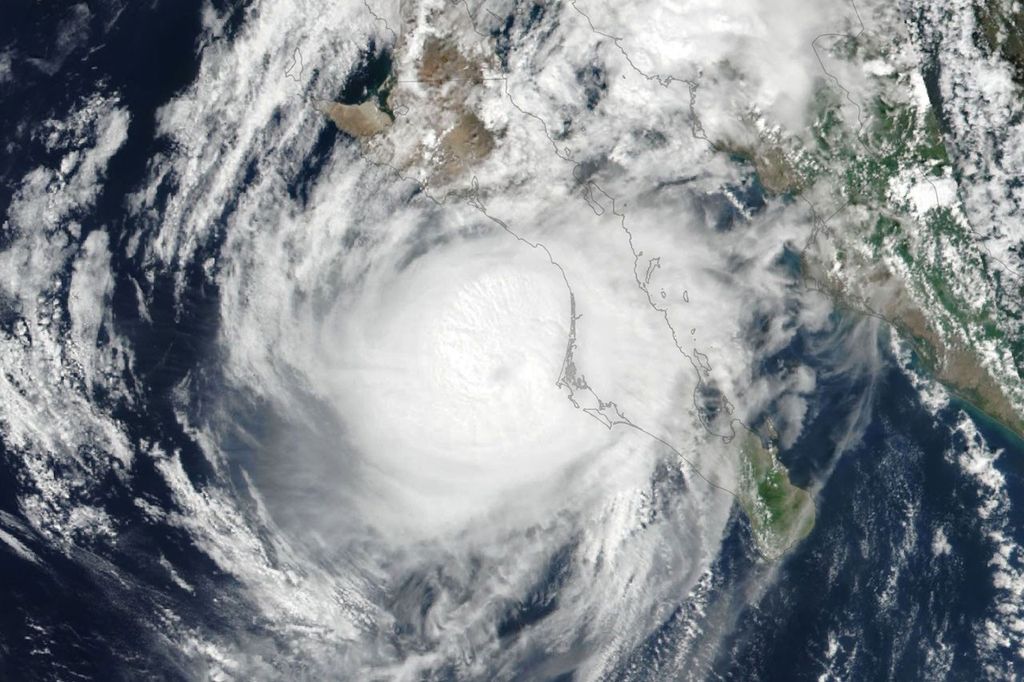











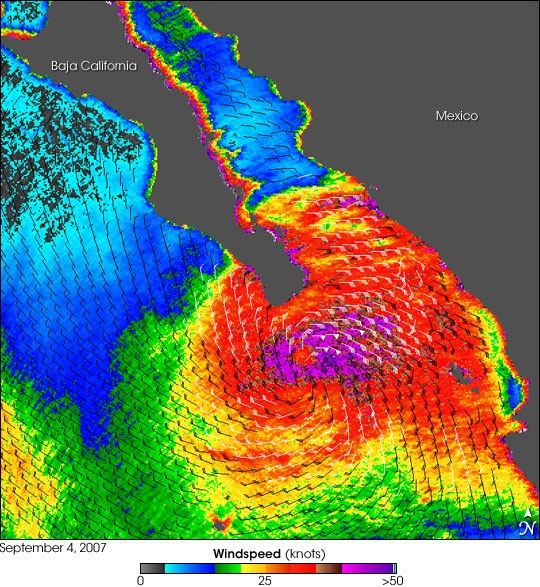
The 2007 eastern Pacific hurricane season had been relatively quiet when Hurricane Henriette formed in late August. Henriette was the first hurricane of the season to make landfall in that basin, skirting the Mexican coastline as it developed between August 30 and September 4, 2007. The National Hurricane Center predicted that the storm would come ashore over Baja California on September 4 as a strengthening Category 1 hurricane before traveling north through Mexico and into the United States.
This data visualization of the storm shows observations from the QuikSCAT satellite on September 4, 2007, at 6:57 a.m, local time (12:57 UTC) just as Henriette was starting to come ashore on the southern tip of the Baja California peninsula. At this time, Henriette was a Category 1 hurricane with peak winds around 110 km/hr (65 mph; 65 knots), matching predictions from the National Hurricane Center. The image depicts wind speed in color and wind direction with small barbs. White barbs point to areas of heavy rain.
QuikSCAT measurements of the wind strength of Hurricane Henriette and other tropical cyclones can be slower than actual wind speeds. QuikSCAT’s scatterometer sends pulses of microwave energy through the atmosphere to the ocean surface and measures the energy that bounces back from the wind-roughened surface. The energy of the microwave pulses changes depending on wind speed and direction.
To relate the radar signal to actual wind speed, scientists compare measurements taken from buoys and other ground stations to data the satellite acquired at the same time and place. Because the high wind speeds generated by cyclones are rare, scientists do not have corresponding ground information to know how to translate data from the satellite for wind speeds above 50 knots (about 93 km/hr or 58 mph).
Also, the unusually heavy rain found in a cyclone distorts the microwave pulses in a number of ways, making a conversion to exact wind speed difficult. Instead, the scatterometer provides a nice picture of the relative wind speeds within the storm and shows wind direction.
References & Resources
NASA image courtesy of David Long, Brigham Young University, on the QuikSCAT Science Team , and the Jet Propulsion Laboratory.