


May 2, 2019-April 29, 2020
New Zealand Browned by Drought
December through February—summer in the Southern Hemisphere—are typically the driest months in north and central New Zealand. The 2019-2020 summer season was especially dry, leaving the entirety of North Island in severe meteorological drought. March and April brought little relief, intensifying one of the most severe droughts on record for the region.
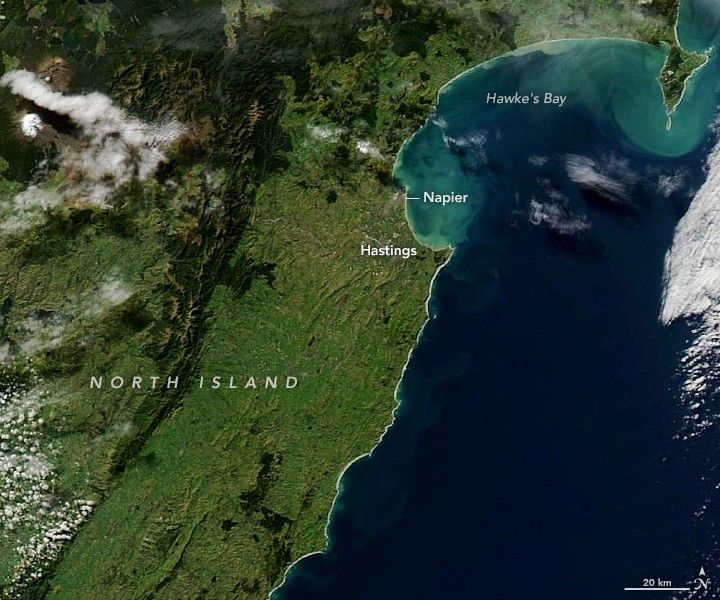
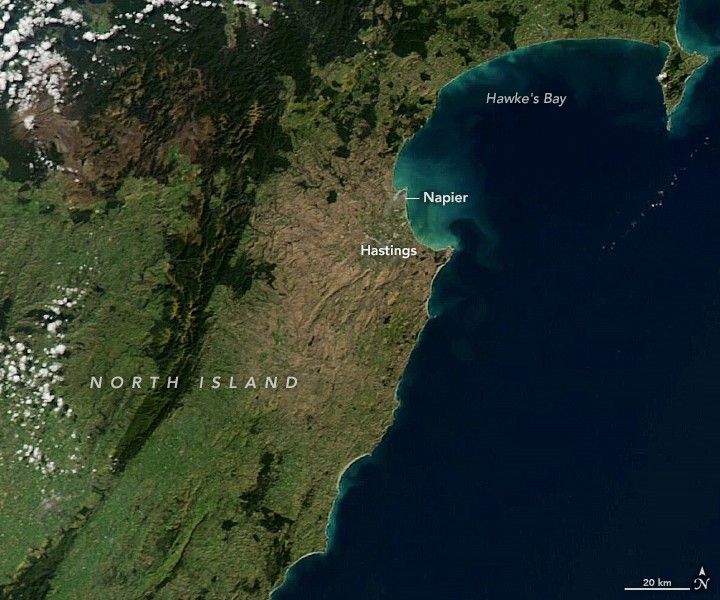
The drought’s impact on plants and trees is visible in these natural-color images, acquired with the Moderate Resolution Imaging Spectroradiometer (MODIS) on NASA’s Aqua satellite. The right image shows North Island’s Hawke’s Bay region on April 29, 2020; the left image shows the same region on May 2, 2019 (a more typical year). Much of the light green areas, which saw the most change, are pastoral and agricultural land; darker green areas are forested.
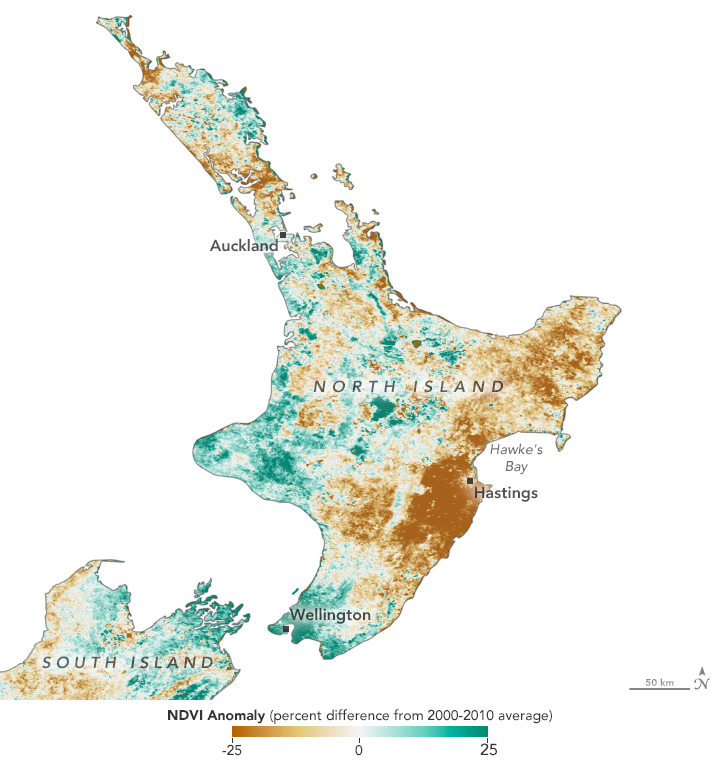
Another way to detect stressed vegetation is with the Normalized Difference Vegetation Index (NDVI). Based on data from MODIS on the Terra satellite, NDVI is a measure of the health or âgreennessâ of vegetation based on how much red and near-infrared light it reflects. Healthy vegetation with lots of chlorophyll reflects more near-infrared light and less visible light.
The map above shows NDVI anomalies—how much plant health was above or below the norm. It compares vegetation health from March 5 to May 3, 2020, against the longer-term average (2000–2010) for those months. Brown areas show where plants were more stressed than normal, and greens indicate vegetation that was healthier than normal.
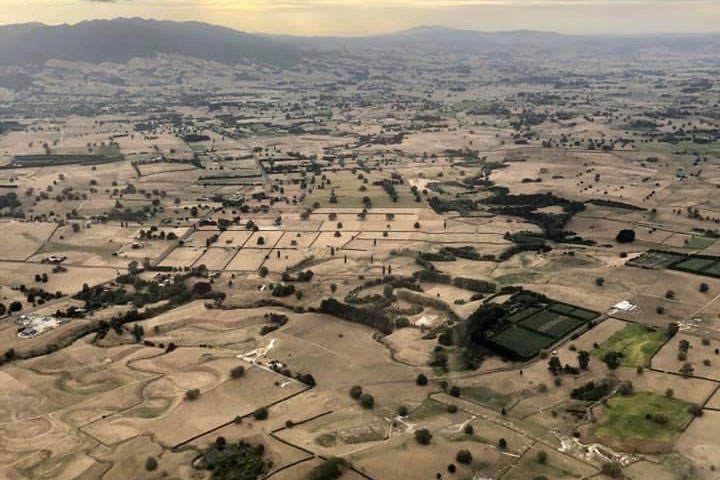
According to New Zealand’s National Institute of Water and Atmospheric Research (NIWA), drought in some parts of the country this year rivals that of 2013—at the time, the country’s worst drought in decades. Hasting saw 29 continuous days of drought in 2020 compared to 33 days in 2013. The Waikato District, south of Auckland, saw 61 continuous days of drought in 2020 compared to 63 days in 2013. The photograph above, shot by NIWA’s Sarah Fraser, shows the browned landscape of Waikato in February 2020.
Auckland has been especially hard hit; 77 continuous days of drought in 2020 contributed to the city’s driest January-April period on record. The lack of rain in Auckland has left reservoirs at about 46 percent of capacity compared to the average 76 percent for the time of year.
Thunderstorms in early May 2020 finally delivered much needed rain to parts of New Zealand’s North Island, but it was not enough to bring the area out of drought. Water shortages have prompted officials to consider mandatory water restrictions.
References & Resources
- NASA Earth Observatory (2013, April 26) Drought in New Zealand.
- National Institute of Water and Atmospheric Research (2020, May 7) Weather: Skies clearing after thunderstorms bring welcome rain. Accessed May 7, 2020.
- National Institute of Water and Atmospheric Research (2020, May 5) Drought hits hard, far and wide. Accessed May 7, 2020.
- NZ Herald (2020, May 7) Auckland water shortage: Outdoor use set to be banned, fines of up to $20,000. Accessed May 7, 2020.
- NZ Herald (2020, May 6) Drought hits hard, far and wide. Accessed May 7, 2020.
NASA Earth Observatory images by Lauren Dauphin, using MODIS data from NASA EOSDIS/LANCE and GIBS/Worldview. Photo by Sarah Fraser/NIWA. Story by Kathryn Hansen.


