


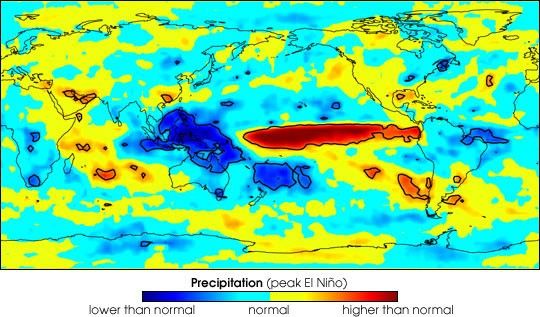
El Niño—the periodic weakening of trade winds and warming of ocean water in the equatorial Pacific—has effects that reach across the globe. Perhaps the most significant of its effects is change in rainfall patterns—El Niño has been linked to drought in some parts of the world while causing flooding in others. Although the basic rainfall patterns associated with El Niño are widely known, the details remain unclear. Using a time series of global precipitation data, NASA scientists are bringing the effects of El Niño into sharper focus.
Scott Curtis and Bob Adler studied precipitation from six El Niños dating back to 1982. Instead of looking at the data seasonally—data from December, January, and February, for example—they viewed the data from distinct phases of each event. The onset phase, for example, consists of 3 to 5 months while precipitation shifts from the western to the eastern pacific. The peak phase occurs while the El Niño caused the largest changes in precipitation between each side of the Pacific. This was important because El Niño does not always peak in the Northern Hemisphere winter, when it is typically studied. The researchers separated the effects of El Niño from its timing.
Their study revealed previously hidden patterns. It turns out that precipitation changes around the world even as an El Niño is gaining strength. The map above shows the change in precipitation during peak El Niño. The strongest droughts (blue) are over Indonesia and Papua, New Guinea. Other areas with sharply reduced precipitation are eastern Brazil, South Africa, and the Maritime Provinces of Canada. The largest increase in precipitation is over the equatorial Pacific, while other significant areas of increased precipitation are the Persian Gulf and southern South America. This research is also revealing the effects of El Niño far from the borders of the Pacific Ocean, which gives clues to the global changes in atmospheric circulation.
For more information, read: NASA Discovers a Soggy Secret of El Niño
Reference:
Curtis, Scott and Adler, Robert F. (2003) Evolution of El Niño-precipitation relationships from satellites and gauges, Journal of Geophysical Research Vol. 108 No. D4 28 February 2003
References & Resources
Image courtesy Scott Curtis, University of Maryland - Baltimore County